Alabama’s population became more diverse over the past decade as the number of non-Hispanic Whites declined and more Alabamians identified as being of a different race, a mixture of races, or of Hispanic descent. In 2010, 67% of Alabama’s population identified as non-Hispanic White; By 2020, that percentage was down to 63%. That’s according to 2020 Census data released earlier this year.
The 2020 Census marked the first decennial census in history that either Alabama or the U.S. recorded a decline in the White population. Demographers expected a decline due to falling birth rates and the aging of the population, including the unusually large and predominately White Baby Boom population. Black, Hispanic, Asian, and American Indian populations all increased. But the biggest change was in the number of people identifying as More than One Race, indicating an erosion in traditional ethnic and racial distinctions.
The Census Bureau cautions that some portion of the decline in the “Non-Hispanic White alone” population is likely due to changes in how people responded to new wording on the race question. The Census Bureau changed the wording and presentation of the race question on the 2020 Census. In 2020, for the first time, the “White” choice was followed by example countries of origin in Europe, the Middle East, and North Africa. Similarly, the Black or African American option listed African and Caribbean nations as example origins. All respondents were asked to elaborate on their origins in a text box below their selection. This change from 2010 appears to have led more individuals to reclassify themselves as not being “White alone” but instead as being of more than one race or origin. Regardless, the Bureau believes the new totals present a more accurate picture of an increasingly diverse nation.
Nationally, the non-Hispanic “White alone” population decreased by 5 million or 2.6% from 2010 to 2020.
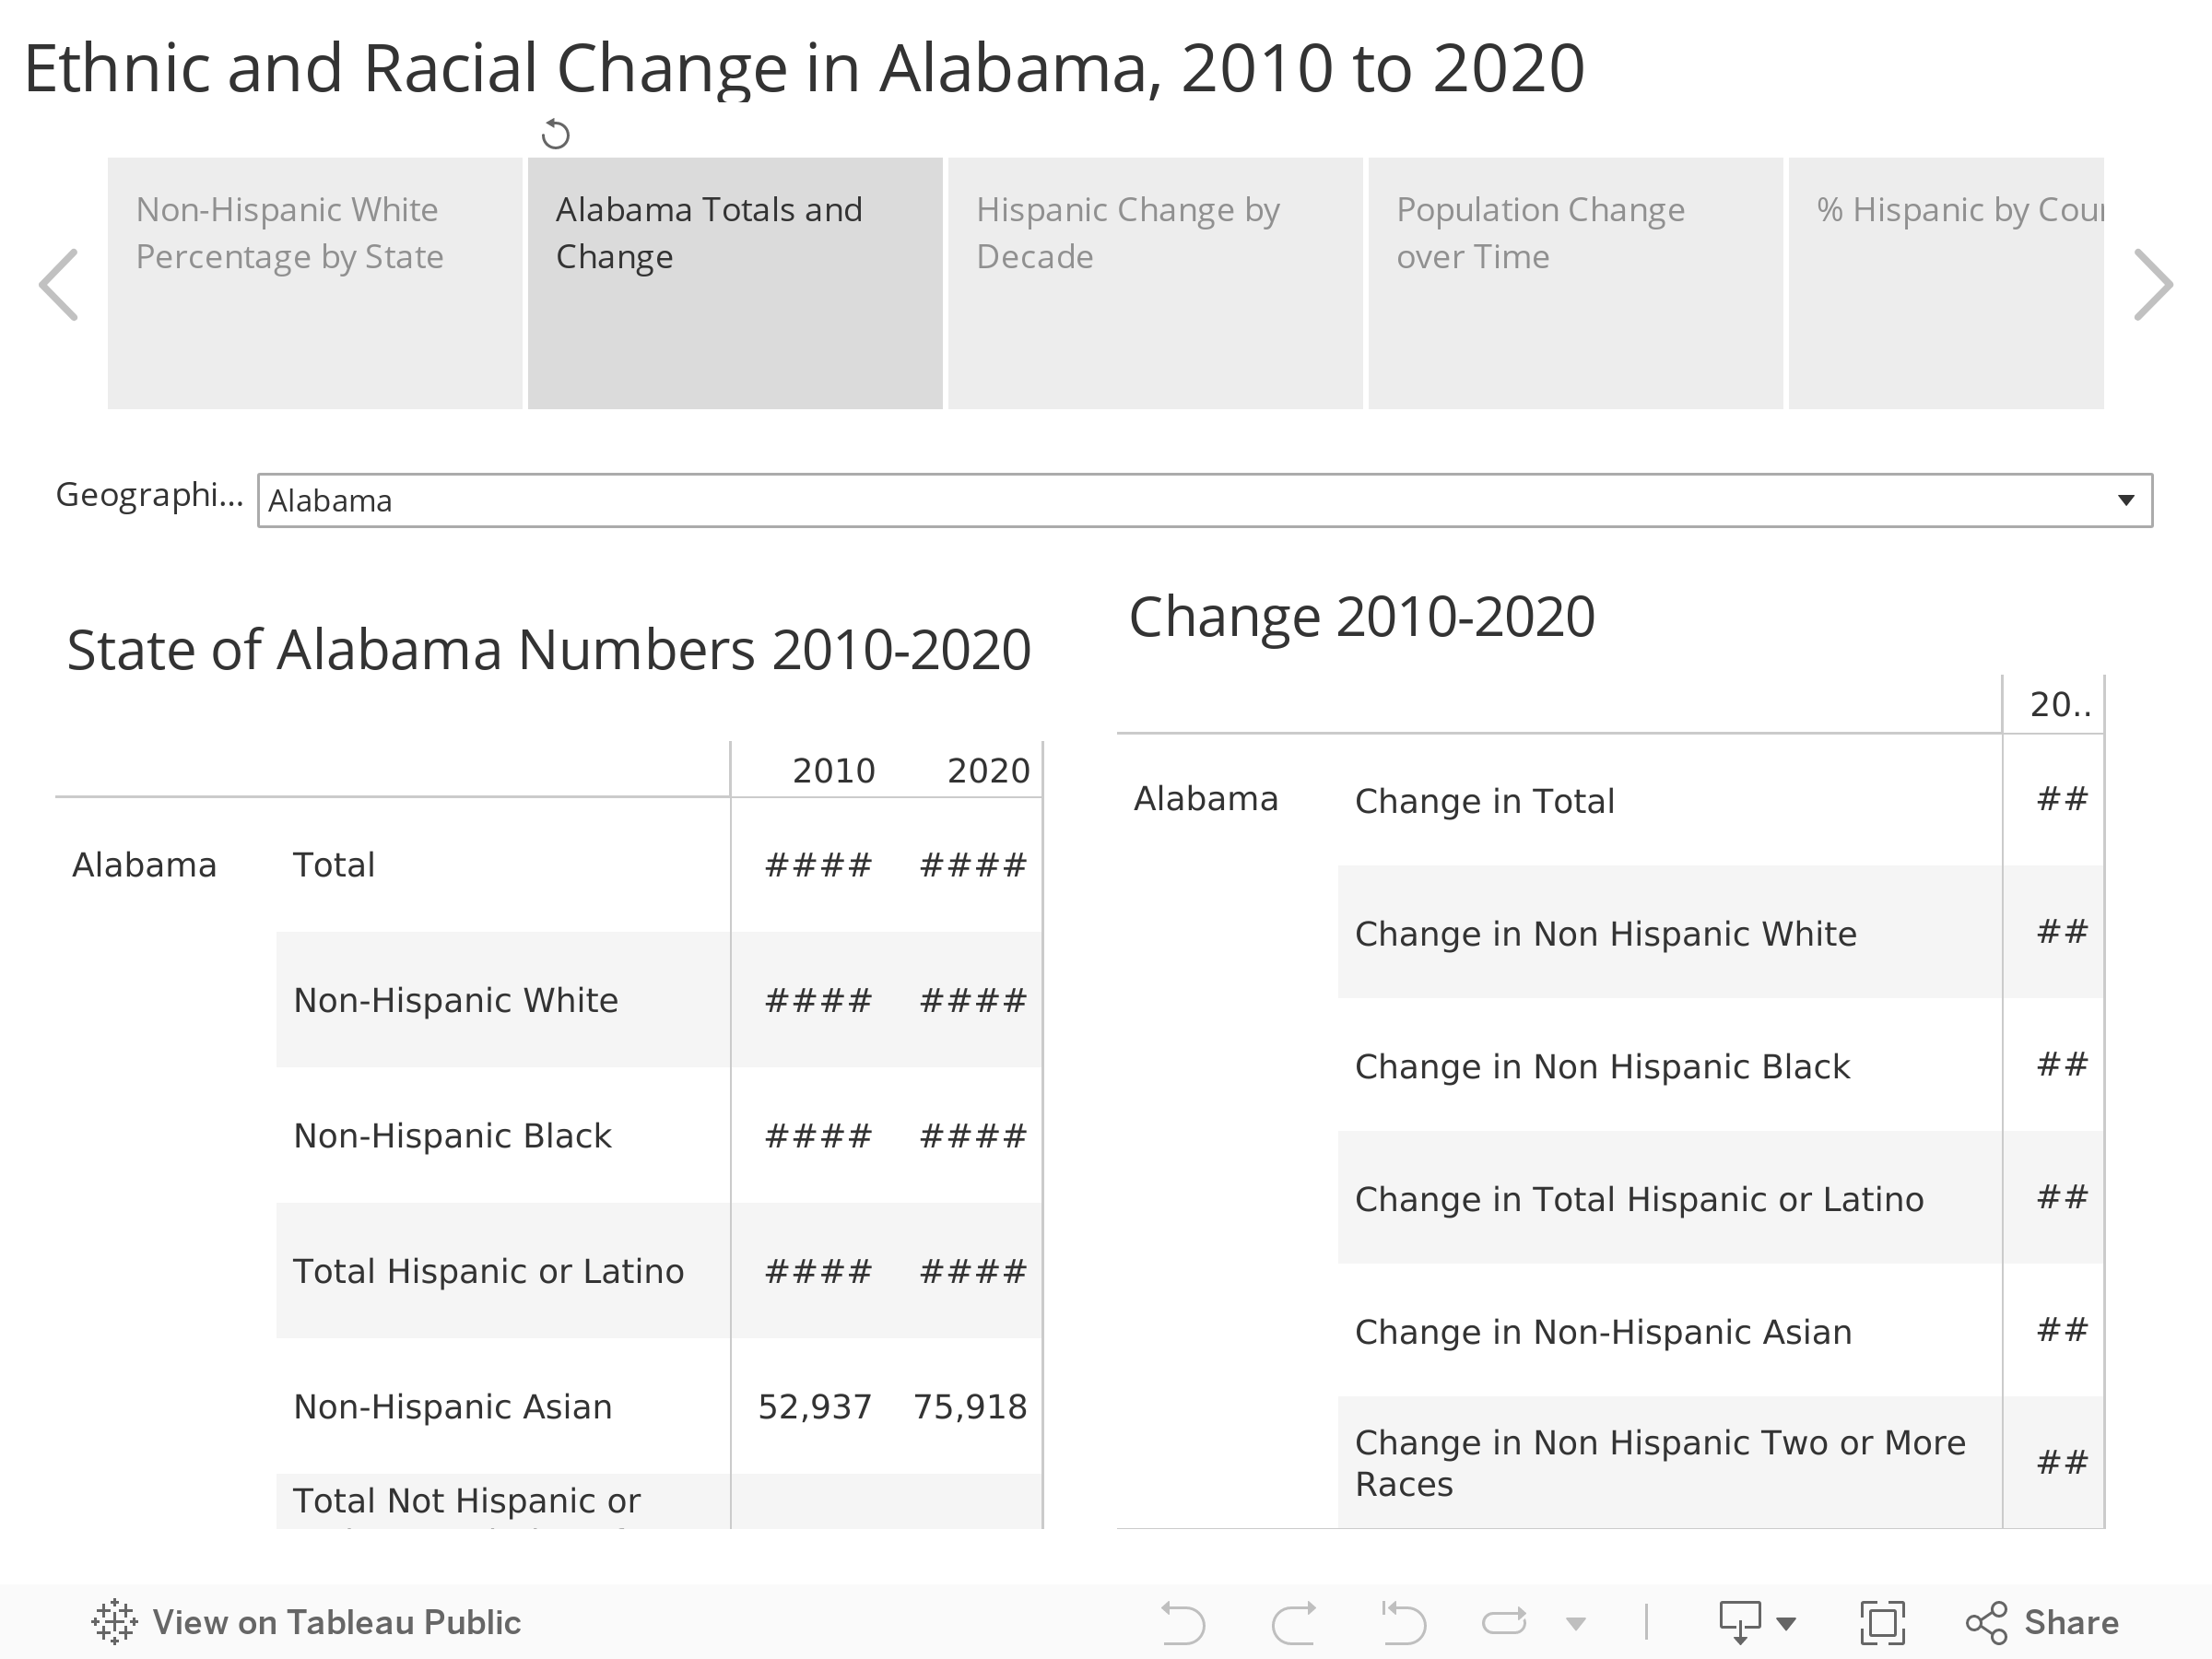
In Alabama, that population declined by 33,000, from 3.20 million to 3.17 million. Meanwhile, the number of people identifying as non-Hispanic and of more than one race far exceeded the increase in any other category, 124,173, compared to the 78,445 increase in the Hispanic population, the second fastest growing group. The number of non-Hispanic residents who reported themselves as White in combination with another race rose by 118,249, a 222% increase, from 53,260 to 171,509, from 1.2% of the population to 3.6%. The number of respondents who reported themselves as Black in Combination with another race also rose sharply, up 130% in Alabama, the third highest growth rate in the country in that category, a numerical increase of 38,767 over 2010.
Hispanics now make up 5.3% of the Alabama population, while non-Hispanic Blacks make up 25.6%. Non-Hispanic individuals of more than one race make up 3.7% of the population, now the fourth largest demographic group.
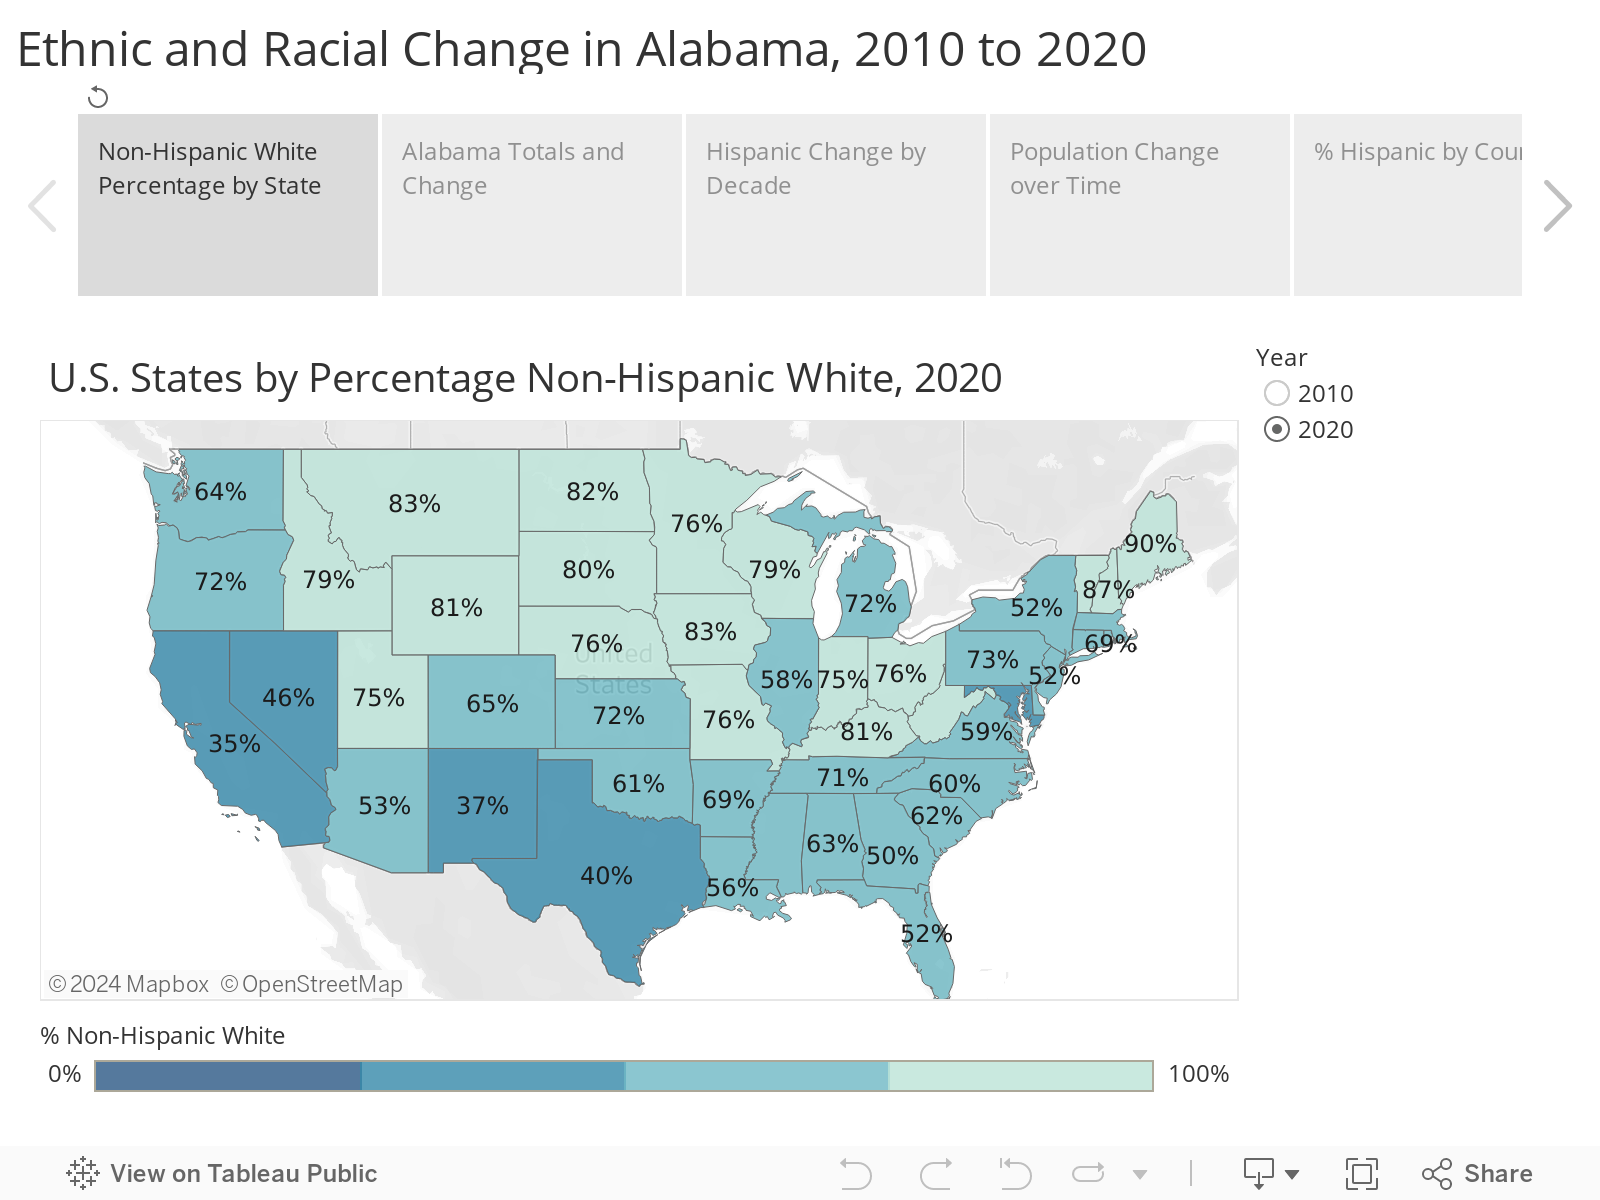
Both in Alabama and across the country, non-Hispanic whites remain by far the largest racial group representing 58% of the population nationally and 63% of the population in Alabama. Alabama’s non-Hispanic white population percentage ranks No. 30 among the states. The state with the highest share of its population identifying as non-Hispanic White was Maine at 90%, followed by West Virginia (89%), Vermont (89%), and New Hampshire (87%).
Hawaii has the lowest percentage of non-Hispanic whites, 22%, followed by California (35%), New Mexico (40%), and Texas (40%). Among its Southeastern neighbors, Georgia’s population in 2020 was 50% non-Hispanic white, while Florida’s was 52%. In all states besides Hawaii, non-Hispanic whites decreased as a percentage of the total state population.
Hispanic or Latino growth rate slows
Unlike the changes to the Census question on race, the question of whether or not the individual is of Hispanic or Latino origin has been consistent for several administrations of the Census. The official definition of “Hispanic or Latino” is a person of Cuban, Mexican, Puerto Rican, South or Central American, or other Spanish culture or origin, regardless of race.
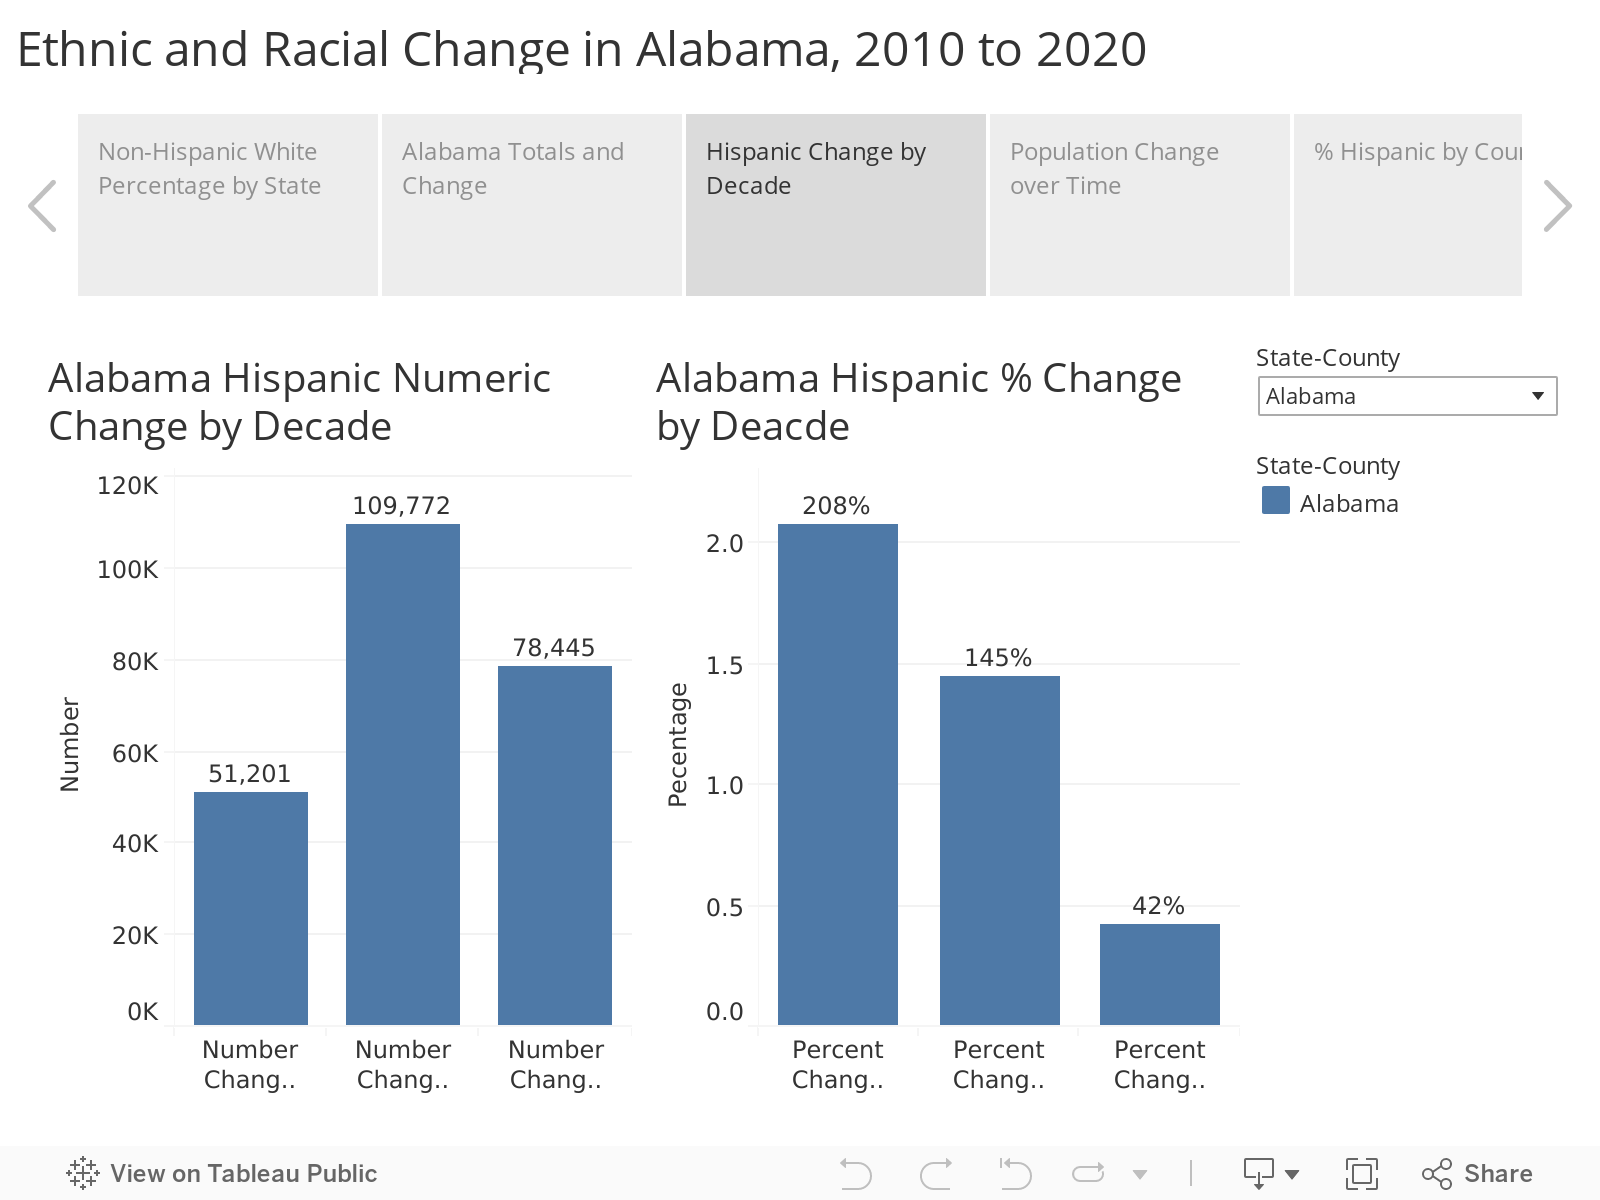
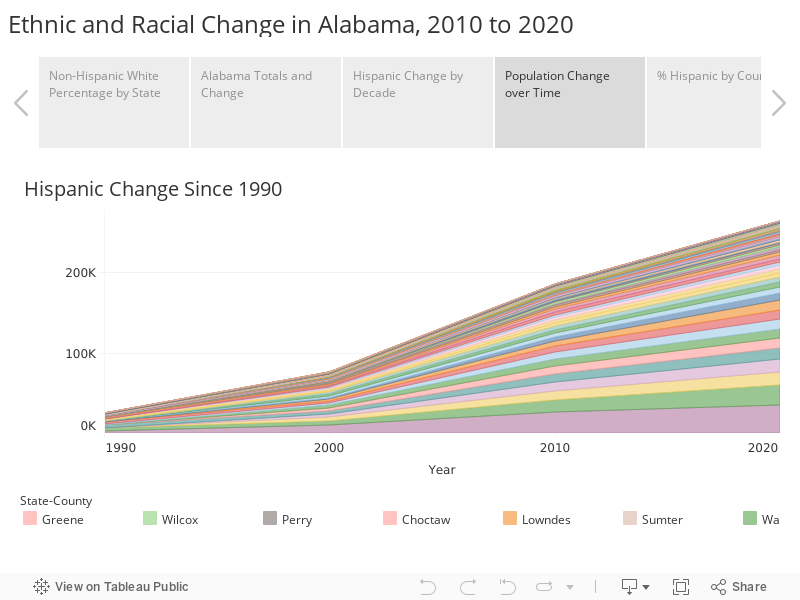
The number of Alabama residents identifying as Hispanic or Latino continued to grow between 2010 and 2020, but at a more modest pace than in previous decades. Alabama’s Hispanic population increased from 78,445 to 264,047, an increase of 42% over the course of the decade. In 2010, Hispanic or Latino individuals made up 3.9% of the Alabama population; by 2020, 5.3%.
The chart below presents decennial Census results from the U.S. Census Bureau supplemented with Census counts from the 2000 and 1990 Census analyzed by the Alabama State Data Center at the University of Alabama’s Center for Business and Economic Research.
Even without immigration, the Hispanic and Latino population will likely continue to grow more rapidly than the non-Hispanic White population because Hispanics are younger and more likely to be of child-bearing age.
The median age of non-Hispanic Whites in Alabama is 43. The median age among Hispanics is 25. Over 8% of the Alabama population under 18 is Hispanic compared to less than 2% of the population 55 and above.
Also, Hispanic mothers have a higher total fertility rate than other demographic groups. The Total Fertility Rate is the number of births that a hypothetical group of 1,000 women would have over their lifetimes. Reducing that rate to an average per female, Hispanic females average 1.9 children over a lifetime, Blacks, 1.7; for Whites, 1.5.
Demographers calculate the replacement level, the rate of births it would take to replace any given generation, to be 2.1 children per female. Generally, since the 1970s and consistently since 2008, the U.S. birth rate has been below replacement level, meaning that, absent immigration, the population will eventually decrease because not enough children are being born to replace the previous generation.
Hispanic and Latino individuals are widely dispersed across the state, appearing in every county. Much of the Hispanic population growth likely came from natural increase, state residents giving birth, rather than new immigration. For Alabama, the Census Bureau estimated that 57% of all population growth came from natural increase, 32% from international immigration, and 11% from domestic migration.
Hispanic Population in Alabama Counties
In Alabama, the counties with the highest percentage of Hispanic residents are in North Alabama, in a band stretching from Franklin County in the west to DeKalb County in the east. Those counties where the Hispanic population is most concentrated are also centers for the poultry industry, which was an initial draw for Hispanics settling in Alabama. Secondary concentrations are evident in Tuscaloosa and Pickens counties and in Southeast Alabama’s Wiregrass region. Those are also coincidental with poultry industry concentrations. Higher percentages of Hispanics can also be found in counties like Shelby, Madison, Baldwin, Lee, and Limestone, where residential and commercial construction jobs are plentiful.
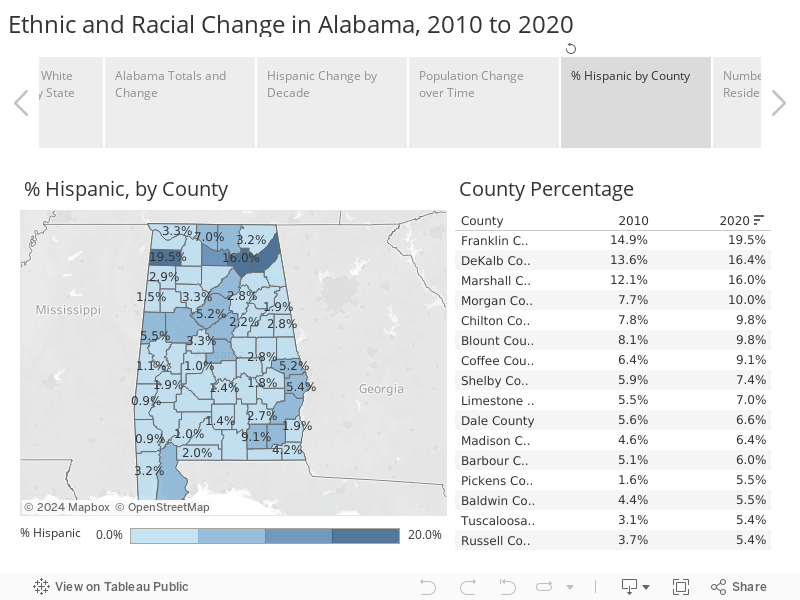
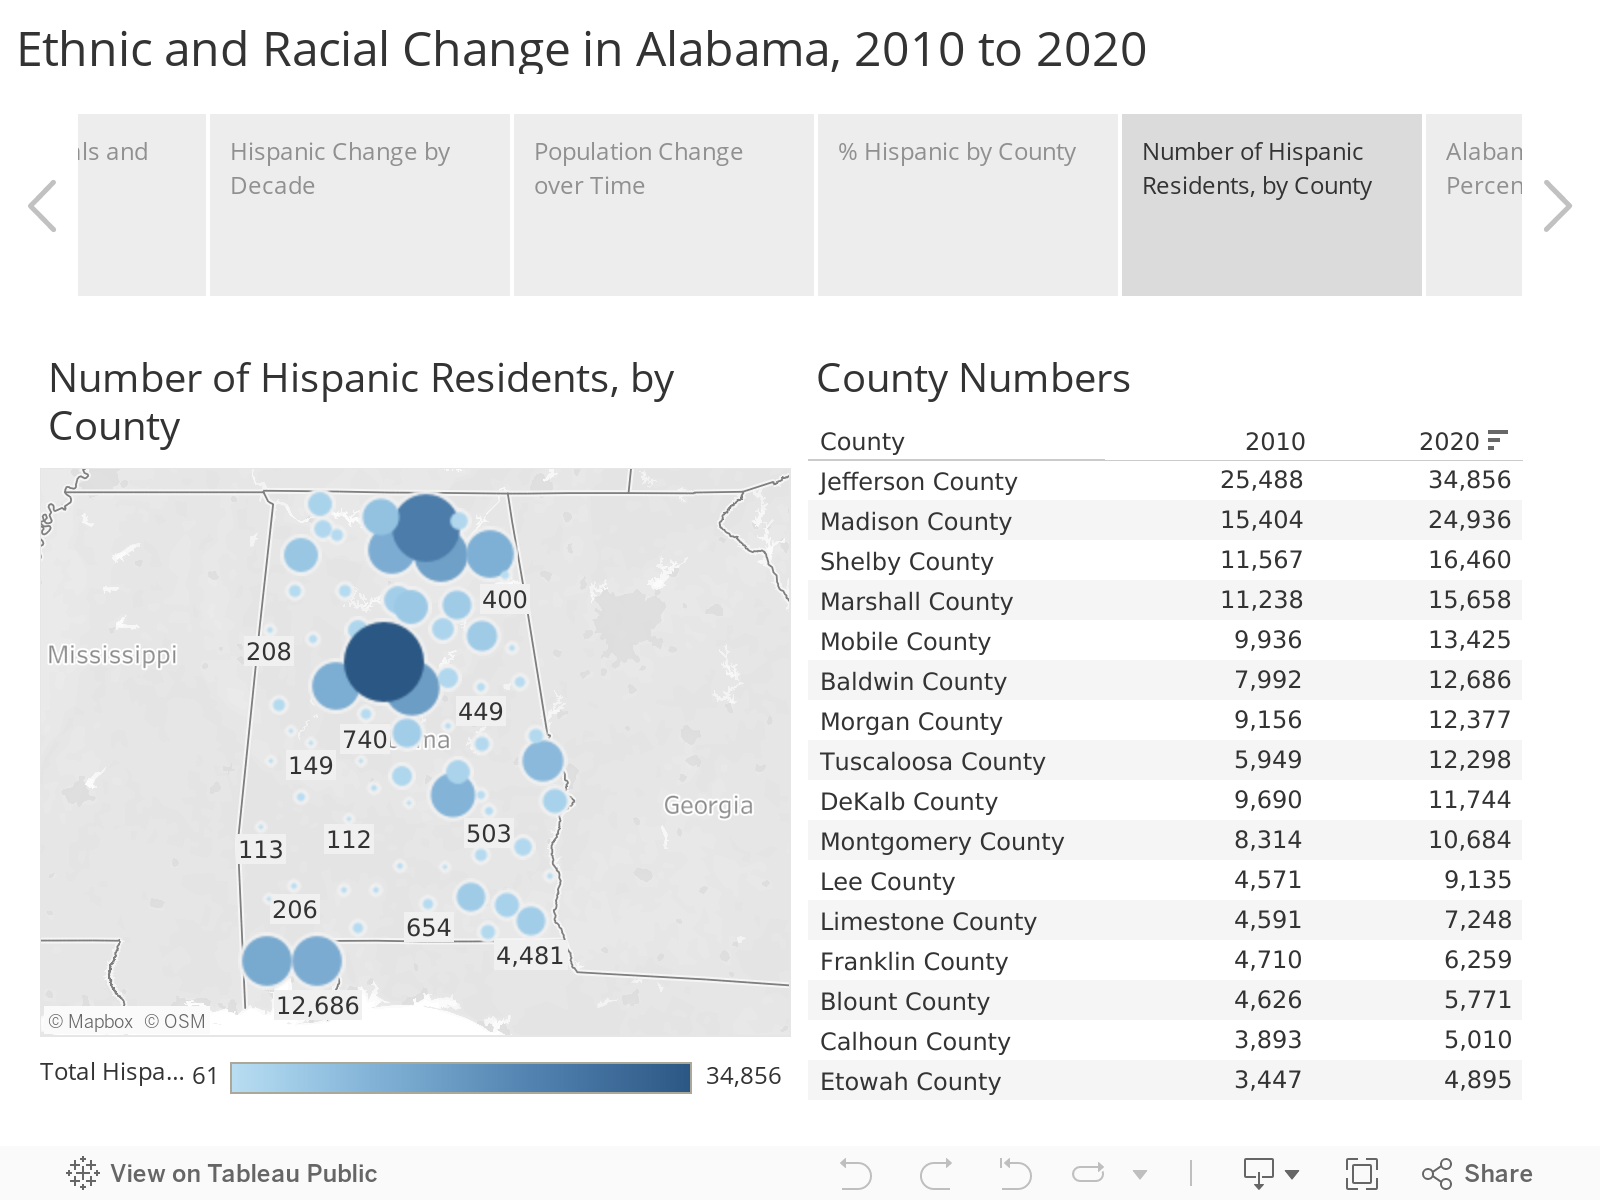
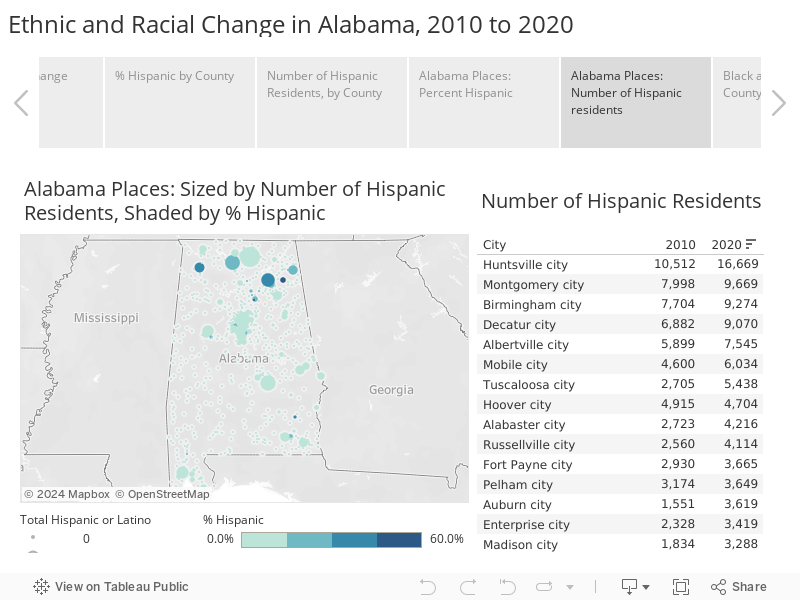
But in terms of numbers, the most Hispanic and Latino residents are found in Alabama’s more populated metro counties. Jefferson County’s Hispanic population is now nearly 35,000, while neighboring Shelby is home to over 16,000. Madison County is second in the state with almost 25,000 Hispanic and Latino residents, complemented by strong Hispanic populations in neighboring Marshall (15,658) and Morgan (12,377) counties. Madison added more Hispanic residents than any other Alabama county over the previous decade.
Hispanic Population in Alabama Places
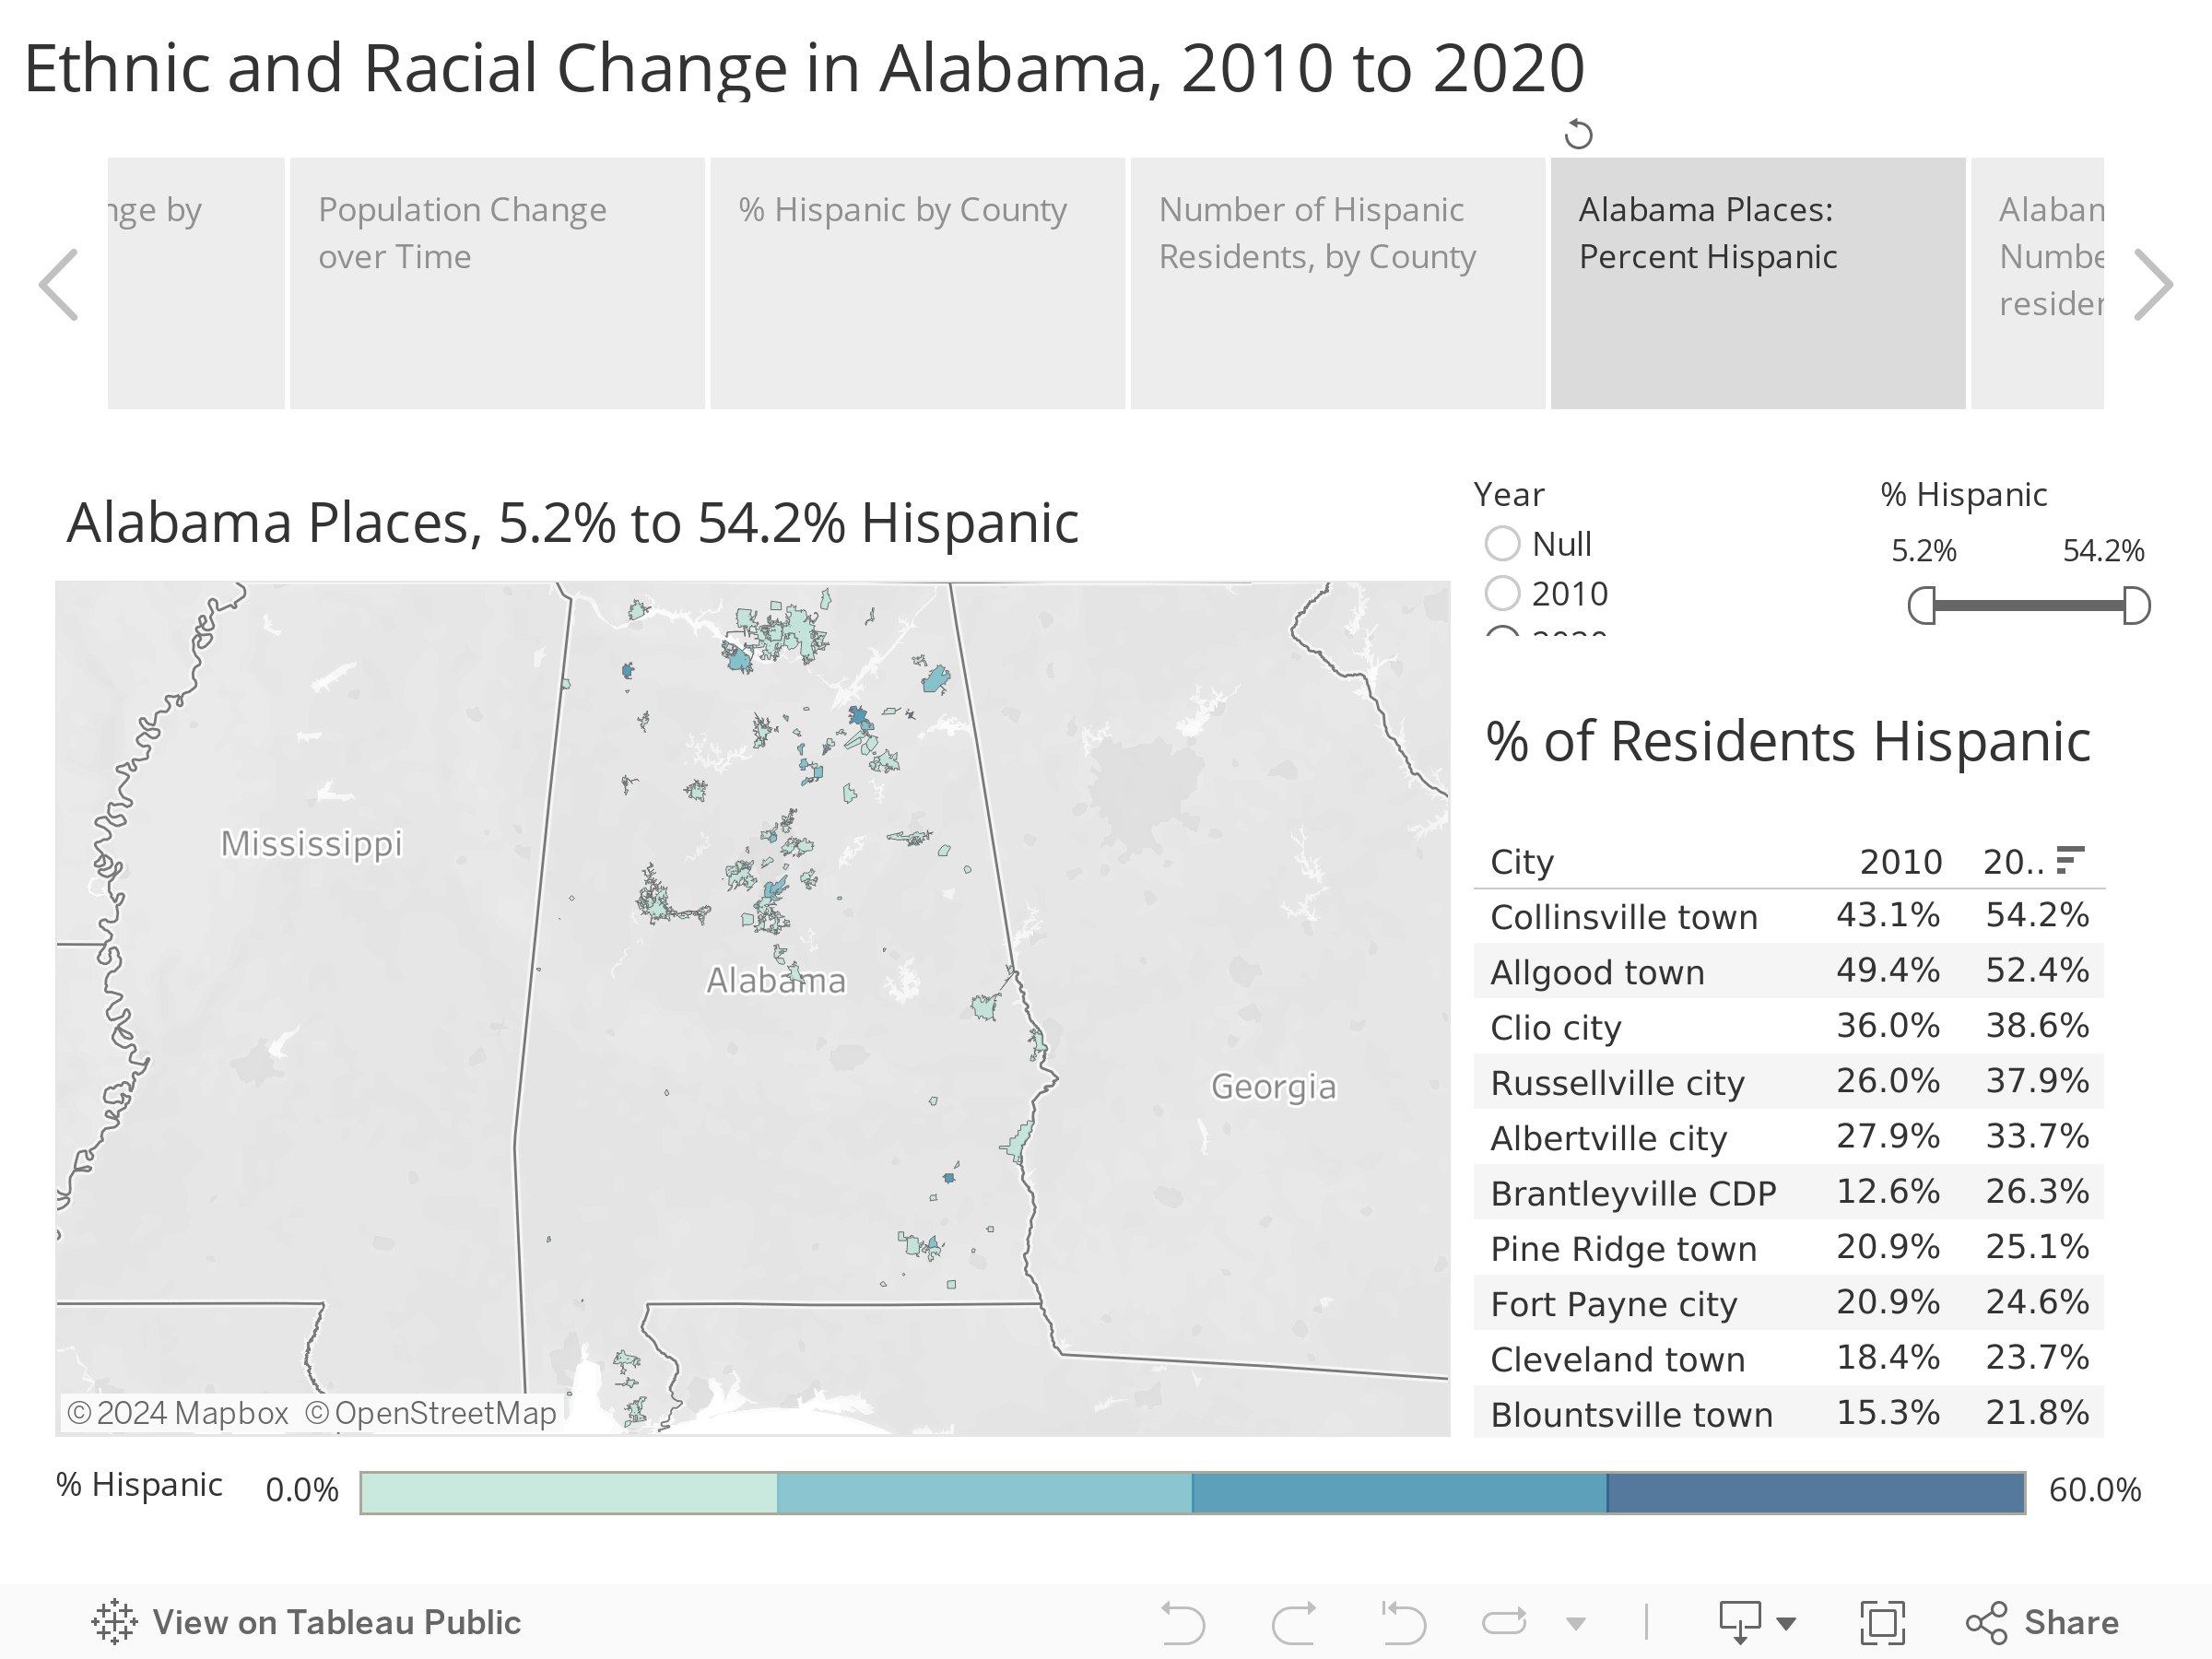
Parallel geographic concentrations of Hispanic individuals can be seen in the population of Alabama cities, towns, and places. Alabama now has two municipalities where a majority of the population is Hispanic: Allgood in Blount County and Collinsville in Dekalb, according to the 2020 Census.
Among cities with a population of 20,000 or more, Albertville (population 22,386) has the highest Hispanic percentage of population, with the 7,545 Hispanics living there constituting 34% of the city’s population.
In terms of numbers of Hispanic inhabitants, the larger populations are found in the state’s big cities. Huntsville has more Hispanic residents, 16,669, than any other Alabama city, followed by Montgomery, Birmingham, and Decatur, each with over 9,000 Hispanic residents.
Near Birmingham, Hispanic communities along the Interstate 65 corridor in Hoover, Pelham, and Alabaster total over 10,000. Out of 597 Alabama cities, towns, and places, 450 saw either flat or increases in the Hispanic population. Among Alabama cities above 20,000 in population, only two, Hoover and Homewood, saw a decline in their Hispanic populations over the decade. Homewood was down by 417, Hoover by 211.
Black and White: Enduring Patterns and Subtle Changes
While the Hispanic, Asian, and multiracial populations are of interest because of their rate of change, the enduring story of Alabama is the population patterns of Black and White, a story stretching back to statehood.
The general pattern remains in Alabama: 11 counties are majority black, the south central Alabama counties of the Black Belt, named for their rich soil, counties that historically had the highest concentration of cotton plantation agriculture and enslaved persons. Those black majorities persisted after emancipation and continue today.
Greene County has the highest percentage of non-Hispanic Black population, over 80%. The most populous majority black county is Montgomery County, with over 229,000 residents, 55% of whom are Black.
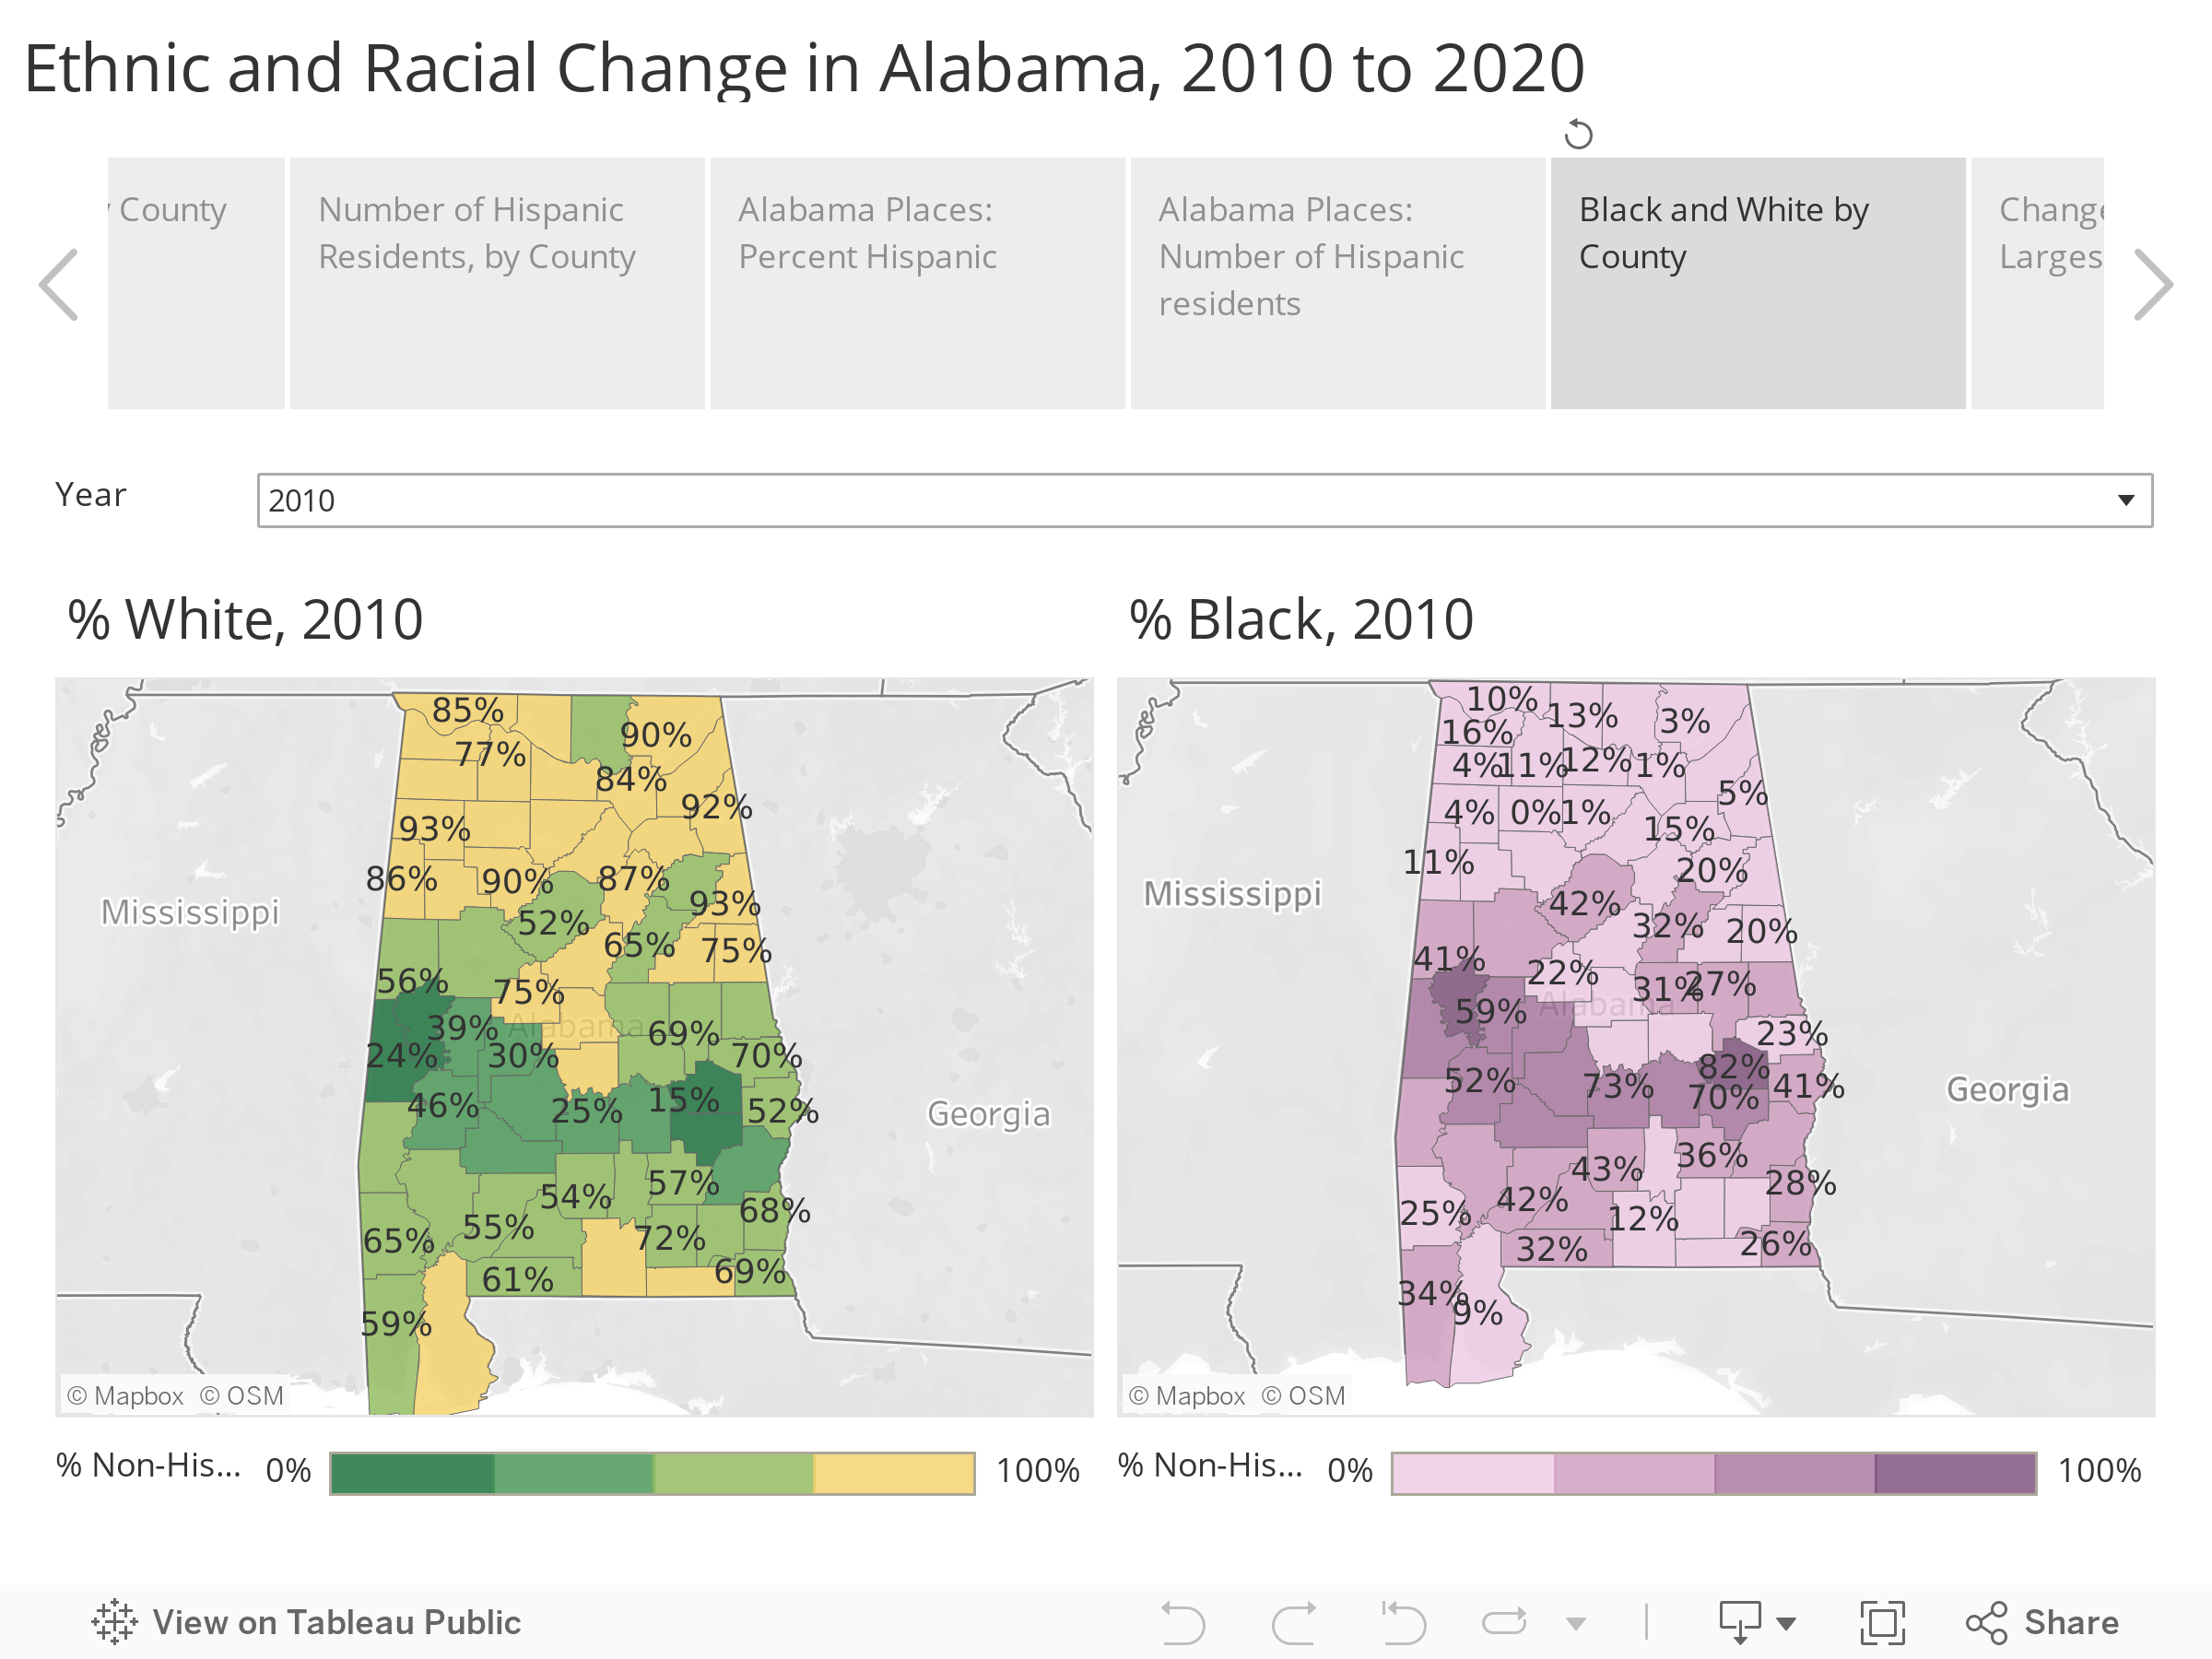
Meanwhile, Winston County, in rural northwest Alabama, has the highest percentage of Non-Hispanic White residents at 92%, with Cleburne (91%), Cherokee (90%), Cullman (89%), and Marion (89%) not far behind.
In 11 counties, the Non-Hispanic White population increased. Baldwin County saw the largest increase over the decade, with a gain of 34,000, followed by Madison, Lee, and Limestone. However, those counties all diversified as well. Blacks, Hispanics, and other groups also grew in numbers.
The counties with the most significant decline in the number of residents identifying as Non-Hispanic White were Mobile (-17,201), Jefferson (-15,961), and Montgomery (-14,745). Remember that some of that “decline” in the count may be attributed to individuals reclassifying themselves. However, those population changes in the white population correspond with overall population counts and flows that show continuing movement to suburbs located in adjacent counties.
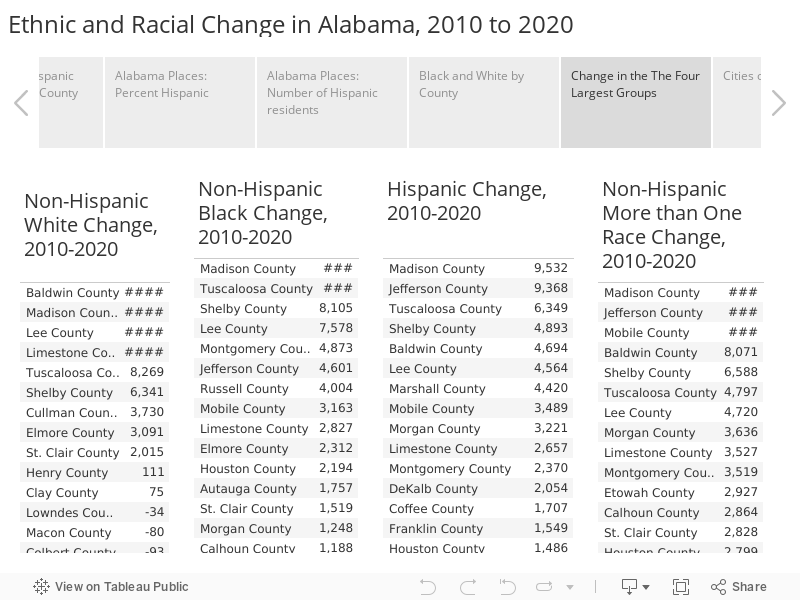
In each of the central metro counties, the percentage of the population identifying as non-Hispanic White has declined as a share of the population as the Black, Hispanic, and other racial and multiracial subgroups increase. Non-Hispanic Whites represented 52% of Jefferson County’s population in 2010; by 2020, that percentage was 48%. Blacks make up 42% of the Jefferson County population in 2020, roughly the same percentage as in 2010. The Hispanic population grew by over 9,000, increasing from 4% to 5% of the population. The group with the biggest increase in Jefferson County was non-Hispanic More than One Race, up 12,921, constituting 3% of the population.
In Montgomery County, 38.4% of the population was non-Hispanic White in 2010; In 2020, 32%. The Black majority in Montgomery County increased from 55% to 57%. Hispanics increased by 2,370, now representing 2% of Montgomery County’s population, up from 1% in 2010. Asians 3,160, now 4% of the population, while the non-Hispanic More than One Race category increased by 3,519 and in 2020 representing 3% of the population.
In Mobile County, the non-Hispanic White population percentage went from 59% in 2010 to 55% in 2020. The Black population increased by 3,163, or 35% of the county population. The Hispanic community increased by 3,489, raising its share of the population to 3.2%. Like Jefferson County, Mobile County’s biggest growth category was in the non-Hispanic More than one race category, which gained over 10,000, making it the second most populous minority group at 3.7% of the population.
Meanwhile, Madison County’s non-Hispanic White population increased by 16,000, but its Black population grew by 16,052, non-Hispanic More than One Race population grew by 13,027, and its Hispanic population increased by 9,532. Despite the growth in the non-Hispanic White population, its population percentage decreased from 66% of the population in 2010 to 61% in 2020.
Just as whites have sought out new housing opportunities in the suburbs, Blacks make up an increasing percentage of the population in Shelby and St. Clair Counties around Birmingham and are also an increasing percentage of the population in Autauga and Elmore counties outside of Montgomery.
Meanwhile, the Black population is also decreasing in Alabama’s Black Belt,
Race in Alabama Cities, Towns, and Places
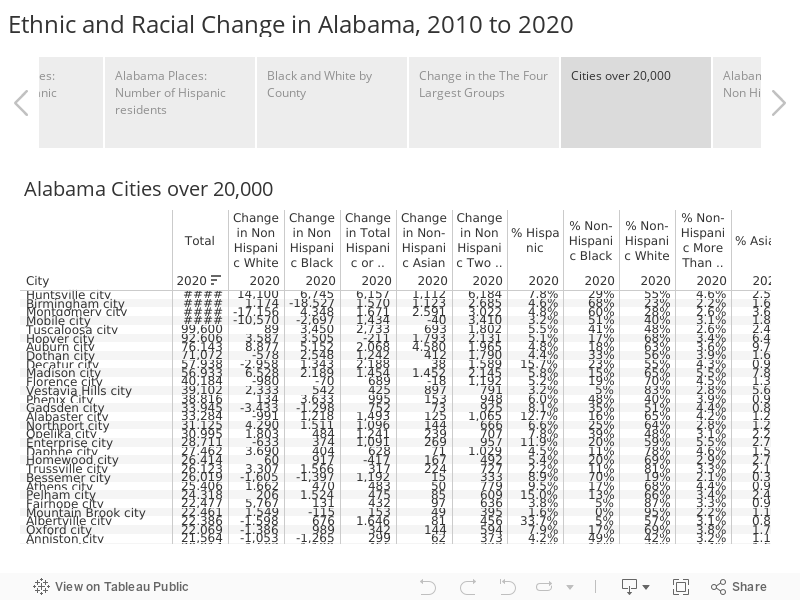
When looking at cities, some subtle shifts can be seen in the data. Birmingham, which saw decades of White flight, saw an increase in the White population but not enough to offset significant outflows of Blacks. Meanwhile, Montgomery and Mobile, which had maintained more racial balance for longer than Birmingham, saw outflows of White residents and growth in other demographic groups.
In Huntsville, populations increased across all racial and ethnic groups, though that multifaceted growth also produces a diversified population.
Birmingham
Between 2010 and 2020, Birmingham saw a modest gain in its non-Hispanic White population, with an additional 1,000 residents identifying as non-Hispanic White. Meanwhile, Birmingham’s Black population declined by almost 20,000. The city added about 1,500 Hispanic residents, and the number of individuals identifying as non-Hispanic More than One Race was up 2,685. The city saw a net decline of 11,504. Because of the shift, Hispanics and non-Hispanic Whites now represent a slightly higher percentage of Birmingham’s population. In contrast, the Black percentage of the population declined from 73% to 68%., with 23% White, 5% Hispanic, 2% More than one Race, and 2% Asian.
Montgomery
The situation was different in Montgomery. The City of Montgomery’s Black population grew by 4,348, but the White population declined by 17,000. The Hispanic population of Montgomery increased by 1,671. But the most growth came from an increase of 2,591 Asian residents and 3,022 in those reporting More Than One Race. In 2020, Montgomery’s population was 60% Black, up from 56% in 2010. Non-Hispanic Whites dropped from 36% of the population to 28%. Asians climbed to 4% of the population, just ahead of More than One Race at 3%.
Mobile
In the City of Mobile, the White population declined by 10,570, the Black population declined by 2,697, and the Hispanic population increased by 1,434. An additional 3,410 people in Mobile identify as More than one Race compared to 2010. The Black population now represents 51% of Mobile’s population, up from 50% in 2010. The White population represents 40%, down from 44% in 2010. Hispanic and individuals of More than One Race each make up 3% of the population, while Asians represent 2%.
Huntsville
Meanwhile, in Huntsville, each of the four largest groups grew: Hispanics (+6,157) and non-Hispanic Whites (+14,100), Blacks (+6,745), and non-Hispanic More than One Race (+6,184). The non-Hispanic White population decreased in its share of the population from 58% to 55%. The Black population share decreased from 31% to 29%, but the Hispanic share increased from 6% to 8%. Individuals of More than One Race increased to 4.6% of the population, while the Asian share of the population increased slightly to 2.5%.
Growth in the Asian Population
Though the Asian population in Alabama is smaller in comparison to other demographic groups, there has been notable growth in some areas.
The small fishing town of Bayou La Batre in south Mobile County is the Alabama city with the highest percentage of Asians in the population. The Vietnamese community there, established by people fleeing the aftermath of the Vietnam War, represents 20% of the city’s population. However, over the past decade, the number of Asian residents declined by 162.
Meanwhile, the Asian population has grown significantly in several communities and counties along the Interstate 85 corridor, home to Hyundai, Kia, and automotive suppliers with ties to South Korea. Auburn’s population is 10% Asian, after adding 4,580 Asian residents between 2010 and 2020. Montgomery’s Asian population increased 2,591, and neighboring Pike Road added 472 Asian residents.
The Asian population also increased in the Birmingham metro — Hoover (+1,793), Birmingham (+1,123), and Vestavia Hills ($897) — and in Huntsville (1,112) and Madison (+1,452).
Conclusion
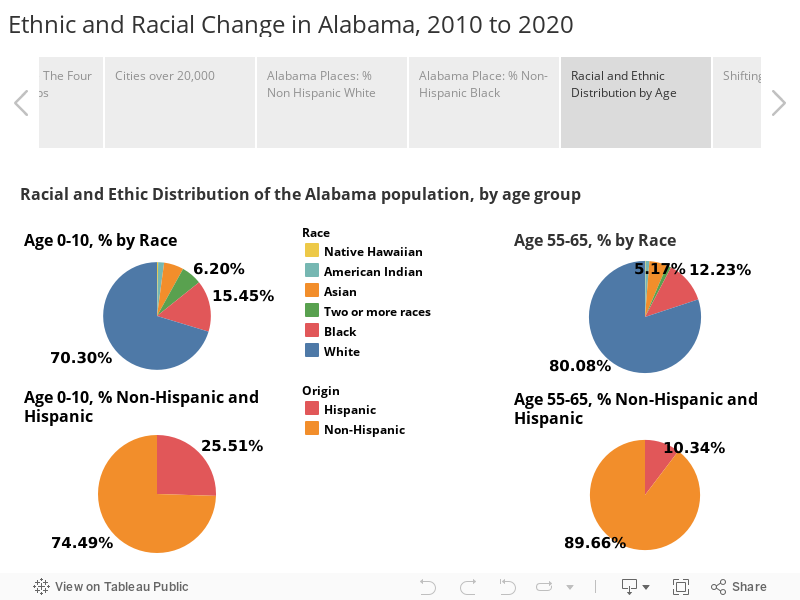
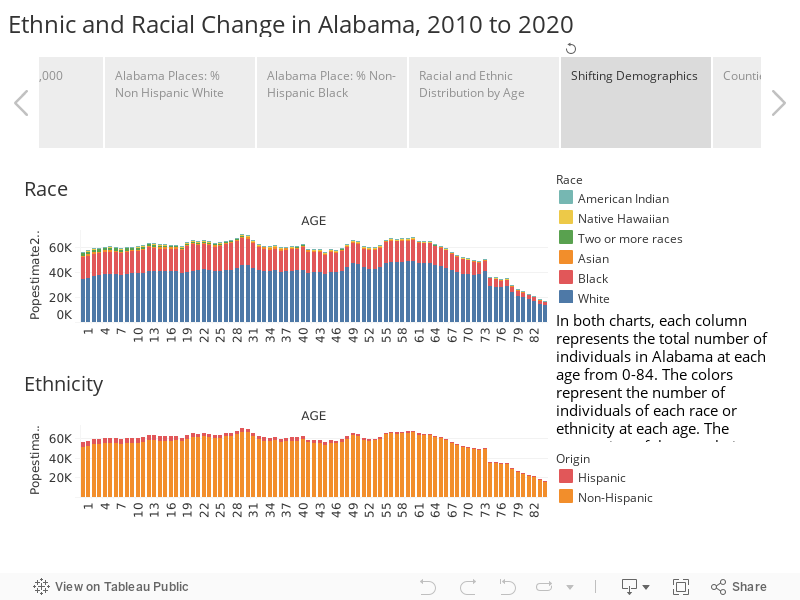
Alabama and the nation continue to diversify due to birth, death, and migration trends. But the statistics from the 2020 Census show that the nation is also changing through marriage and evolving attitudes toward racial identity as customs and generations change. The chart below looks at the Alabama population by age, with the population color-coded first for race and then for ethnicity. Both charts note the increasing racial and ethnic diversity in the younger population.
The shifting demographics challenge Alabama to continue progress toward common goals and increasing equality of opportunity for all.