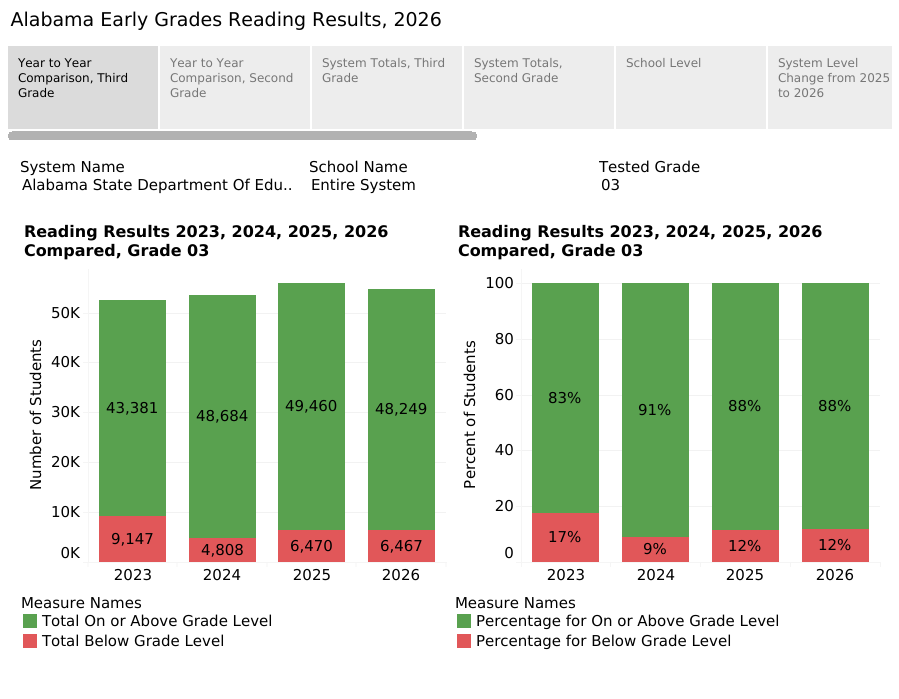
After multiple years of progress, Alabama third grade reading performance plateaued in 2026, with 11.8% of students scoring under the grade-level benchmark, roughly matching the 2025 mark of 11.6%.
However, the statewide numbers mask differences in gains across the state’s systems. The Alabama systems that saw the greatest gains by percentage were predominantly small, rural, and high in poverty rate; many are concentrated in the Black Belt. Large, urban systems like Birmingham City and Montgomery County made minimal system-wide progress. Multiple virtual schools continued to struggle: for the fourth year since 2023, Alabama Connections Academy of Limestone County and Alabama Virtual Academy at Eufaula City Schools had among the highest number and percentages of third graders reading below grade level.

Since the passage of the Alabama Literacy Act of 2019, which reached full implementation during the 2023-2024 school year, Alabama students have significantly improved their performance on the reading portion of the state’s standardized test, the Alabama Comprehensive Assessment Program (ACAP). In addition, the most recent data from the National Assessment of Education Progress (NAEP), collected in 2024, also shows Alabama students improving. In fact, Alabama and Louisiana are the only two states in which fourth-grade students are performing better in reading than before the COVID-19 pandemic.
On the ACAP, the average scale score of third graders improved significantly between 2023 and 2025. At the same time, the State has been raising the benchmark score defining grade-level reading. That higher standard led to a rise in the percentage of Alabama third graders failing to reach the grade-level reading benchmark in 2025.
But Alabama’s upward trend leveled off this year. Although the state didn’t lose ground, it didn’t gain ground, either. The benchmark has remained unchanged since last year, and with Alabama’s third-grade cohort shrinking, 6,467 students tested below grade level in 2026 — three fewer than 2025 — while 48,249 students cleared the bar, a decrease of 1,211 students.
Background: Why the attention on third grade reading?
From the beginning of their schooling until the end of third grade, most students are learning to read. In fourth grade and beyond, most students are expected to use their skills to interpret information and read material to learn. Relatedly, numerous studies have identified third-grade reading performance as a predictor of long-term academic and professional success. Students who aren’t reading on grade level by the end of third grade are less likely to graduate high school than their peers. Literacy struggles are also correlated with low levels of educational attainment, difficulties in the job market, and poor health outcomes.
Against this backdrop, the Alabama Literacy Act of 2019 was passed. Since the implementation of the Literacy Act — modeled after similar legislation in Mississippi and Florida, both of which saw large performance gains on national standardized reading tests — Alabama has made significant investments in early-grade literacy, training teachers in instruction grounded in the science of reading, deploying dedicated reading coaches to every school with grades K-3, and developing intervention plans to support struggling readers as early as kindergarten. Students who fail to clear the grade-level reading benchmark on the ACAP are at risk of having to repeat the third grade. Those students are offered retesting after intensive summer instruction, along with alternative ways to qualify for promotion.
The introduction of these measures has coincided with a statewide increase in reading performance. In 2023, the year before the Literacy Act’s grade-level retention provision went into effect, 82.6% of Alabama third graders read at a sufficient level; in 2026, over 88% did so. Additional reading performance progress will likely require a redoubling of the state’s efforts, however.
Presenting the 2026 results to the Alabama State School Board, State Superintendent Eric Mackey offered a potential explanation for students’ apparent plateau, suggesting that many of those who remain below the bar may be struggling with dyslexia or may require more intensive intervention. Furthermore, the benchmark score that defines grade-level reading is set to be increased in 2027, meaning student scores will need to rise to maintain the current pass rate, let alone raise it.
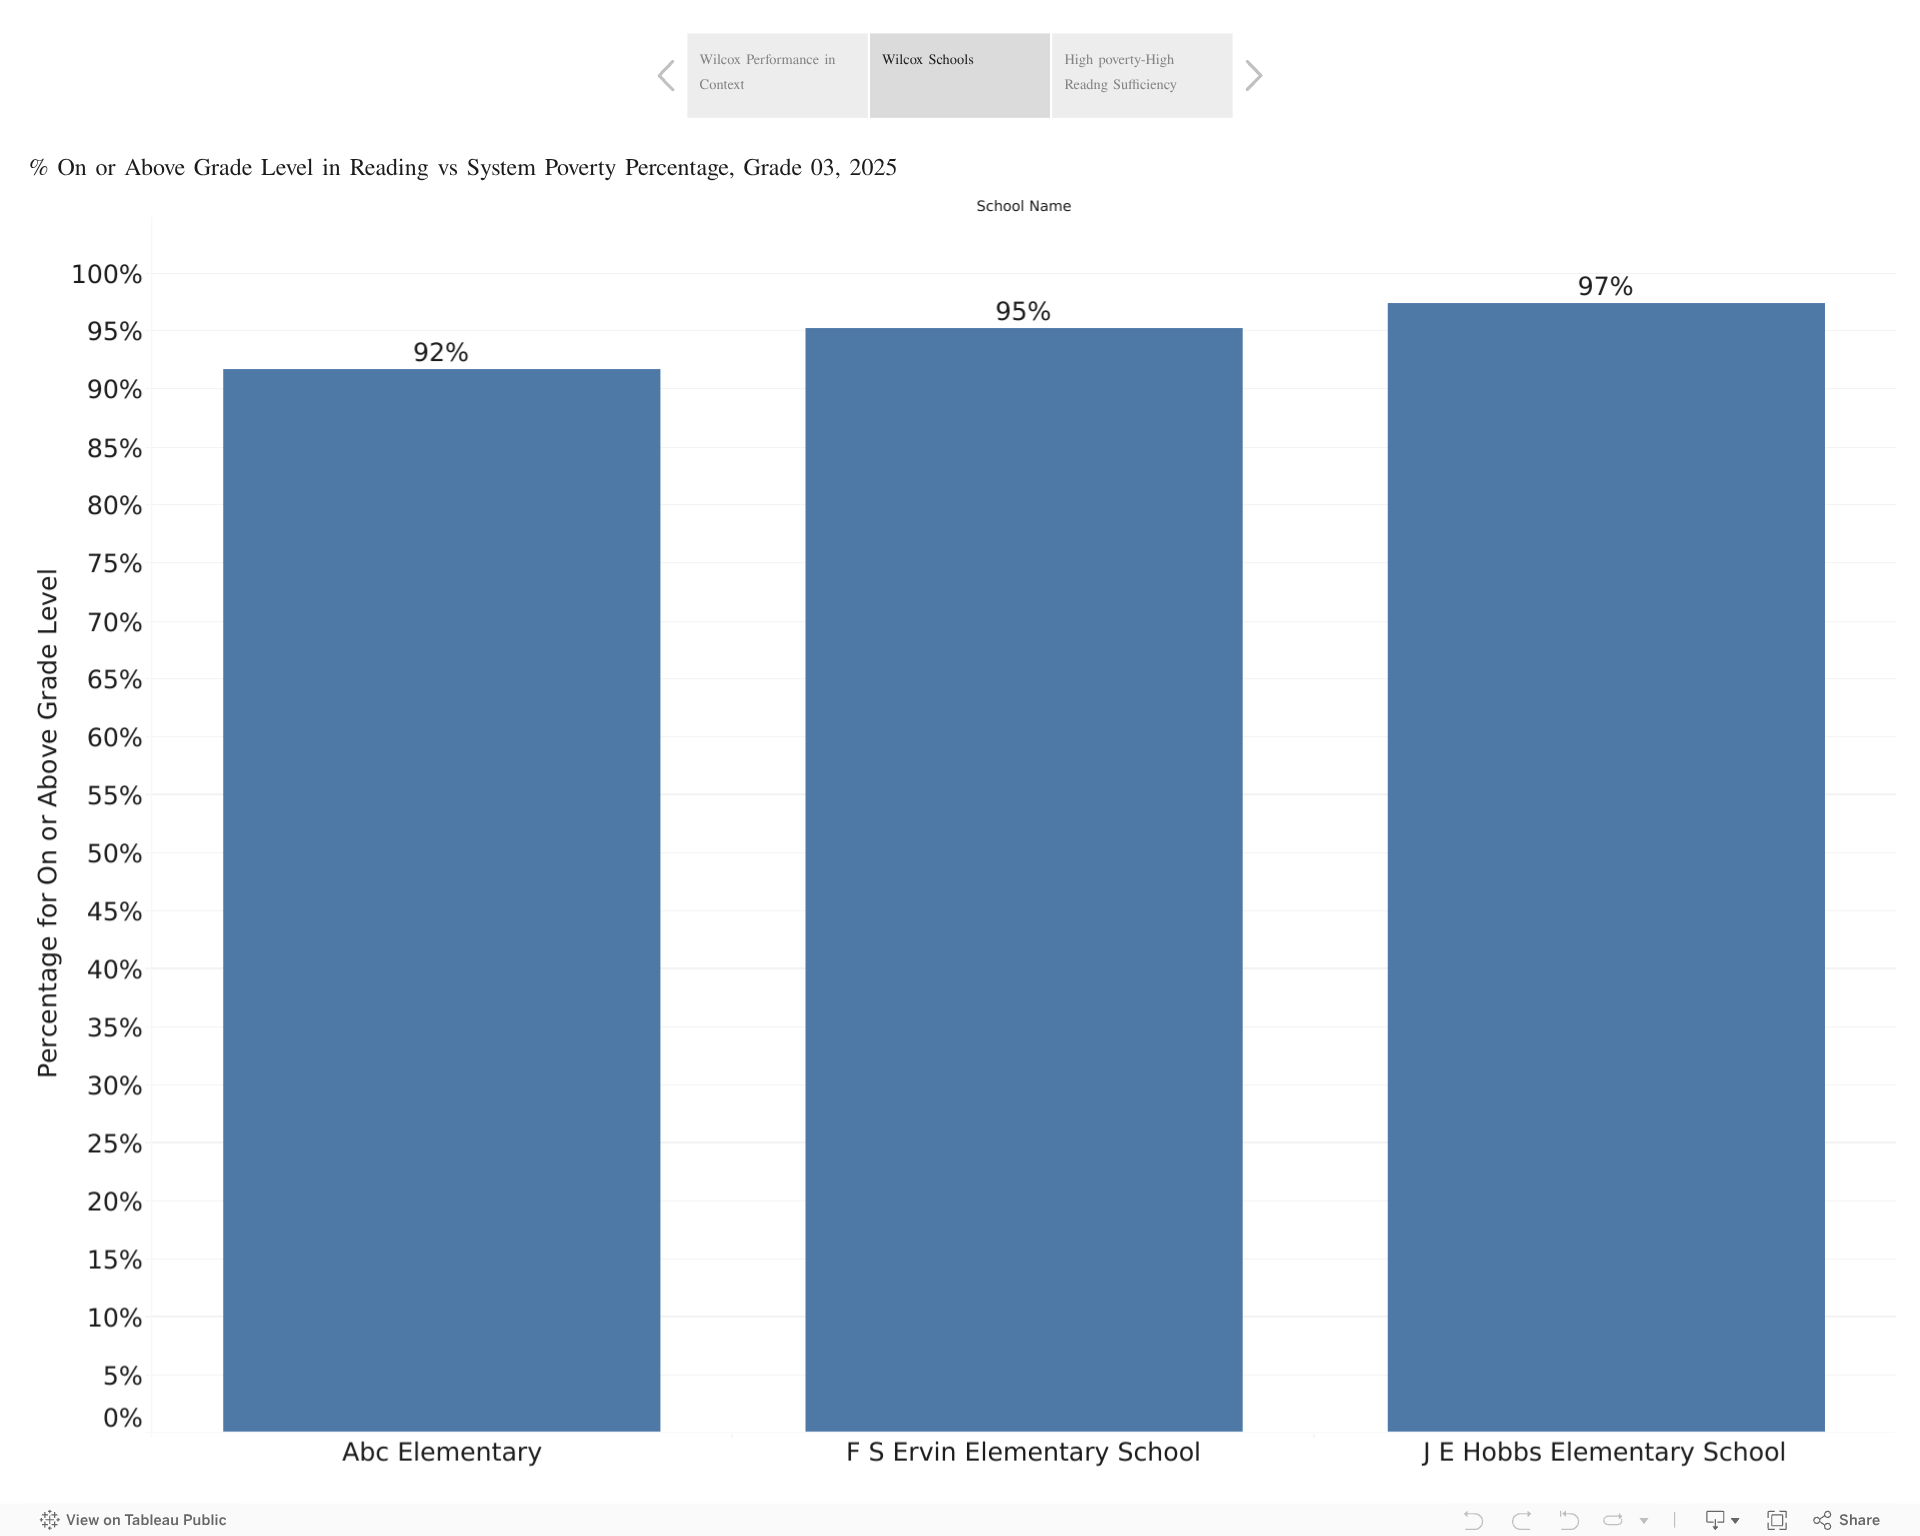
Poverty vs. Performance: School Level
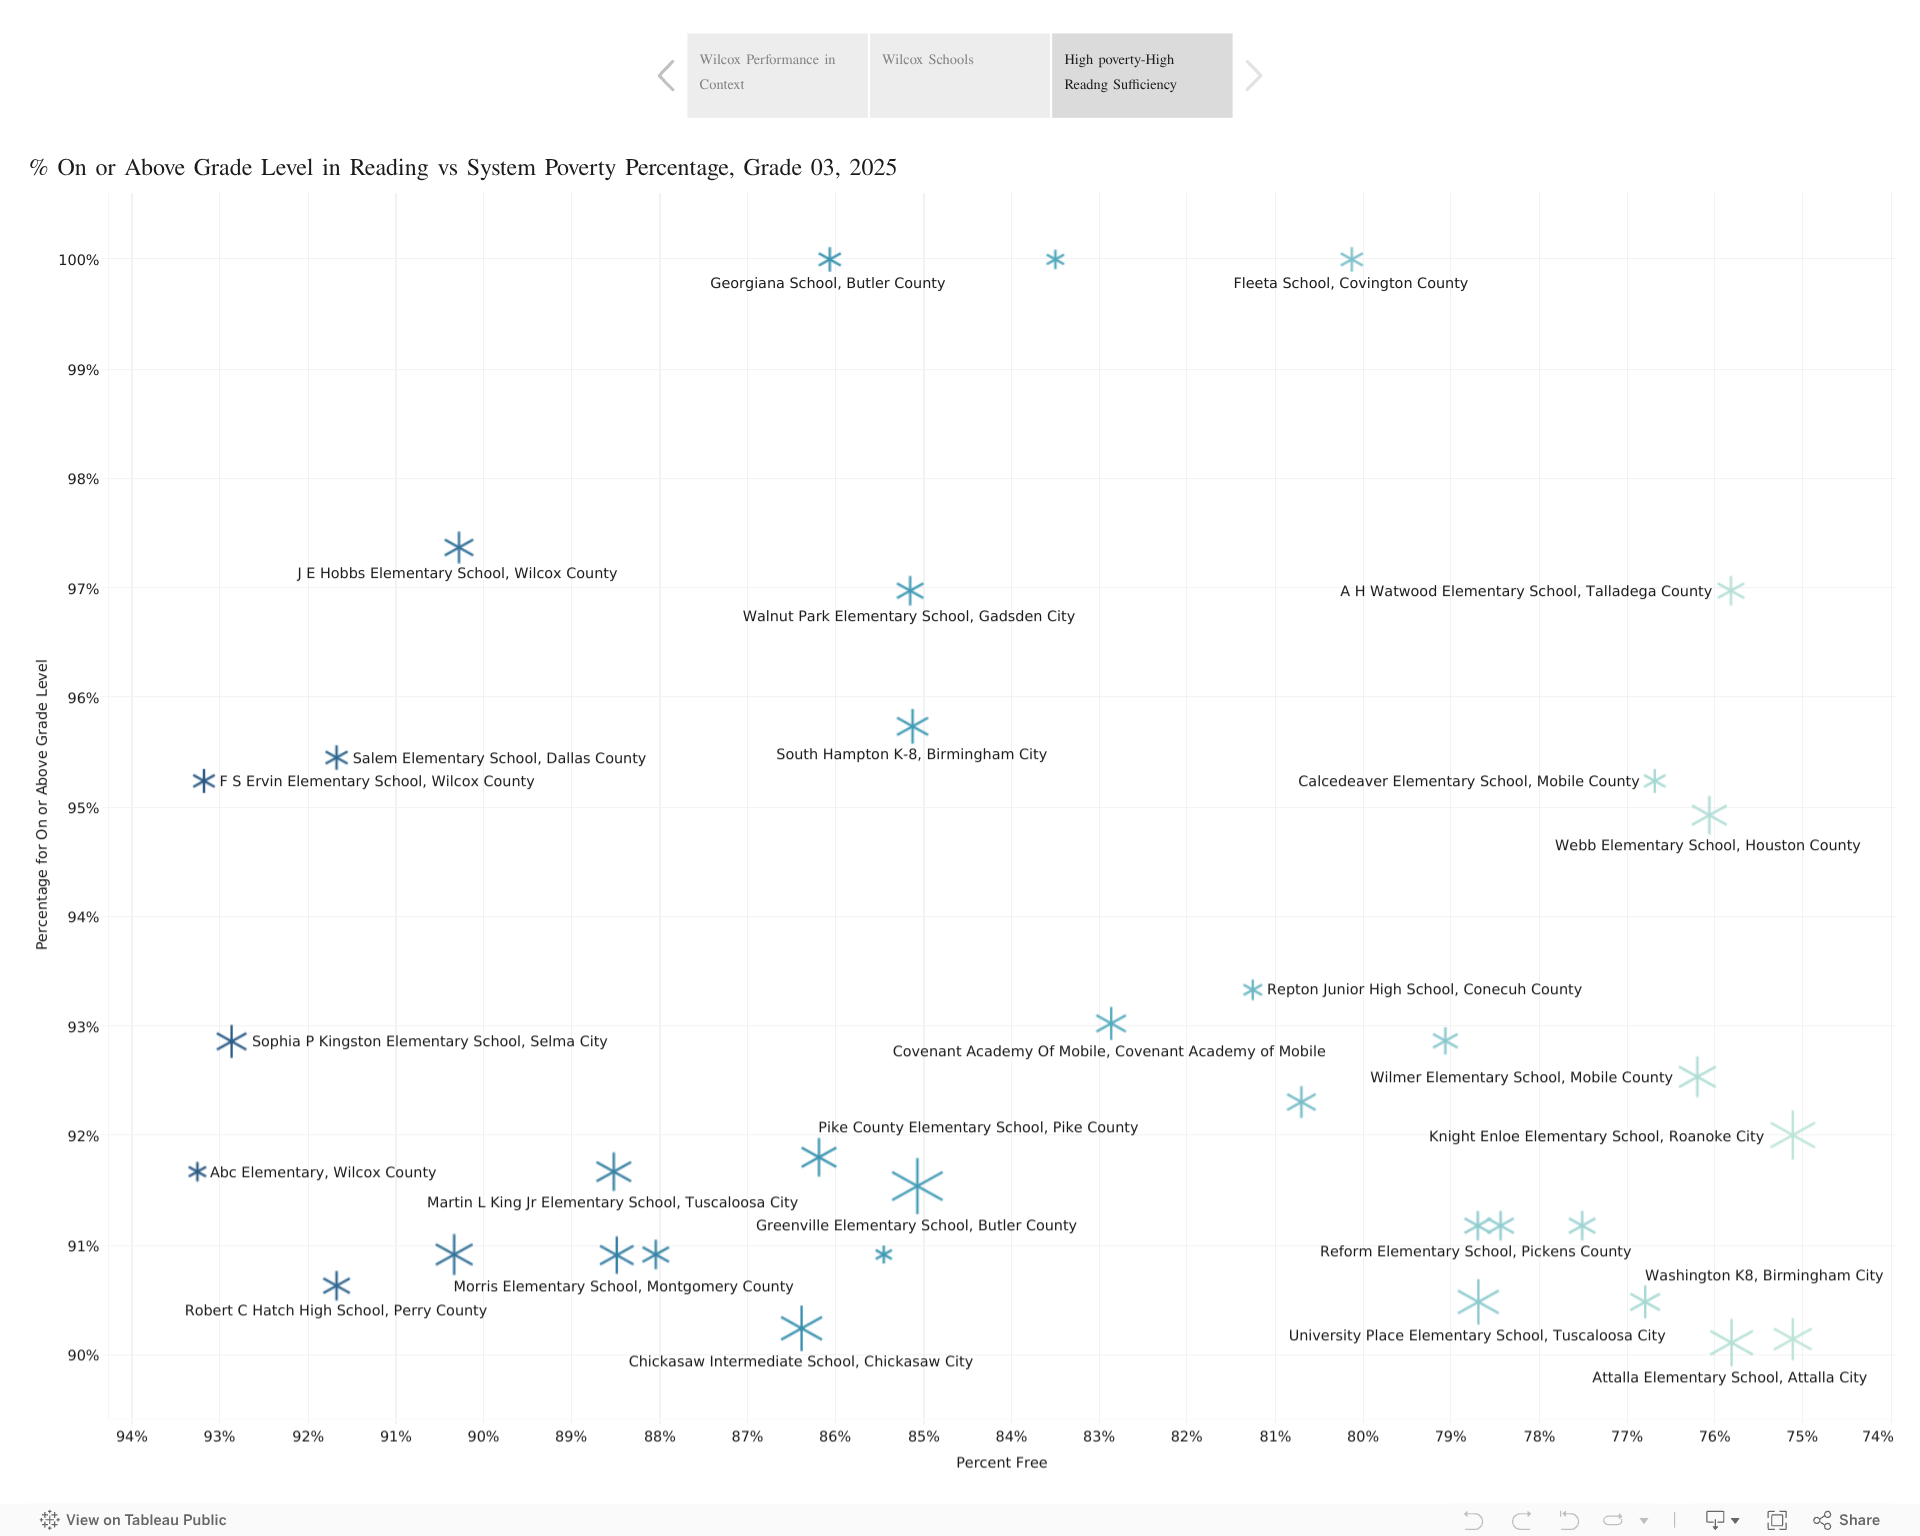
There remains a correlation between economic disadvantage and reading struggles: students in high-poverty systems are more likely to test below grade-level benchmarks than those from low-poverty systems.
However, as demonstrated by the school-level results chart below, poverty is not the sole determinant of reading performance. 98% of students at Wilcox County’s ABC Elementary School are from economically disadvantaged households; after 92% of its third graders tested on grade level in 2025, ABC Elementary saw 100% of its third graders do so in 2026. Thirty other schools accomplished the same feat, including — for the second consecutive year — Butler County’s Georgiana School, where 86% of students hail from economically disadvantaged households, but all ended the year reading on grade level.

Two of the schools with the highest number of third graders testing under grade level were virtual: at Alabama Virtual Academy at Eufaula City Schools, 139 of 372 (37.4%) tested students scored under the benchmark, while at Alabama Connections Academy of Limestone County, 101 of 322 (31.4%) tested students scored under the benchmark.
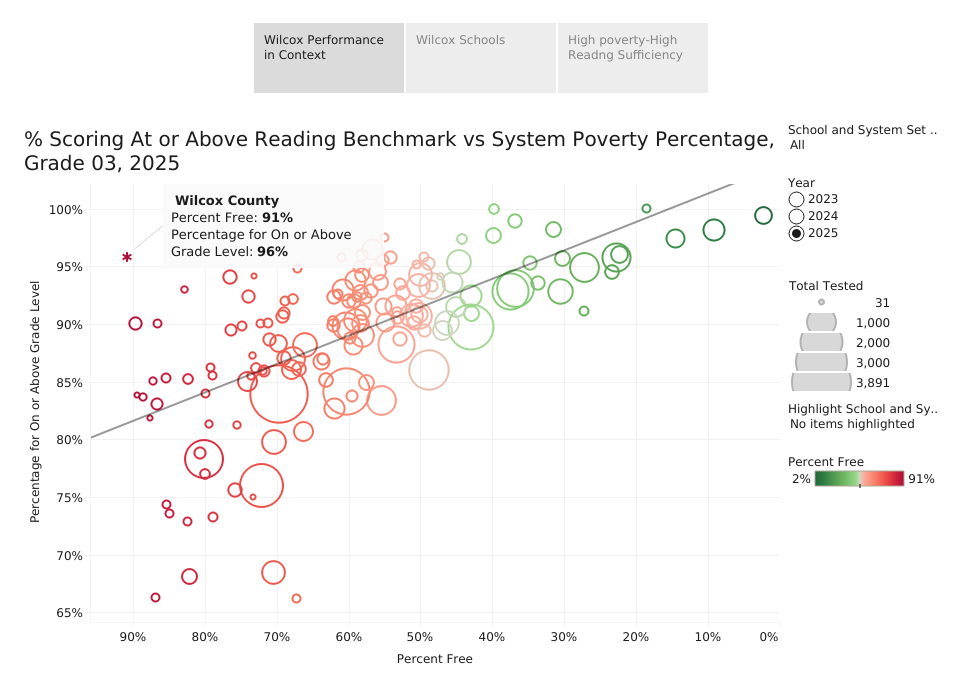
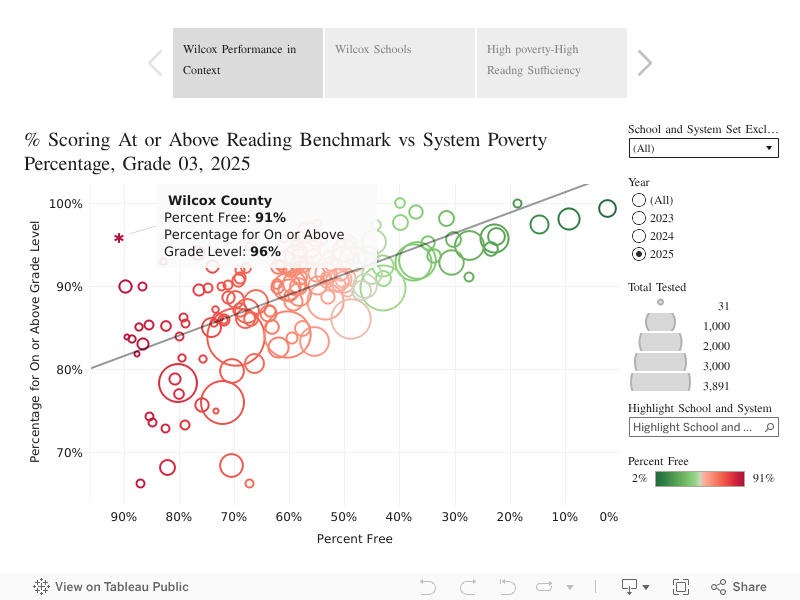
Poverty vs. Performance: System Level
While poverty is more predictive of reading struggles at the system level than at the school level, that relationship has begun to weaken as more small, high-poverty systems — particularly rural systems in the Black Belt — have seen performance gains in recent years, often ranking among the state’s most improved systems.
The 2026 data reflected a similar pattern. Fairfield City Schools posted the largest performance increase of any Alabama system, despite 87% of its students coming from economically disadvantaged households. Glen Oaks Intermediate School, Fairfield’s lone 3-5 elementary school, saw 53 of 61 tested third graders clear the grade-level benchmark in 2026, an 86.9% pass rate that marked a 13% jump from 2025.

Although the Black Belt had fewer representatives among Alabama’s greatest improvers than it did in years past, several of the region’s systems again demonstrated growth. The percentage of third graders reading at grade level increased by more than five points at Marengo County Schools and Pickens County Schools. Despite 71% of its students coming from economically disadvantaged households, the Marengo County system ranked ninth in Alabama for performance, with just 2 of 74 (2.7%) tested students scoring below grade level.
Systems with high levels of economic disadvantage and large student populations, such as the Montgomery County and Birmingham City systems, have among the highest numbers of third graders scoring below grade level. In 2026, neither system made significant gains from 2025. Mobile County Schools — Alabama’s largest system — led the state in the number of third graders below the benchmark, with 594 of its 3,832 tested students failing to read on grade level. However, that represents 16% of students below grade level, compared with 22% in Birmingham and 24% in Montgomery County.
Even among schools with similar demographics, however, significant intra-system performance variance existed. Montgomery, Birmingham, and Mobile each saw one or more magnet school place 100% of its students above the reading benchmark.

Second Grade Results
Second-grade testing results were also released. To better identify struggling readers in need of increased support during their third-grade year, the second-grade reading benchmark is intentionally set at a higher level. As such, a higher percentage of second graders statewide, 19.8%, failed to meet the grade-level reading benchmark than third graders. That’s a higher percentage than 2025, when 18.8% of second graders failed to meet the benchmark. Students who fell below the bar are encouraged to attend summer literacy camps.

Future Challenges
Along with the benchmark increase scheduled for 2027 and the dyslexia struggles faced by many students who remain below the bar, staff turnover and personnel shortages also pose obstacles to Alabama’s reading performance progress.
According to Alabama Daily News reporting, Alabama saw 3,570 public school teachers retire in 2025, up from 3,094 in 2024 and 2,810 in 2023. The spike traces back to a 2022 statewide pay raise for experienced teachers: Since monthly retirement benefits are calculated from a teacher’s highest three to five years of salary, depending on when they were originally hired, the raise gave longtime teachers an incentive to delay retirement. Many of those who delayed are now retiring.
Public school enrollment has also declined. Since funding for teaching positions is tied to enrollment and attendance, further workforce attrition is possible.
Last fall, State Superintendent Mackey suggested that “between 500 to 700 teacher jobs” could disappear before the 2026-2027 school year. Losses concentrated in specific areas and districts could leave schools understaffed and could exacerbate Alabama’s preexisting teacher shortage, which is most visible in elementary schools and high-poverty schools. According to data released by the state, Alabama has seen a steady increase in the number of teachers with emergency certificates in recent years, rising from 442 in 2018 to 3,288 in 2025. Hired when a fully-certified teacher is unavailable, emergency-certified teachers are individuals who have not yet completed certification.
Most teachers with emergency certifications do not participate in LETRS, the professional development program Alabama adopted as part of the Literacy Act. LETRS trains instructors in the science of reading and prepares them to identify and effectively instruct students with conditions that may hinder their reading progress.
For schools with high rates of staff turnover or high numbers of emergency-certified teachers, achieving a critical mass of LETRS-trained teachers is a challenge. The challenge is compounded by the spike in retirements, which includes LETRS-trained educators.
In the face of these headwinds, state education officials hope to sustain and expand access to science of reading-based training for teachers already in schools. They are also hopeful that new teachers graduating from the state’s university-based teacher preparation programs will enter the profession with a firm grounding in the science of reading. The department has been working with the universities to improve the alignment between what’s taught in university courses of study and what is expected of teachers in the K-12 public school classrooms.