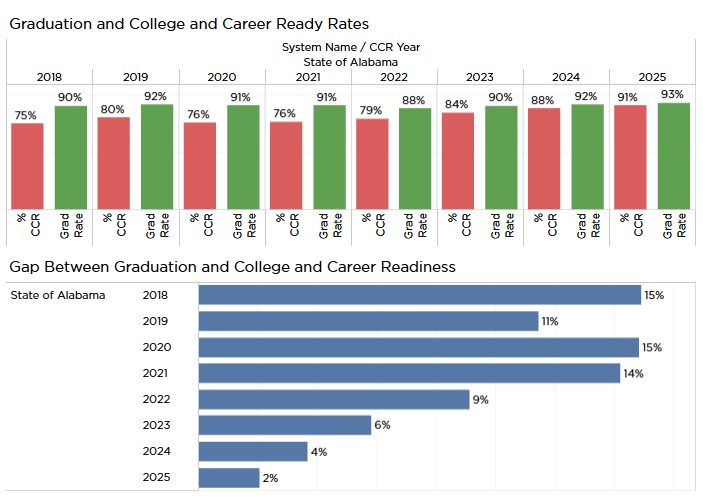

Seniors in the graduating class of 2025 set records on two measures: 93% of seniors graduated on time four years after entering in 9th grade and 91% of those seniors earned a marker of college and career readiness (CCR), an indicator they were ready for life beyond high school. That 2% gap between graduation and college and career readiness is also the narrowest on record.
For seniors graduating this year, the Class of 2026, there will by definition be no gap at all: all students who graduate will be required to have earned a CCR indicator.
The 2025 results shed light on the trends driving sharp gains in college and career readiness, particularly in students taking career technical education or earning college credit through dual enrollment. These increasing rates are the culmination of goals set over a decade ago, when the State Board of Education adopted Plan 2020, with a goal of increasing the graduation rate to 90% by 2020. Prior to 2012, when Plan 2020 was adopted, Alabama’s graduation rates were below 75%.
The graduation goal was reached early, by 2018. However, the rapid rise led to concerns that some students receiving diplomas weren’t prepared to enter the workforce or higher education. Consequently, the State Department and the State Board have increasingly focused on improving college and career readiness among graduates. In 2023, the Legislature passed and the governor signed a law requiring college- and career-readiness for graduation.

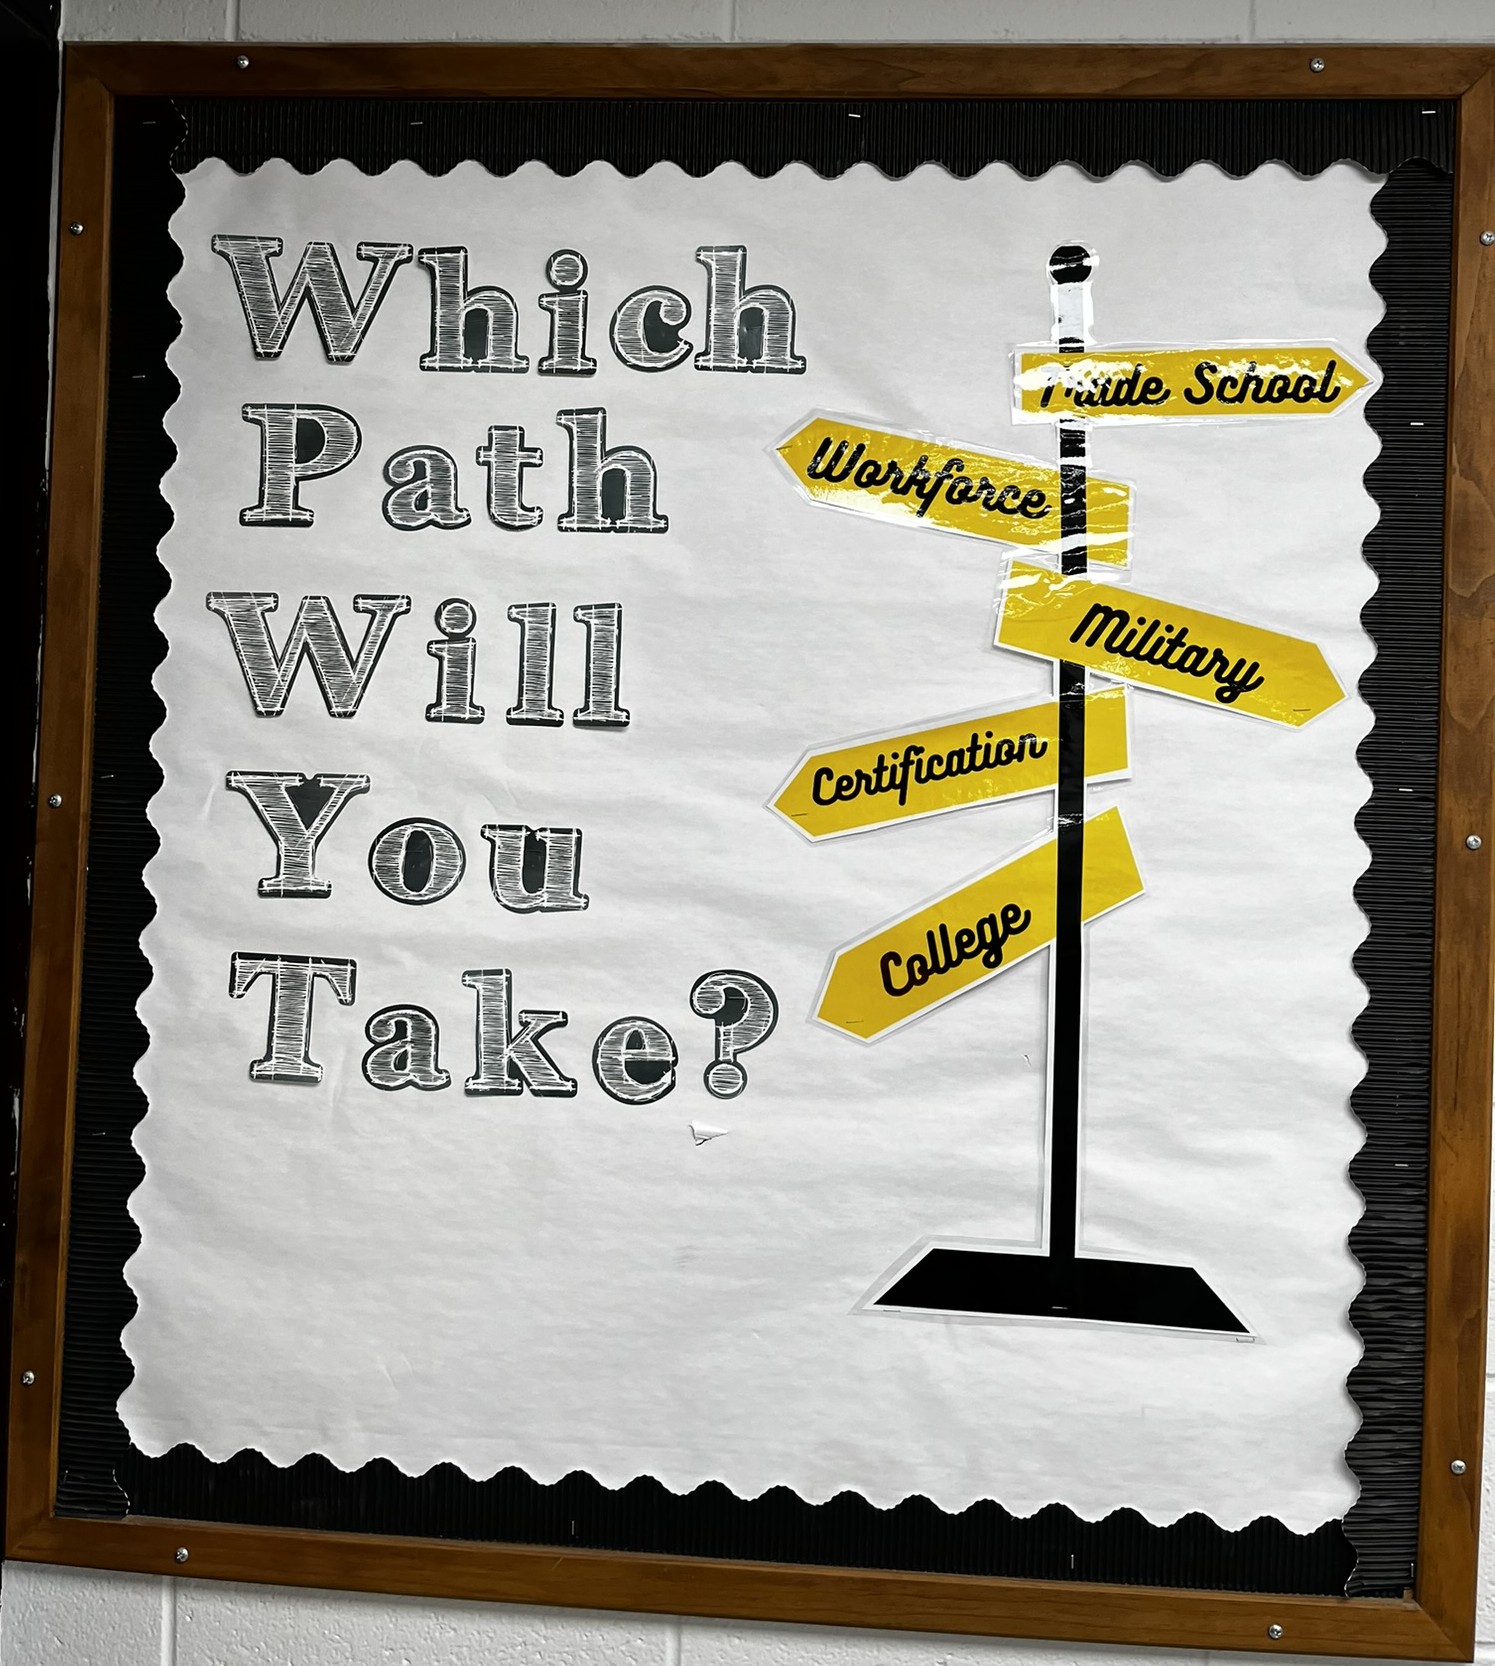
There are multiple ways a student can demonstrate college and career readiness.
- Earn a benchmark score in any subject area on the ACT, the college entrance exam that gauges readiness for college-level work.
- Earn a silver or above on the ACT’s Workkeys, a standardized test that measures reading and math skills as applied in the workplace.
- Earn a qualifying score on an Advanced Placement (AP) or International Baccalaureate (IB) exam AP and IB are college-level courses delivered by teachers in high schools that culminate in a nationally standardized test on the subject.
- Earn college credit while in high school. High school students who take and earn credit in courses taught at community colleges or universities
- Complete an in-school youth apprenticeship program.
- Earn a career tech credential. These credentials are expected to flow out of career-oriented courses-of-study. The credentials must be recognized by employers and reviewed and approved by a state council.
- Complete a Career and Technical Education (CTE) course of study. A student must earn three full credits in an approved progression of courses.
- Be accepted into the military before graduation.
ACT and WorkKeys
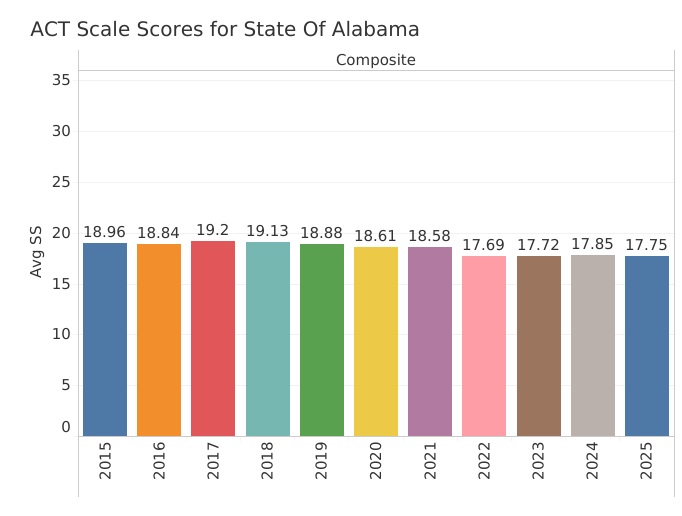
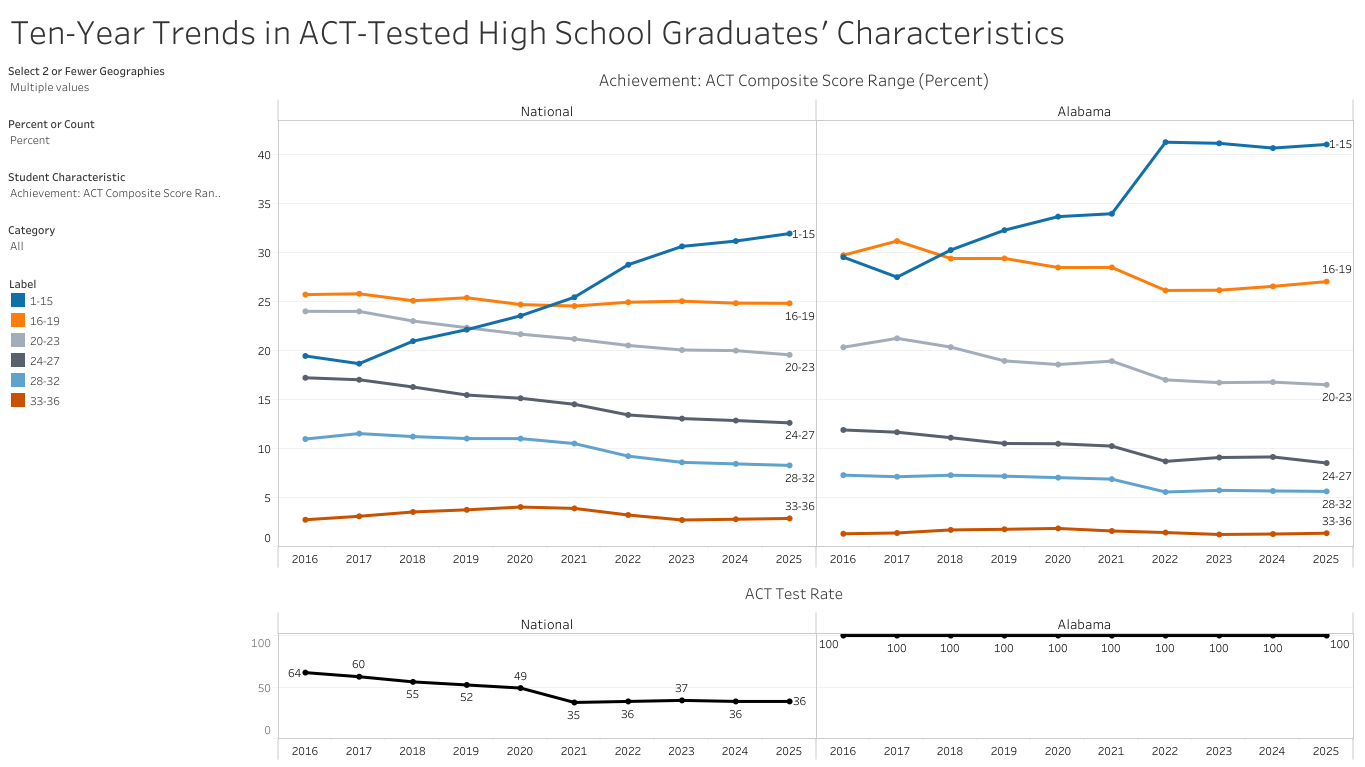
The percentage of students earning a qualifying score on the ACT or earning Silver or above on WorkKeys is has gone down. Nationally, ACT performance has slipped with a particular decline in the immediate aftermath of the pandemic, after many schools stopped requiring students to take the test. In Alabama, there has been some recovery, but the percentage of students achieving a benchmark score in at least one subject is still around 40%. In 2018, the percentage was above 50%.
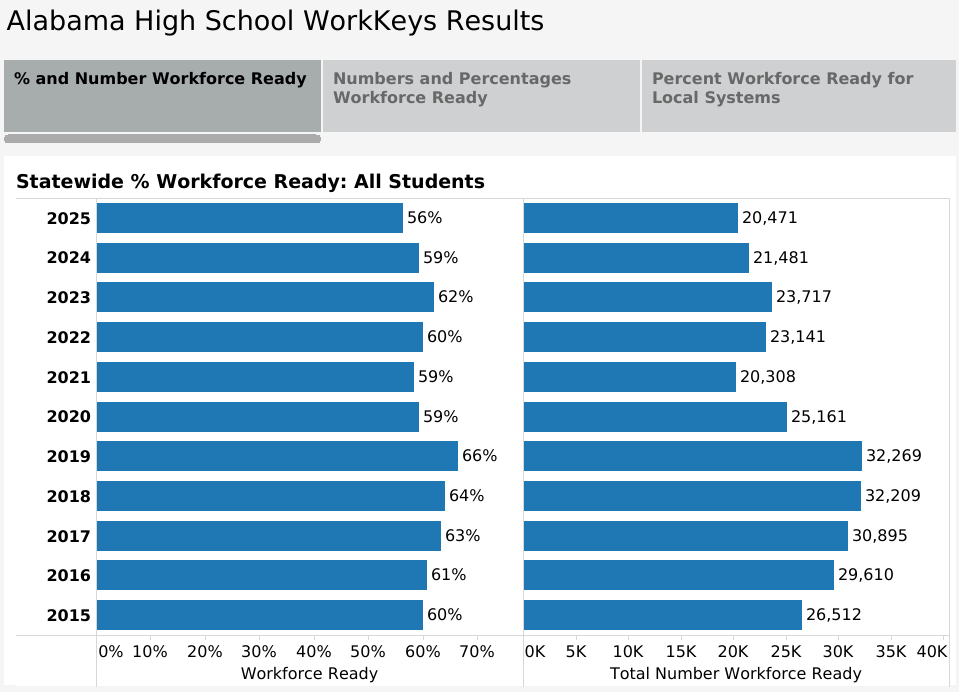
The percentage of students passing the Workkeys test is down too, but that is likely due to the fact that it is now an optional test. Systems have the option of offering it to all students or to target the students who need an alternative option. In that scenario, students who benchmark on the ACT in their junior year aren’t likely to take WorkKeys in their senior year. The number of students taking the test is down significantly.
On the other hand, the percentage of students earning AP credit is up to 15%, a slow but steady increase in students taking and succeeding in the rigorous college-like courses. IB participation is down. Offering these courses requires faculty with advanced training and a critical mass of students who want AP coursework.
Dual Enrollment and Career Technical Education
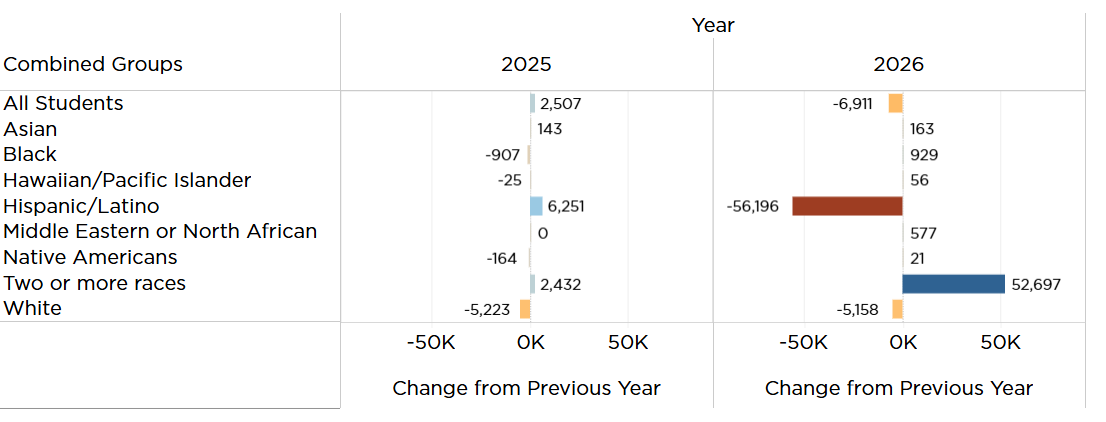
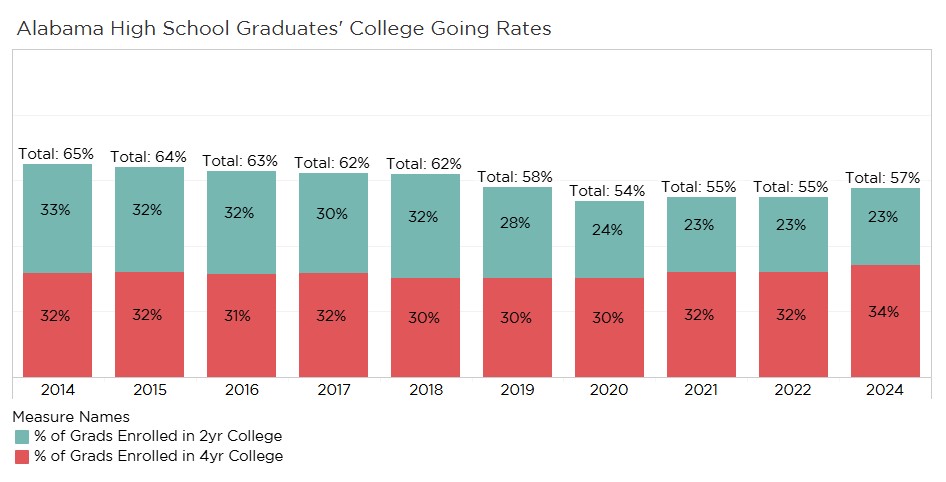
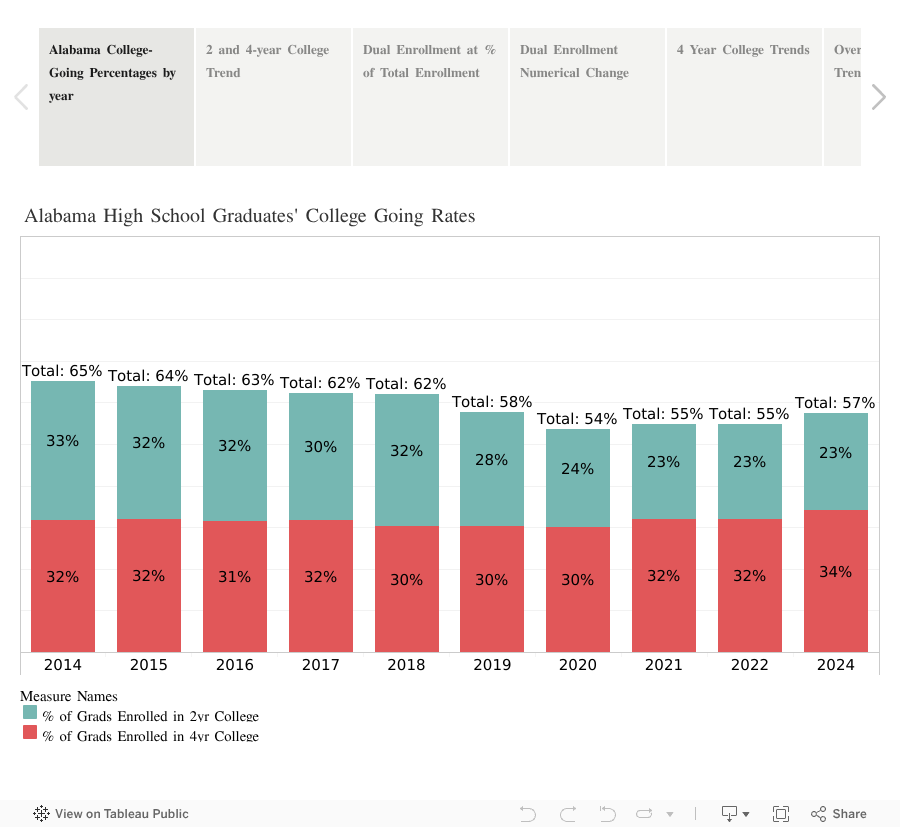
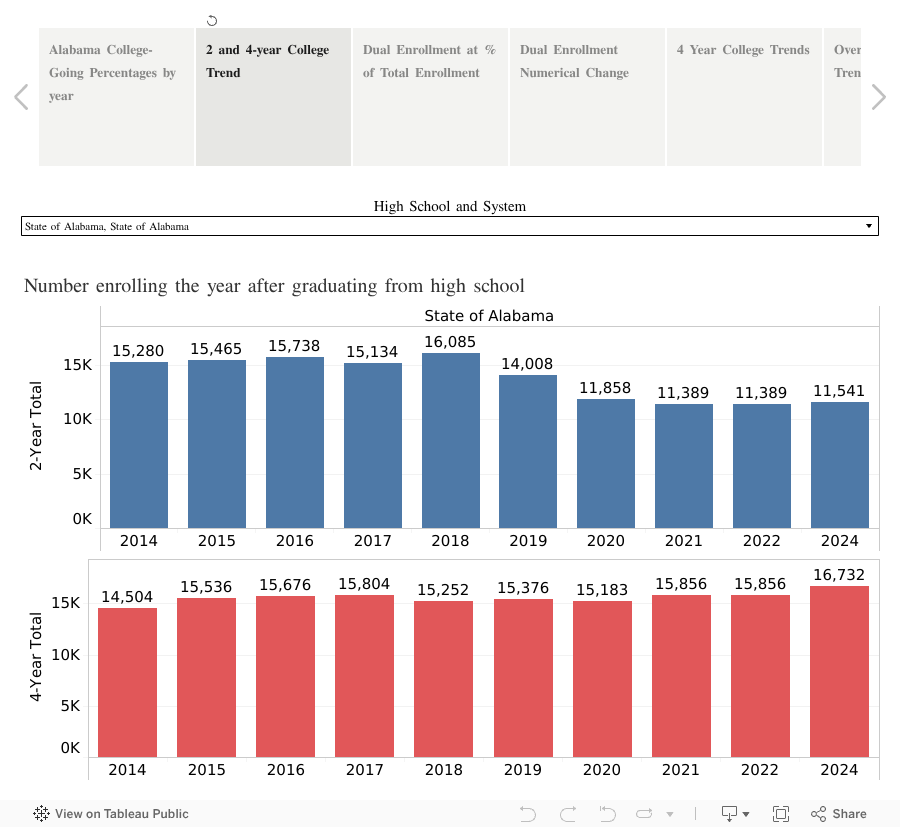
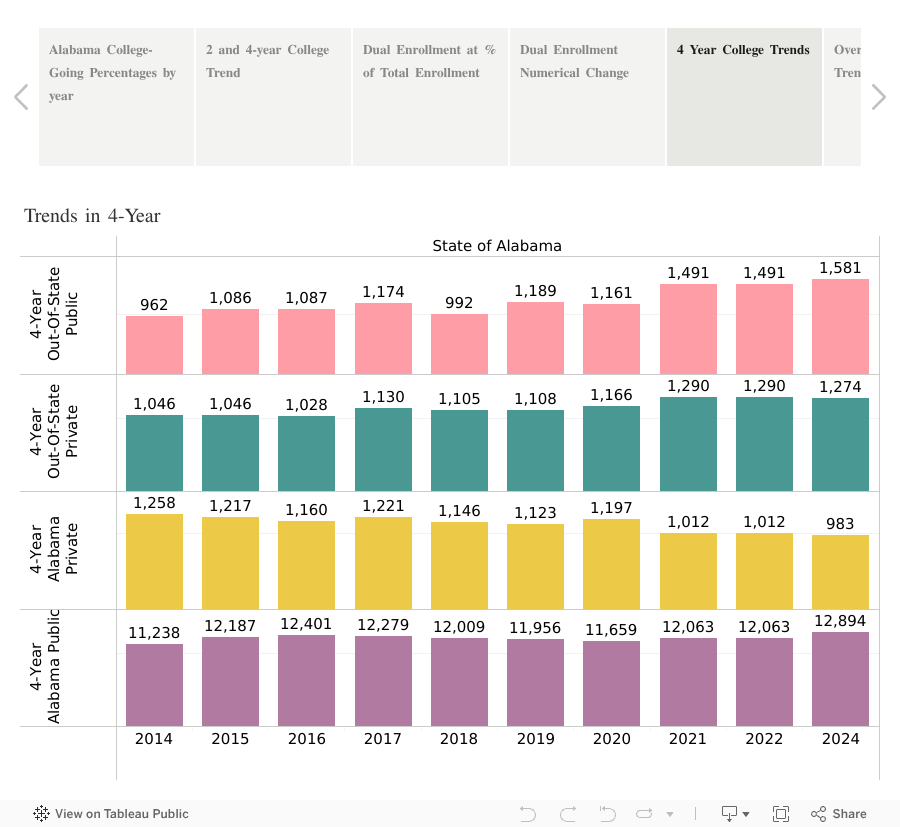
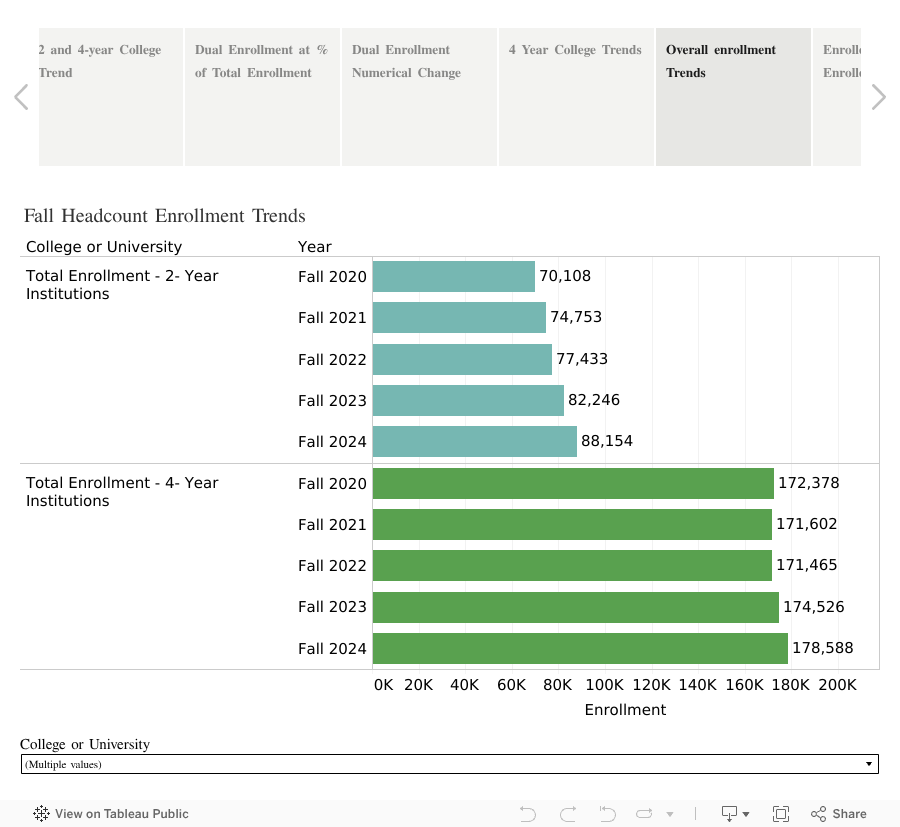
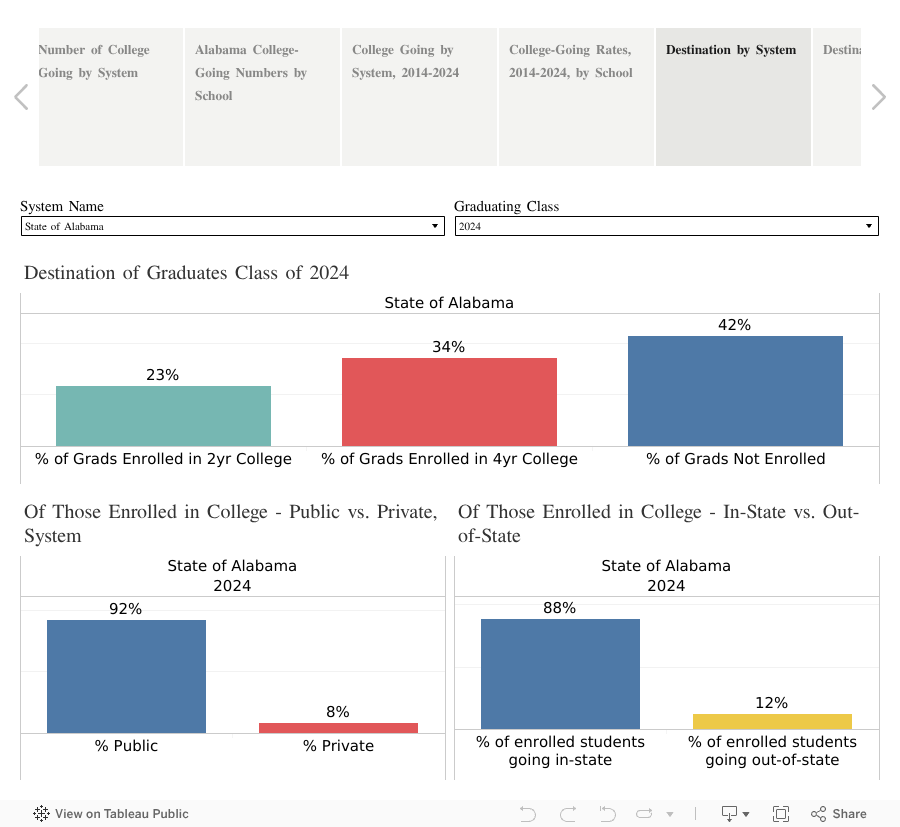
An alternative way to provide college-level courses to high school students is through dual enrollment. Alabama’s higher education institutions, particularly two-year colleges, have welcomed high school students as a source of enrollment growth. PARCA explored the growth of dual enrollment in a recent analysis of college-going trends. In an odd twist, the number of high school graduates enrolling after graduation in two-year colleges has declined, but the number of high school students enrolling in courses at two-year colleges has soared. With all those additional dual enrollment students, two-year college headcount enrollment is higher

At two-year colleges, high school students can take either academic courses for college credit or career-technical education (CTE) courses in pursuit of industry-recognized credentials. They can also complete a CTE course of study that puts them on a path to skilled technical employment in health care, manufacturing, or the other fields or trades.
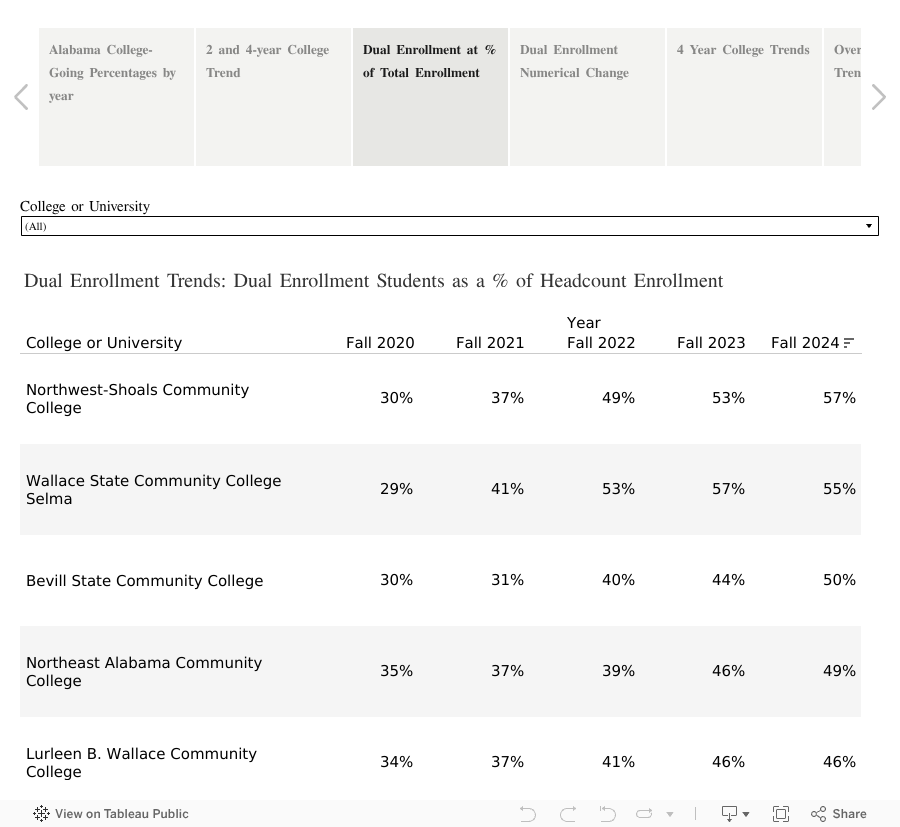
Thanks to dual enrollment partnerships with nearby school systems, some community colleges now are drawing more than half of their headcount enrollment from high schools.

Meanwhile, high schools have also been increasing their career-technical education offerings. The Legislature has provided additional money for school systems to expand their offerings. The recently released data doesn’t specify whether a high school or a college is providing the which CCR indicator. However, this is the source of growth. If one totals the college credit, CCR, and CTE completer categories in 2018, about 23,000 students earned a college and career-ready destination through college credit or career technical education. In 2025, nearly 60,000 did.
Both those totals contain double counts from students who may have earned credentials in both categories, but, regardless, the statistics capture the growth in those approaches to college and career readiness.
The statistics do provide insight into how different demographic groups are achieving college and career readiness through different routes.

Asian students are far more likely than other groups to benchmark on the ACT, but less likely to be involved in career tech education. Meanwhile, 56% of Black students earn Career Technical Education (CTE) credentials. That is a higher percentage than other demographic groups. Meanwhile, only about a quarter of Hispanic, Black, and economically disadvantaged students benchmark on the ACT compared to just over half of whites.
Local Schools and Systems
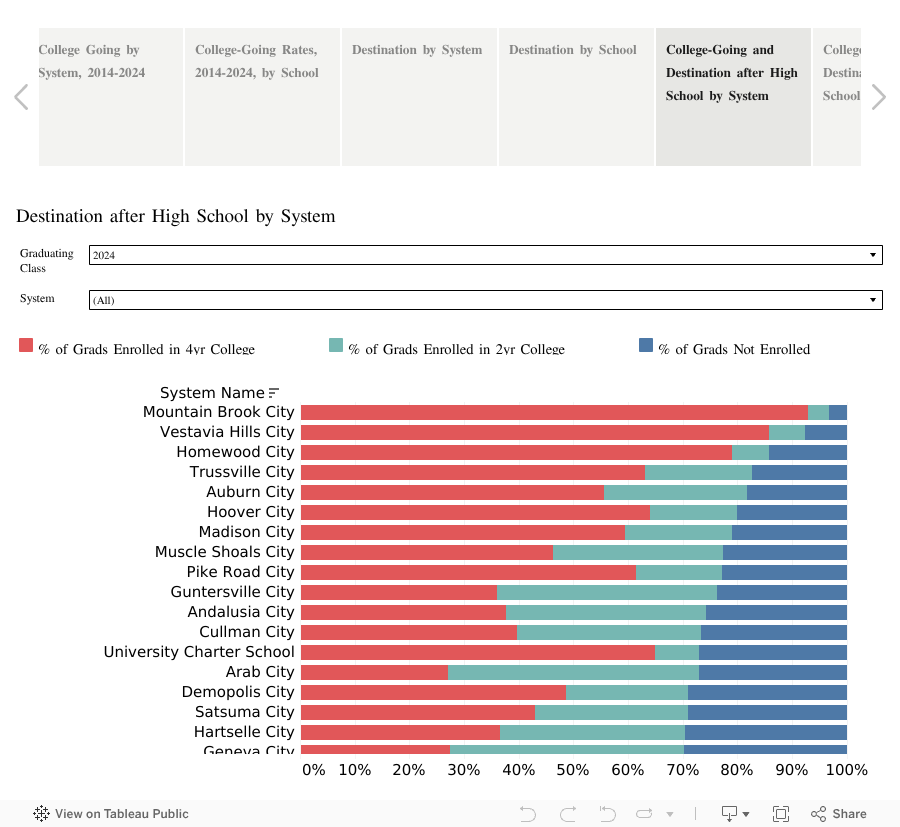
You can explore and compare local results using the menus and tabs in the various visualizations.
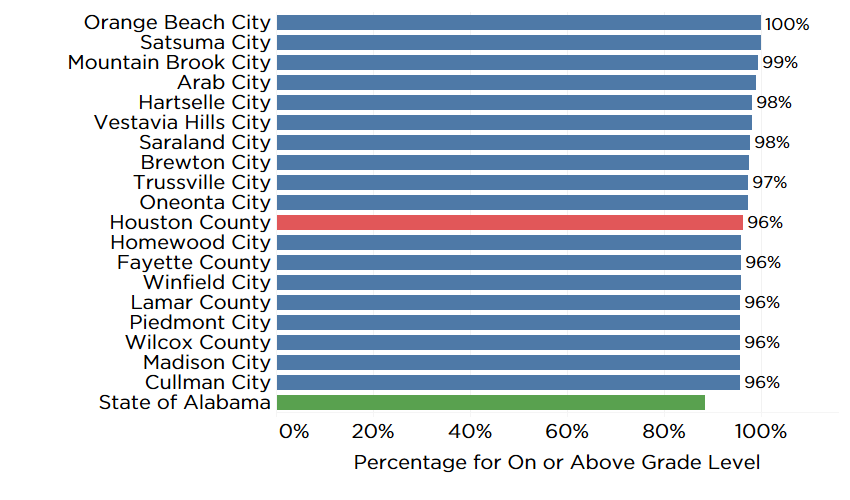
Four systems had 100% of seniors graduate, and all of them earned a CCR designation: University Charter School in Livingston, plus Piedmont, Orange Beach, and Haleyville City systems.

At the school level, 44 schools across the state had a 100% graduation rate, while 63 schools had all students ending the year with a college- and career-ready designation. The two sets don’t exactly match up. At some schools, the college and career readiness rate exceeds the graduation rate.

Different schools have found different routes to success in College and Career Readiness. This sortable list of metrics allows the identification of high performing schools that follow different paths.
As is often the case, magnet schools fare well in some categories. Academically ambitouys students apply to the schools and the schools tend to offer advanced coursework. For example, all students at Loveless Academic Magnet Program (LAMP) in Mongtomery County benchmarked on the ACT and scored silver or above on the WorkKeys test. But even more impressive is the fact that 96% of LAMP students earned a qualifying score on an Advanced Placement exam.
Meanwhile, in the Opp City School System 99% of students earned an industry-recognized credential through Career Technical Education. Opp, which also seen strong gains on ACT scores and students earning college credit was featured in a recent installment of PARCA’s Keys to Success series.