Decreasing immigration from abroad slowed population growth across Alabama’s counties in 2024 and 2025, though suburban counties and growth magnets in north and south Alabama continued to add new residents. The one-year metro population growth rate for Huntsville (3%) and Baldwin County (2%) put both among the fastest growing Metropolitan Statistical Areas (MSAs) in the US, with Huntsville at No. 6 and Baldwin County at No. 11.
Nationwide, the rate of population growth slowed sharply.
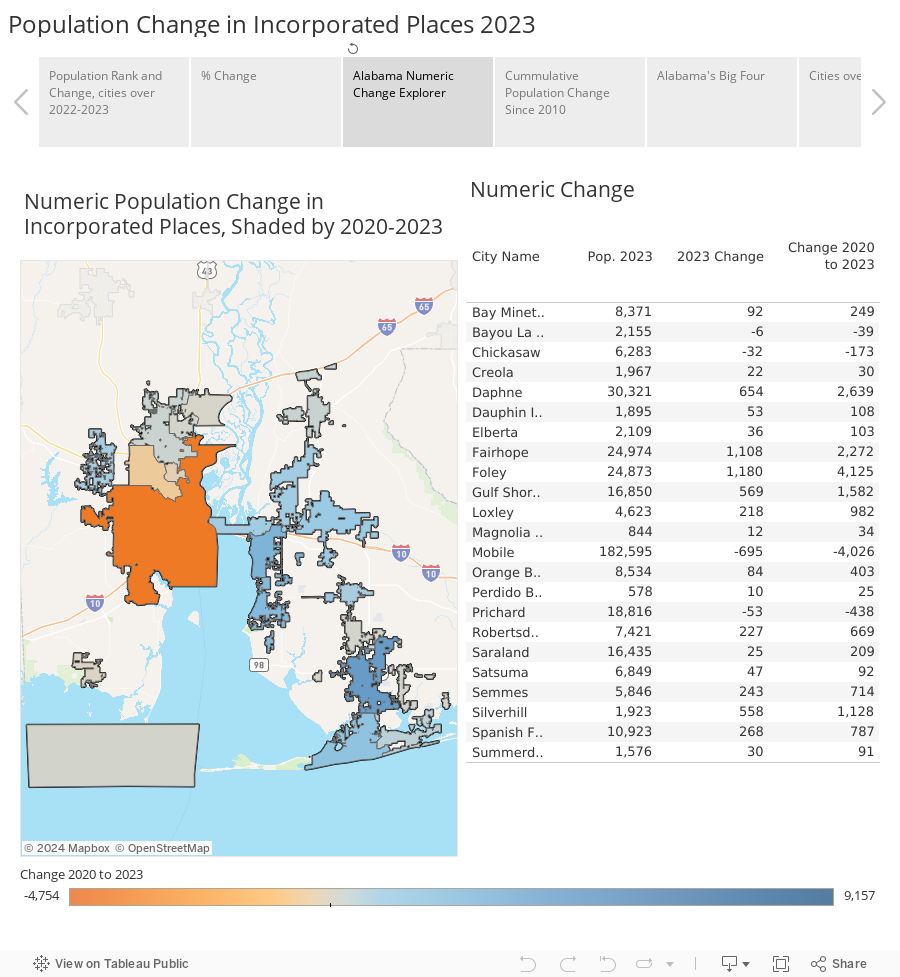
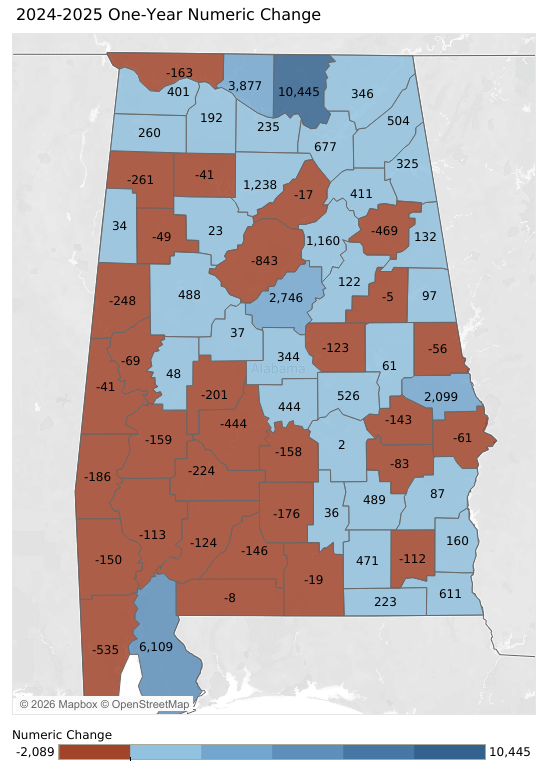
Figure 1. Numeric Change by County, 2025

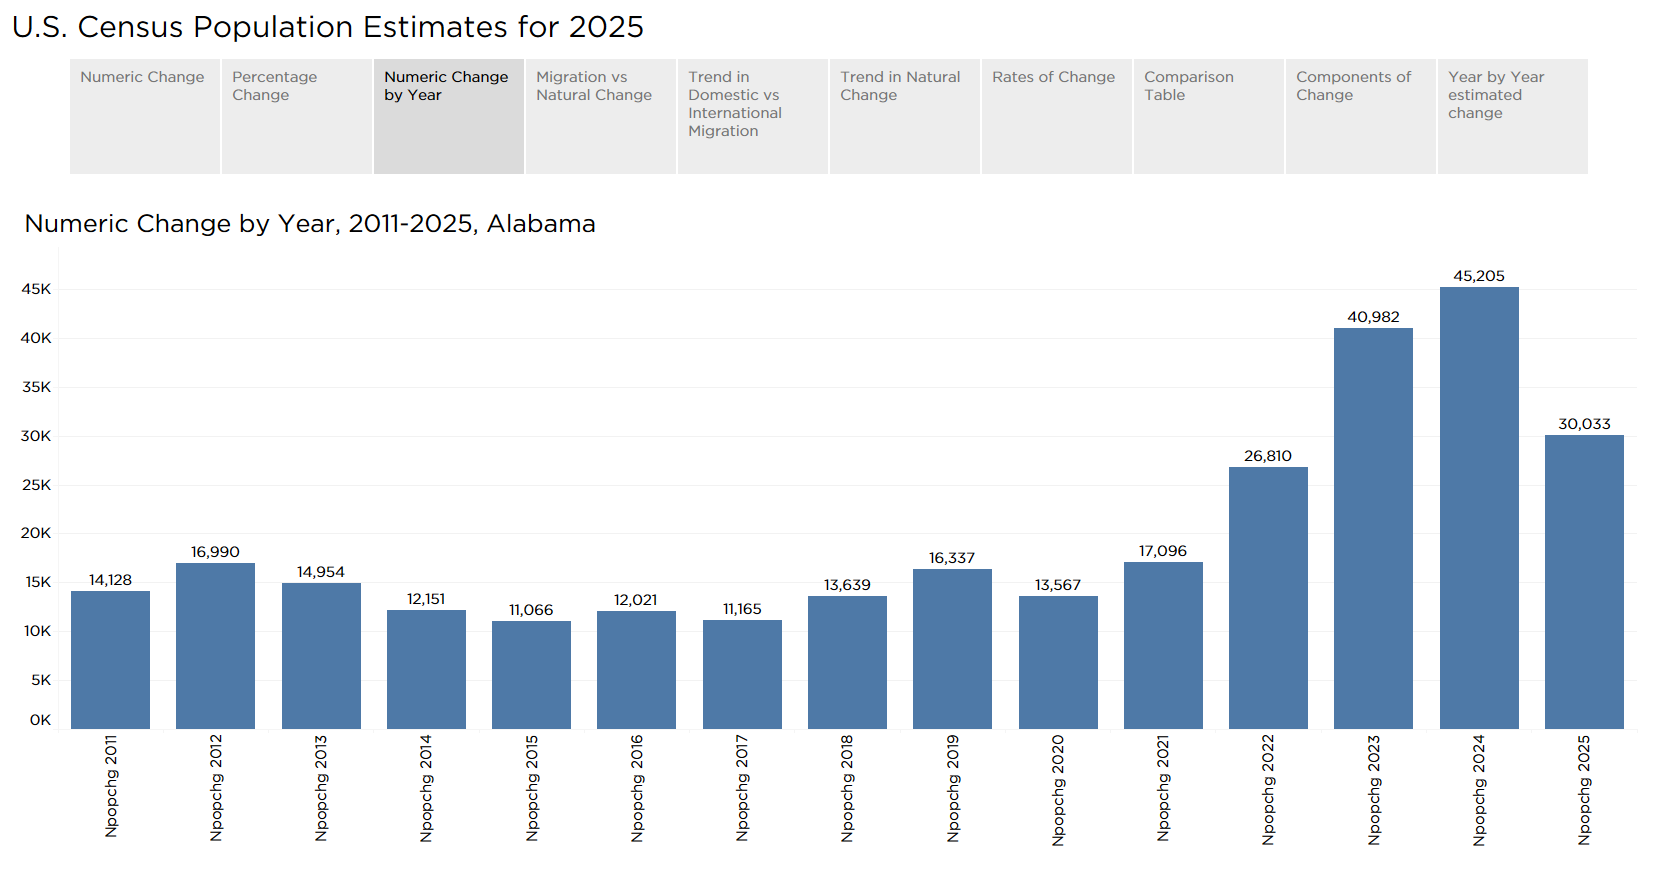
The new estimates released by the U.S. Census Bureau cover the period between July 1, 2024 and July 1, 2025. State-level estimates were released earlier this year. A PARCA analysis of that data showed that Alabama’s population growth hit a peak in 2024, driven in equal parts by international migration, new residents moving to Alabama from other countries, and domestic migration, people moving to Alabama from other U.S. states.
In 2025, the international component dropped sharply, while domestic migration edged down modestly. Deaths outnumbered births in Alabama at large and in all but 17 of Alabama’s 67 counties. Statewide and in most counties, the population would be decreasing without growth through domestic or international migration.
Figure 2. Comparing International Migration in Alabama 2024 vs. 2025

In 2024, central urban counties, like Jefferson, Montgomery, and Mobile, were receiving the bulk of new migrants from abroad. Population increases from international migration helped offset the population decline from people moving from those central counties to surrounding suburban counties or to other states.
However, with the drop in international immigration in 2025, Jefferson and Mobile counties lost population in the latest estimates. In Jefferson County, international migration decreased by almost 2,500 compared to 2024. Nearly 3,000 Jefferson County residents moved to other counties or states in 2025. After accounting for natural change and net migration, Jefferson County’s population decreased by 843 residents. Similar trends led to an estimated population decrease of 535 in Mobile. Montgomery County’s natural increase, plus a decline in outmigration, kept its population about even, increasing by 2, according to the estimates.
Figure 3. Population Change and Migration Components, 2025

National Perspective
These population dynamics within metro areas are not unique to Alabama. In its analysis of 2025 data, the Census Bureau noted that among large metro areas, the fastest-growing counties tended to be on the outer edges, indicating a continuing trend toward suburbanization. Meanwhile, central counties tend to draw the greatest number of international migrants.
For example, the central counties in the Nashville and Atlanta metros also see a net outflow of domestic residents. However, in both those cases, those central counties still attracted enough international immigrants to offset domestic outmigration. And those counties also lie at the center of some of the fastest-growing metropolitan areas in the country.
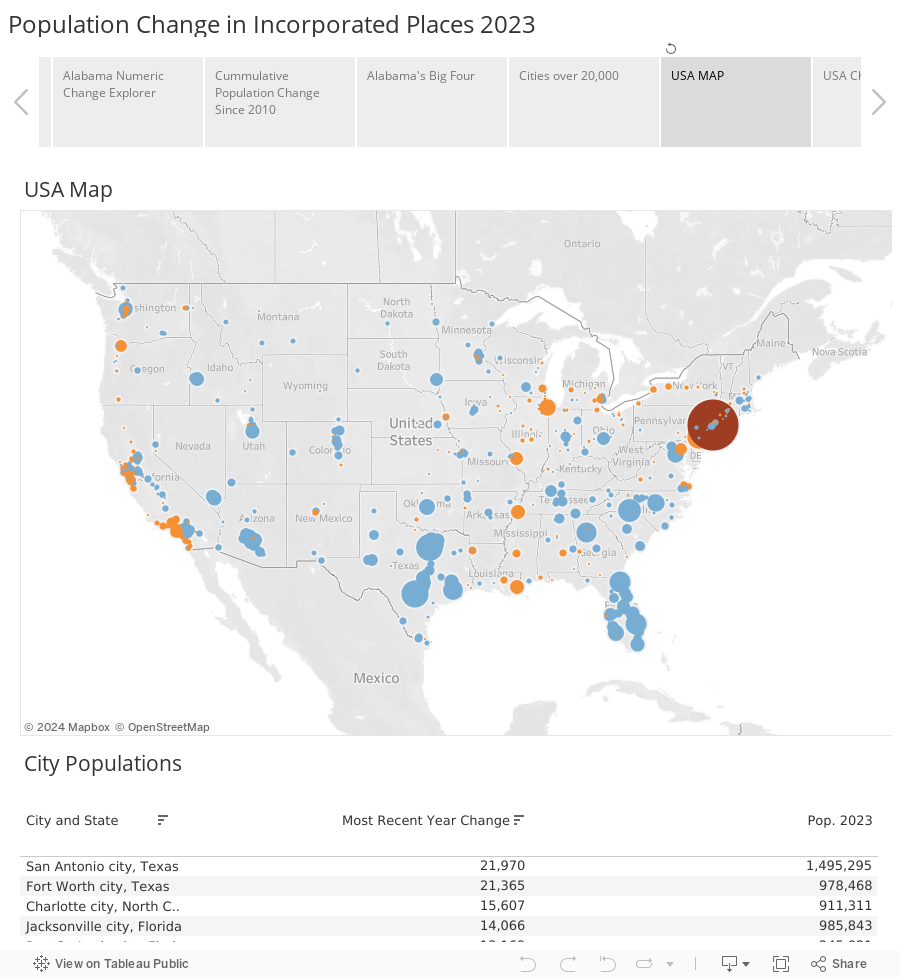
Figure 4. USA Map of Population Change By Metropolitan Statistical Area, 2025

The decline in inflows of international residents depressed growth in central counties and slowed metropolitan growth rates nationwide. The Census Bureau noted that growth in metro areas declined sharply. Average MSA growth was 1.1% between 2023 and 2024, but fell to 0.6% between 2024 and 2025.
Population growth is occurring disproportionately in southern coastal counties and in metro areas in the south. According to Census:
- Geographically, many of the fastest-growing counties were in states along the Southeast coast of the United States, including Florida, Georgia, South Carolina, North Carolina, and Virginia.
- Among counties with populations of 20,000 or more, nine of the top 10 fastest-growing counties were in the South, as were 45 out of the top 50.
Figure 5. USA Map by County of Rate of Change, 2025

Growth Spots
Madison County, home to Huntsville, continued to add more residents than any other county in Alabama. Growth from domestic migration increased in Madison County, which added more than 10,000 people, even as international immigration decreased.
Figure 6. Population Change and Migration Components, 2025

In neighboring Limestone County, growth tapered as international immigration decreased. However, in adding an estimated 3,285 residents, Limestone continued to rank among the nation’s fastest-growing counties with a 3.3% population increase in 2025. Together, Limestone and Madison County make up the Huntsville Metropolitan Statistical Area, which in 2025 was the nation’s 6th-fastest-growing MSA.
Figure 7. Percentage Population Change in Alabama MSAs

Alabama’s second-fastest-growing MSA consists of just Baldwin County and is officially known as the Daphne-Fairhope-Foley MSA. That MSA also continued to grow rapidly, as part of the growth pattern Census noted: people moving to southern counties along the Atlantic and Gulf coasts.
Despite Mobile County being right next door, Baldwin and Mobile are considered two separate MSAs. According to the Census Bureau’s analysis of commuting patterns, there is not enough daily interchange of populations between the two counties to consider them a single MSA. Mobile County’s population declined, in part due to a drop in international migration.
Figure 8. Numeric Change in Alabama MSAs

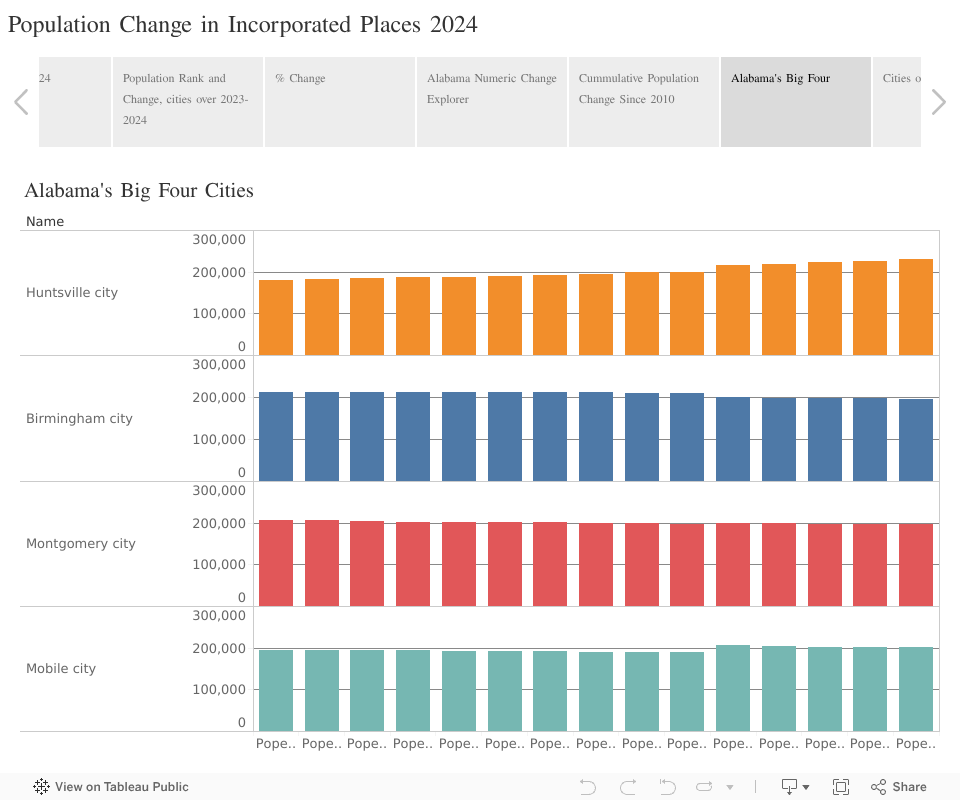
Alabama’s largest MSA is Birmingham, which now includes seven counties: Jefferson, Shelby, St. Clair, Blount, Walker, Chilton, and Bibb, with a population of 1.2 million people. That’s more than double the size of Huntsville, but Birmingham’s MSA is growing more slowly.
In 2025, the MSA added 3,450 people. Most of that growth occurred in Shelby County, which added 2,746 new residents, and St. Clair County, which added 1,160. That put both those counties in the Alabama top 10 for growth, both in pace of growth and number added. Walker, Bibb, and Chilton experienced modest gains. Together, that was enough to offset the decline in Jefferson and Blount counties.
The Auburn-Opelika MSA, which consists of Lee and Macon counties, grew by almost 2,000.
Dothan’s MSA, which includes Geneva, Houston, and Henry counties, added about 1,000 in total. Tuscaloosa County added almost 500 new residents, and Hale County added about 50, but the other two counties in the Tuscaloosa MSA, Greene and Pickens, lost population. So, in total, the four-county MSA was up by just over 300 residents.
Over in East Alabama, Etowah County, which makes up the Gadsden MSA, has posted positive growth for the past three years after several years of decline, adding 411 in 2025. Calhoun County, the Anniston-Oxford MSA grew in 2022 and 2023, but in 2024 and 2025, the estimates point to population decline, a decrease of 469 in 2025.
Huntsville MSA’s north Alabama neighbors in the Decatur and Florence-Muscle Shoals MSA’s grew modestly. In Decatur, Morgan, and Lawrence counties, each added about 200 new residents, a fourth straight year of growth. The Shoals, made up of Colbert and Lauderdale counties, have both been gathering steam in population growth during the current decade, though Lauderdale was estimated to have had a decline of 163 residents in 2025.
Overall, 36 Alabama counties gained population, but only 7 added more than 1,000 people; 31 counties saw population declines.
Rates of Change
The counties losing the population the fastest are in Alabama’s Black Belt. And that trend continued in 2025. Perry, Lowndes, Willcox, Dallas, and Greene counties have each lost 8% or more of their population since 2020. There are now five counties with fewer than 10,000 residents: Bullock, Wilcox, Lowndes, Perry, and Greene.
Figure 9. Rate of Change, Domestic Migration, 2025

Multiple factors are conspiring to drain population from rural Alabama counties. Rural counties also tend not to attract new immigrants from other counties. Domestic migration is also typically low to negative, with younger residents often moving to metropolitan counties where jobs are concentrated. As younger people move away in search of opportunity, the population becomes disproportionately old.
As the Baby Boom ages, that large cohort is beginning to experience increased mortality. As the average age increases, the death rate increases. And since younger people have tended to move to metros, the birth rate has declined.
Figure 10. Rate of Change, Death, 2025

The pattern isn’t confined to rural Alabama. It is also pronounced in the former coal country in the Appalachians, in the Mississippi Delta, and in portions of the West and Midwest.
Figure 11. USA Rate of Population Change by County