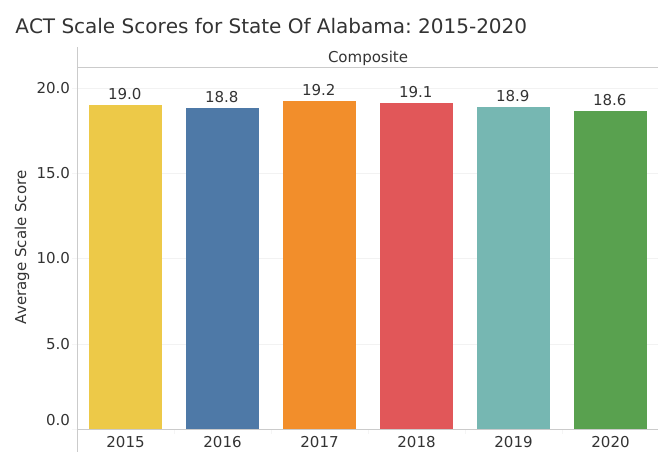
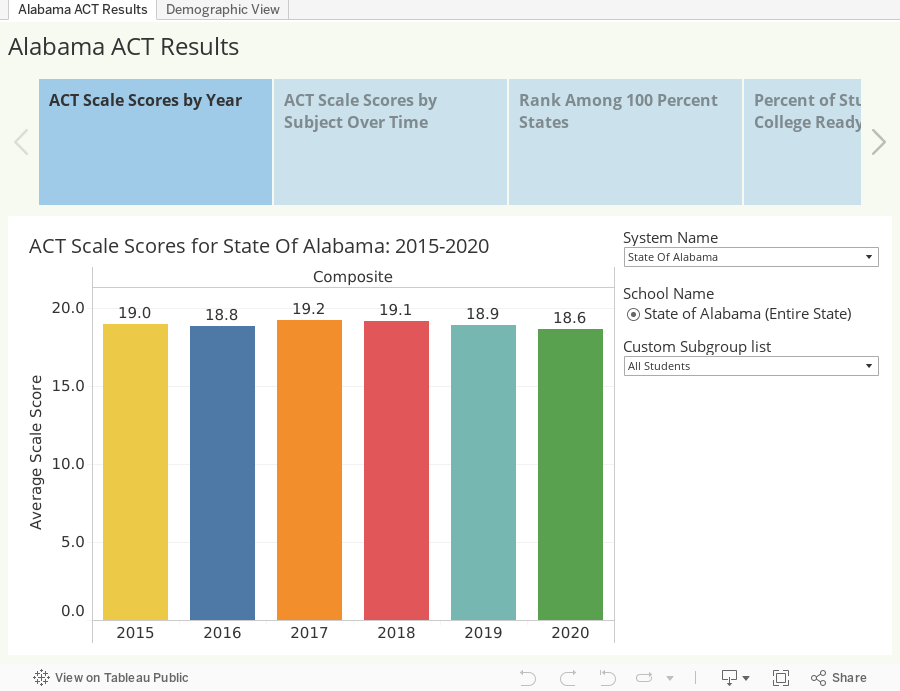
Average ACT scores for Alabama public high school graduates declined with the graduating class of 2020, with students now scoring lower than they did five years ago. The results mirror a national decline that cuts across gender, economic and demographic groups of students.
The scores reported here would not have been affected by the Covid-19 pandemic; 2020’s seniors would have taken the tests and applied for college before the disruption.
Interactive charts in this report allow you to explore the results at the state level and by system and school, subject, and year.
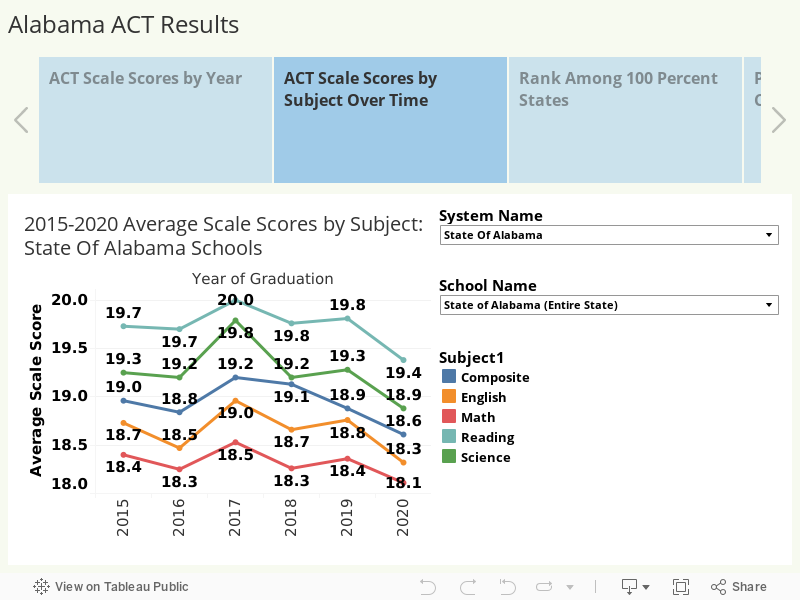
Statewide, the average composite score declined – from 18.9 to 18.6 on a 36-point scale – and the average score in each of the four subject areas – English, reading, math, and science – declined as well.
The data on which PARCA’s analysis is based was obtained from the Alabama Department of Education. The results consider the students’ best individual score by subject if the student took the test multiple times.
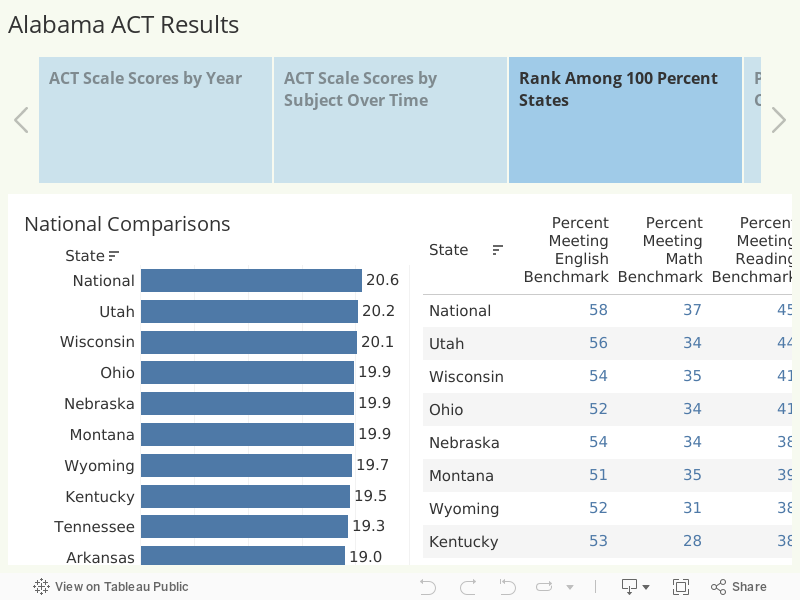
Nationally, composite and subject scores all ticked down. The national average composite was 20.6, down from 20.7 in 2019. Alabama’s average score should not be compared to the national average score. Only half the nation’s high school graduates take the ACT, and the students who do are disproportionately likely to be headed to college. In Alabama, all public high school students take the test. But for both Alabama and the nation, this was the third year in a row of decline. For both, 2017 was the high point over the past five years—Alabama at 19.1, the nation at 21.
A better score comparison is to other states where all public high school students take the ACT. Among those 15 states, average ACT scores range from 20.2 in Utah to 17.9 in Nevada. Alabama is tied with North Carolina for the No. 10 ranking among those 15 states.
For reference, the average ACT for students entering Alabama colleges ranges from a composite score of 18 at Alabama State and Alabama A&M to 28 at Auburn and the University of Alabama in Huntsville.
ACT also reports the percentage of students scoring at or above the college-ready benchmark in each subject. Only 16.3% of Alabama students scored at or above the benchmark in all four subjects in 2020. According to ACT, students scoring at or above the benchmark in a subject have a 50% chance of earning a B or higher or about a 75% chance of obtaining a C or higher in the corresponding introductory college course. Just under half of Alabama students, 48%, scored college-ready in English, but the ACT results indicated that only 21% were ready for success in a college-level math course.
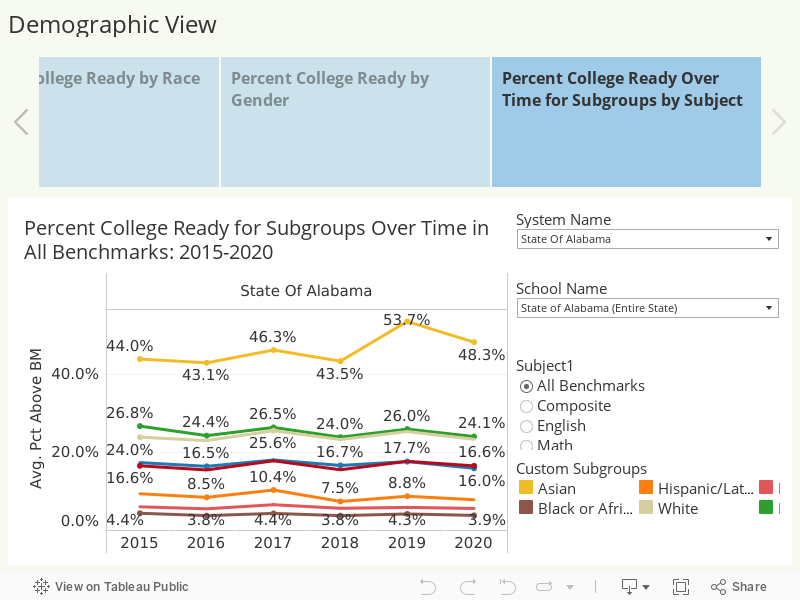
ACT scores are also reported by demographic and economic subgroup. The data points to lingering disparities in scores between non-economically disadvantaged and economically disadvantaged students, between Asian, white, Black, and Hispanic students, and between males and females. But all groups saw scores decline in 2020.
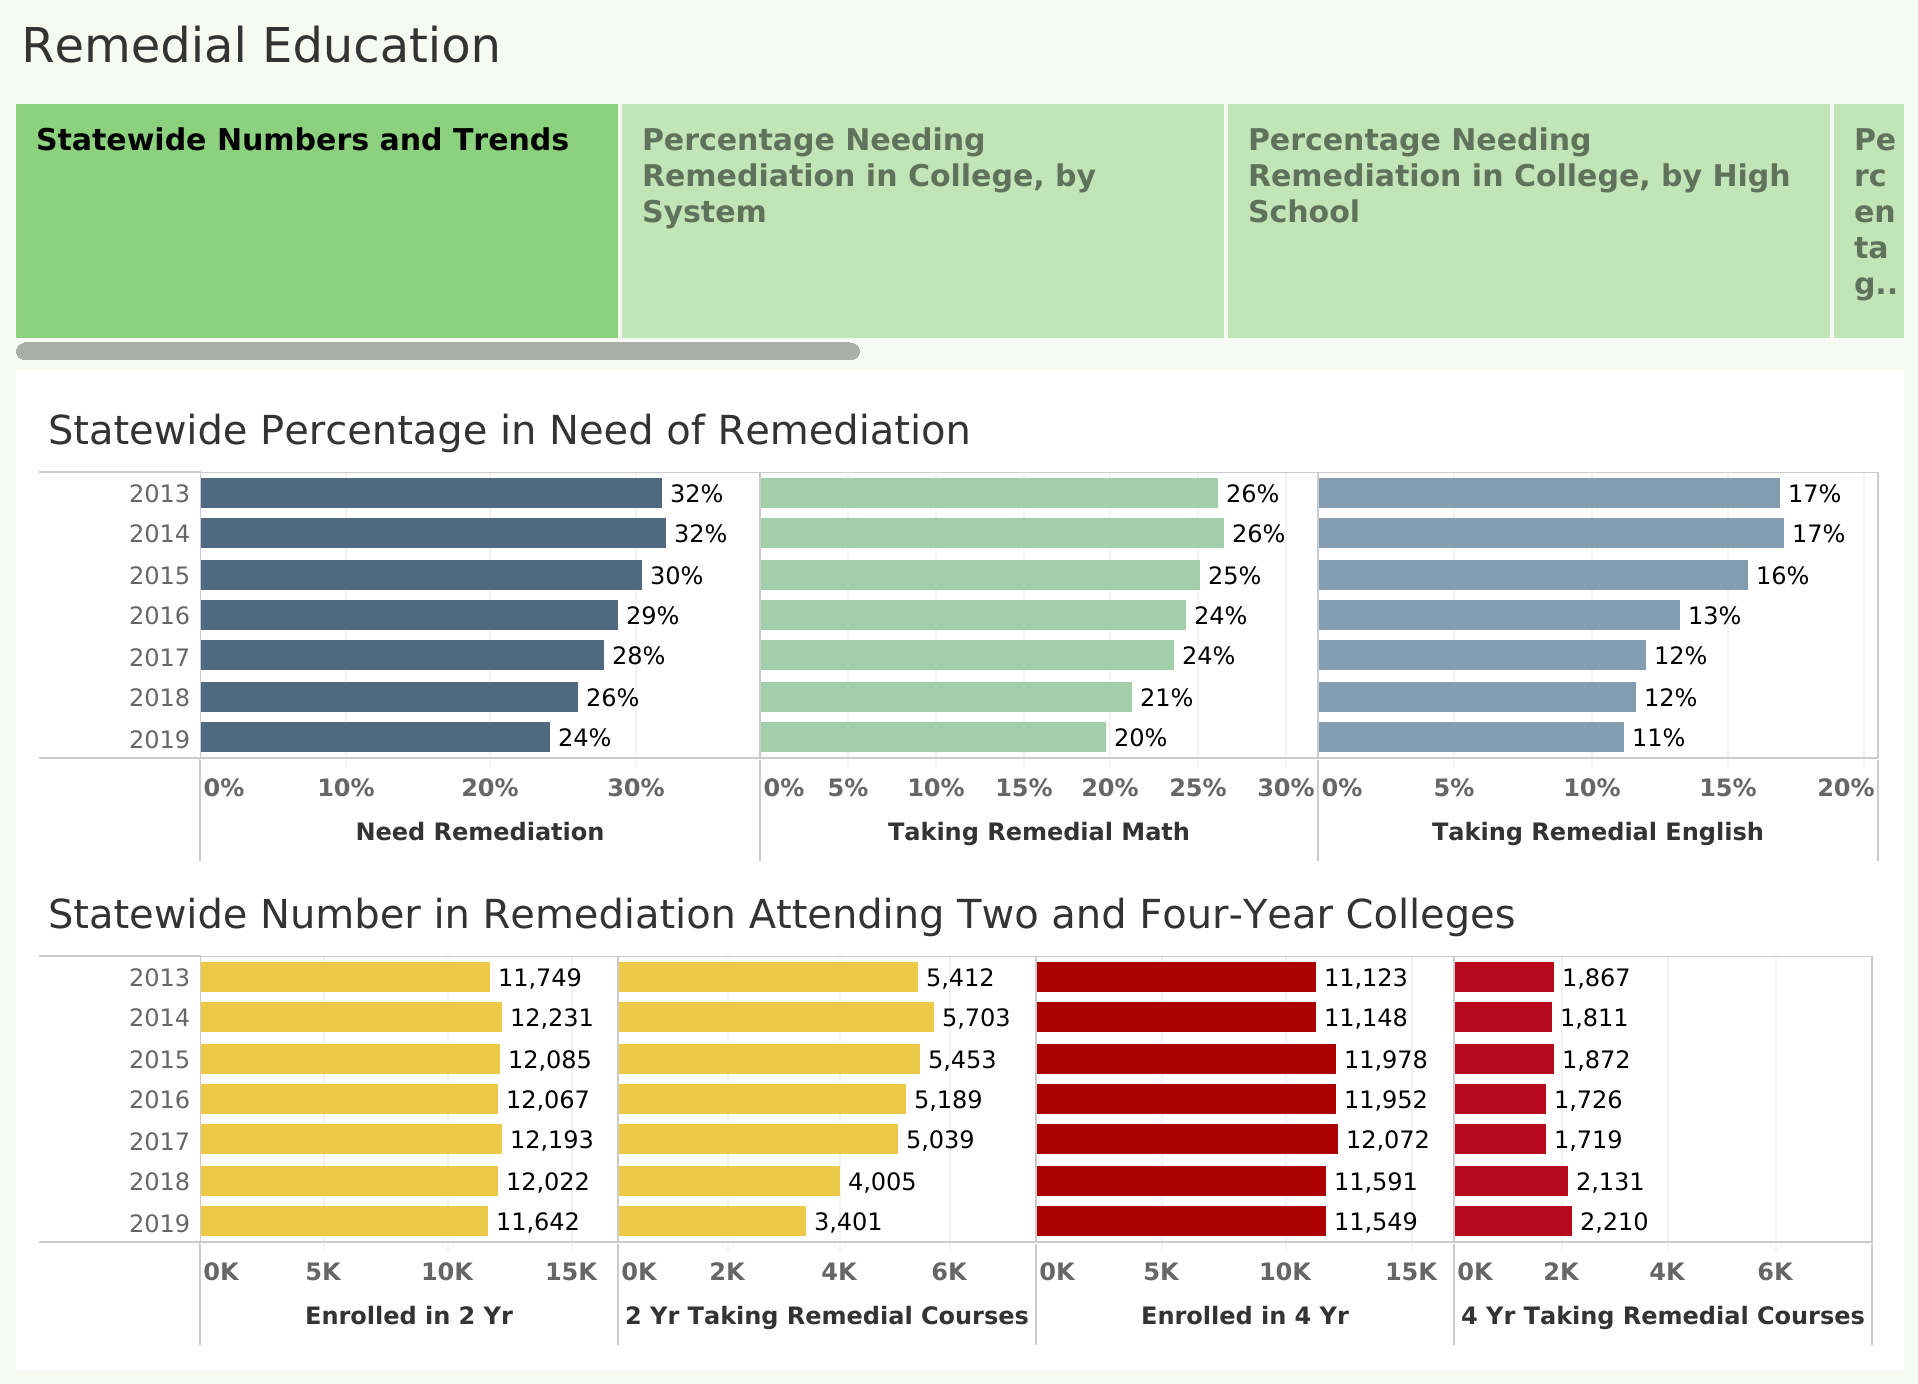
Fewer Alabama Students Assigned to Remedial Education
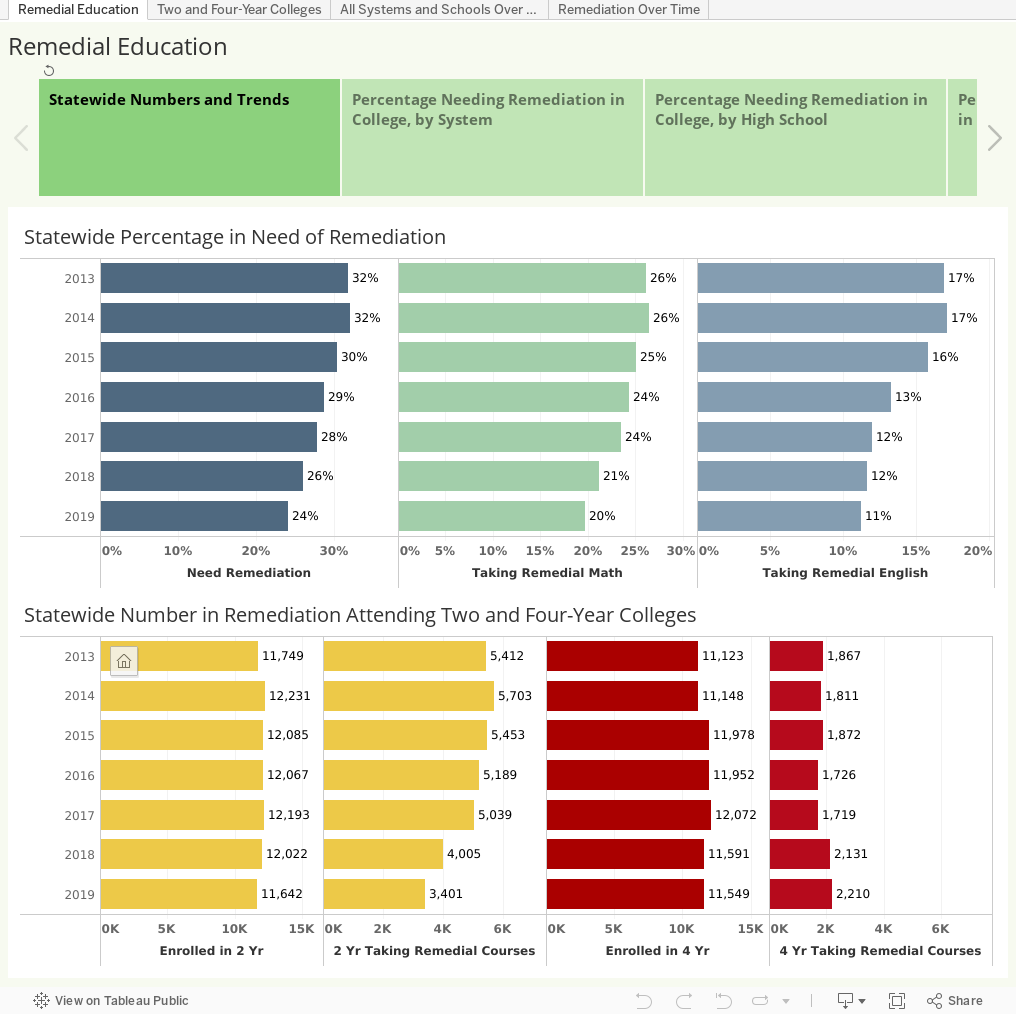
The number and percentage of Alabama public high school graduates assigned to remedial courses upon entering college continued to decline in 2019, one measure of academic progress for K-12 schools and Alabama’s public higher education system.
Remedial classes are non-credit college courses covering material students should have learned in high school. Alabama’s Community College System (ACCS) has recently developed alternatives to those courses, and the decline is attributable to those schools. According to ACCS, not only are fewer students being placed in remedial courses, but also passage rates in introductory courses have risen. Meanwhile, the number of students assigned to remedial courses at four-year colleges has increased modestly.
The data comes from the Alabama Commission on Higher Education (ACHE), the state higher education coordinating board. ACHE works with K-12 and colleges to follow the progression of Alabama high school graduates into Alabama public colleges.
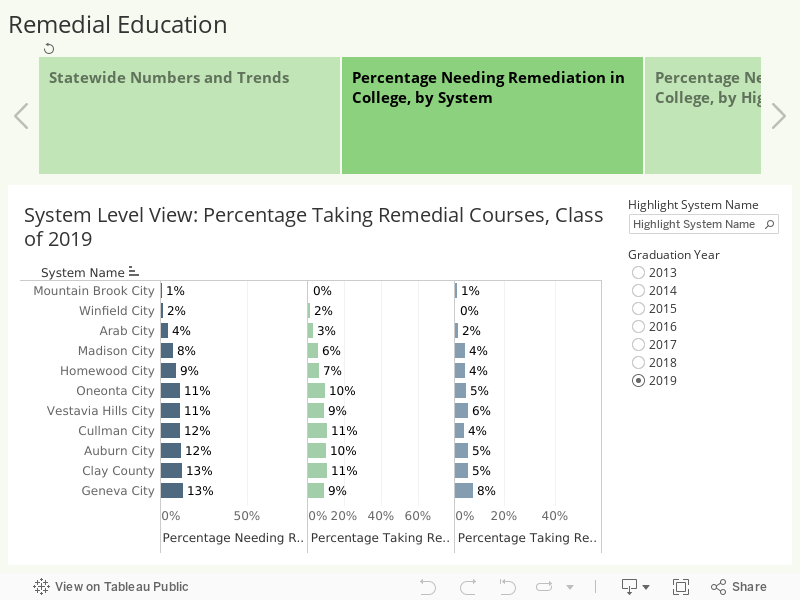
The data provides feedback to high schools about how prepared their graduates are and can give colleges insight for improving student success. Use the tabs in the visualization to explore the data. Compare the performance of graduates from your local high school or system.
Decreasing the number of Alabama public high school graduates needing remediation in college was a goal identified in Alabama’s strategic plan for education, Plan 2020, adopted in 2012.
Remedial education is considered a waste of money for both the state and the individuals paying for higher education. Remedial courses cover material that should be covered in high school. Remedial classes cost students tuition and fees but do not produce credits that count toward graduation. By avoiding remedial courses, students are able to complete college work in a more timely fashion and at less cost.
A combination of factors have likely driven the decline in remediation. Factors include:
Policy changes at two-year colleges that prescribe tutoring alongside introductory college classes, rather than assignment to a remedial class.
Better preparation of students in K-12.
Changes in college-going rates due to the high job availability.
The declines have been equal in reading and math. In 2013, 26% of students required remedial math, and 17% required remedial English. With the class of 2019, only 20% required remedial math, and 11% required remedial English.
Community Colleges Providing Alternatives
In 2018, The Alabama Community College System (ACCS) made system-wide changes designed intentionally to reduce the number of students enrolled in developmental or remedial courses. Students were still assessed for their levels of academic preparation upon enrollment, but, instead of being assigned to either regular or remedial courses, the system used a new tiered placement model. One innovation was enrolling students who needed extra support in a corequisite/tutorial course alongside college-level Math or English. Since the change, the number of students in remedial classes has declined, but the percentage of students passing gateway English and math has increased.
Since 2012, Alabama has pursued multiple strategies to improve K-12 education and to produce high school graduates who are better prepared for college and career.
Most directly tied to college preparation, the state has increased support for dual enrollment, which allows high school students to take courses at colleges, and for Advanced Placement courses, college-level courses taught by high school faculty members. Thanks to additional funding, the number of Advanced Placement Courses offered has increased. Much of that expansion has been in schools with higher numbers of economically disadvantaged students. The success rate on AP tests remained constant between 2013 and 2019, indicating that the expansion was maintaining quality while expanding opportunity.
Despite those efforts, scores for Alabama high school graduates on the ACT, the college-readiness test given to all students, have been flat to slightly declining. And while the number of students assigned to remediation has decreased in the two-year system, as noted, the number of remedial students has risen at four-year colleges.
Are a different mix of students attending college?
Another factor that may be affecting the remediation rate is the choices high school graduates are making about college. Since 2014, the percentage of high school graduates going directly to college has declined from 65% to 58% in 2019. (See PARCA’s analysis of college-going trends). Over that period, Alabama’s high school graduation rate and the number of graduates produced has increased. Most of the enrollment decline has been in the two-year system. Community colleges tend to see enrollment declines when the economy is growing, and the demand for workers is high. In the fall of 2019, when Alabama’s unemployment rate was at a historic low, enrollment in the community college system dipped below 80,000, down from over 90,000 earlier in the decade as the state was emerging from the Great Recession.
It may be that a greater share of the high school graduates who would have needed remediation in college have instead gone straight into the workforce.
Conclusion
Remediation is needed for students enrolling with a major gap in their readiness for college. Given the open admissions policy in the two-year system and for some four-year colleges, remedial courses continue to play a role in higher education. For others who need some help rising to the level of college coursework, it benefits students and schools to provide alternatives to remediation. The most straightforward solution is to improve preparation in high school, and those efforts should continue. The two-year system’s strategy to provide simultaneous tutoring rather than sequential remedial courses appears to benefit students, increasing passing and progression rates. The model ACCS has developed should also be explored for replication at four-year colleges.
2019 Likely a High Point for High School Graduation and Readiness
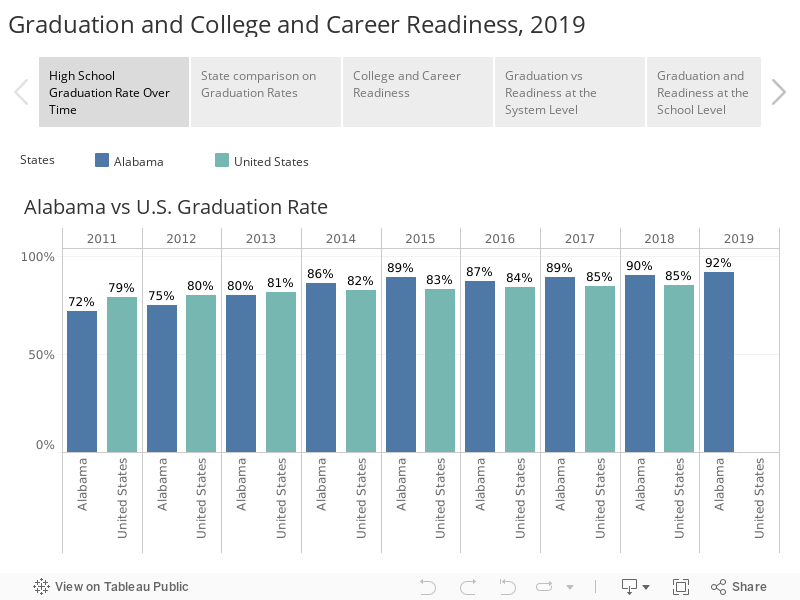
Alabama’s high school seniors of 2019 graduated at the highest rate the state has ever reported, 92%. And, a greater proportion of those students, 80%, were rated college and career ready than ever before. Search results for local systems and schools. Alabama’s reported high school graduation rate now ranks No. 7 among U.S. states.
The rapid rise in graduation and readiness is cause for celebration, but it also leads to questions.
Are rising graduation and readiness rates due to academic progress or easier-to-meet standards?
Do the established measures accurately gauge whether a student is ready for college or the workforce?
Are some schools and students seeking out shortcuts to generate higher rates of readiness?
A high point and a moment for reflection
The high school graduation rate measures the number of ninth-grade students who earn a diploma four years later, the cohort graduation rate.
The graduation rates and readiness levels recorded in 2019 aren’t likely to be matched in the short term. Schools shutdown in March of 2020, and the semester was finished online. That potentially interfered with some seniors catching up on credits or earning the certifications or scores needed to graduate or achieve readiness. Some students likely fell behind in accumulating credits for graduation, certifications from Career Technical Education courses, and other markers of college and career readiness. The altered learning experiences brought on by the pandemic will likely have effects for the next several years.
So, considering this period of uncertainty for on-time graduation and college and career readiness rates, the state and its public schools have an opportunity to make sure both a high school diploma and college and career readiness are meaningful and credible measures of achievement, that the credentials earned by students are valuable and meaningful to colleges and employers.
How goals were set and met
Alabama’s high school graduation rate has been on the rise since at least 2012. It has now topped the announced goal of 90%, set by the state plan for educational improvement, Plan 2020. By 2018, the most recent year for which national comparisons are available, Alabama’s high school graduation had risen 18 percentage points since 2011. Only Nevada’s graduation rate showed more improvement over the period.
The graduation rate’s rise coincided with several changes. First, the state’s graduation exam was scrapped. Second, alternative diplomas that had been available to special education students were eliminated and all completion pathways pointed to a regular high school diploma. Third, the state implemented a credit recovery system that allowed students who failed a course to continue working to master the material, rather than having them take the entire course again. And, finally, the graduation rate, and later the readiness rate, became an accountability measures, motivating faculty and administration to find ways to improve on those metrics.
As the graduation rate rose sharply, so did concern that schools were issuing diplomas to students who weren’t prepared for entry into the workforce or college. In 2018, then-State Superintendent Ed Richardson pointed to the wide gap between the graduation rate and the percentage of seniors who met the state’s definition of college and career-ready. For the class of 2016, for example, the graduation rate was 23 percentage points higher than the college and career readiness rate. Richardson called on schools to focus on closing that gap, demonstrating that graduates were ready.
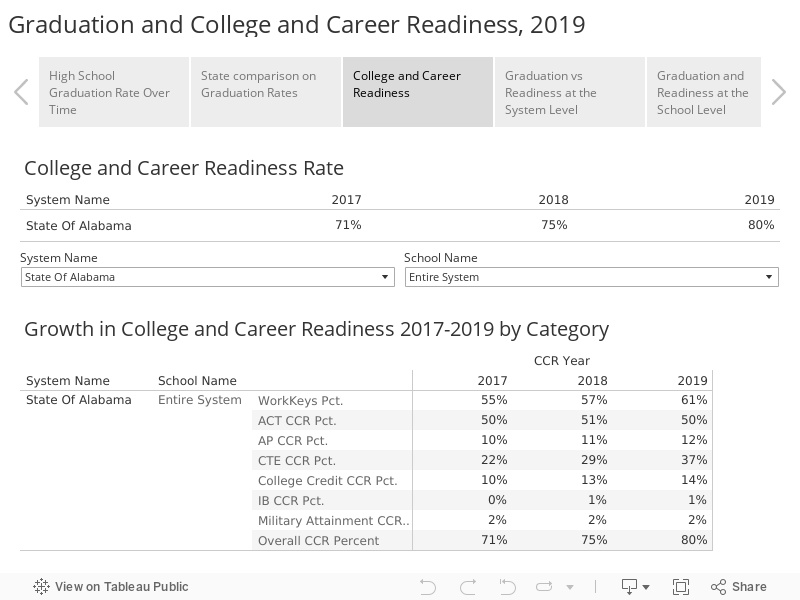
With the release of the 2019 numbers, the gap has closed to 12 percentage points, with 92% graduating and 80% of seniors demonstrating college and career readiness, according to the measures established by the Alabama State Board of Education.
How students are rated college and career ready
The Alabama Board of Education has adopted six ways for high school students to demonstrate that they are ready college and/or career ready.
Score at or above the college-ready benchmark on at least one section of the ACT’s college readiness test
Score Silver or above on ACT’s WorkKeys Assessment
Earn a qualifying score on an Advanced Placement (AP) or International Baccalaureate (IB) test
Earn College Credit through a dual enrollment course
Earn an Industry Recognized Credential prepared for through a Career Technical Education (CTE) Course
Pass the U.S. military’s test for enlistment
A detailed discussion of the individual measures follows, but progress on the measures can be summarized.
College-oriented measures of readiness haven’t improved much. ACT scores and the percentage of students passing them are flat.
The percentage of students earning Advanced Placement is up by 2 percentage points, correlating with the wider availability of courses.
College credit through dual enrollment, usually through community colleges, is up 4 percentage points. Some of those courses are academic and others are CTE classes.
On the other hand, workforce readiness measures have grown more steeply. That makes sense considering the increased emphasis on Career Technical Education in recent years.
Some of those large gains on the work-oriented measures will receive additional scrutiny in the future, as state officials work to ensure that the work credentials align with courses of study and available employment opportunities.
The chart below tracks the growth between 2018 and 2019 on the various readiness measures.
ACT
From 2017 to 2019, scores on the ACT, the widely known college entrance test, have remained flat among Alabama seniors. About half of students earn a benchmark score on one of the ACT subjects: English, reading, math, and science. Students are most likely to score at or above the benchmark in English, indicating that they are ready to take English 101 and pass. According to ACT, a student scoring at the benchmark has a 75% chance of making a C or better in a college-level course in that subject. The ACT is administered in the public schools in the junior year. However, a student can take the ACT before or after that and continue to take it to improve their score.
WorkKeys
ACT also produces a test of applied knowledge called WorkKeys. WorkKeys has been a growth area. In 2017, 55% of seniors scored high enough to be considered ready for the workforce. By 2019, that percentage had climbed to 61%.
WorkKeys is a test of reading, writing, and graphical comprehension as those skills might be used in the workplace. A student’s performance on the test can earn a certificate at one of four levels: bronze, silver, gold, or platinum. Students earning silver or above are considered ready for the workforce, demonstrating a level of skill required by 69% of jobs in ACT’s database of profiled jobs.
As schools have become more familiar with WorkKeys, some have instituted training sessions for the test, recognizing that some students may be better able to earn a qualifying score on WorkKeys than on the more academically-oriented ACT.
AP/IB
AP and IB courses and tests are designed to reflect college-level learning, both in course delivery and rigor. Alabama has steadily increased its investment in AP courses in particular, spreading these nationally-recognized and benchmarked courses and tests to more school systems. To demonstrate college readiness on this measure, a student has to score 3 or above on the end-of-the-year AP test. A score at that level can allow a student to claim college credit at many colleges.
The percentage of seniors earning a qualifying score through the AP test has increased, from 10% of seniors to 12%. Credit through IB, which is offered at far fewer schools, has also increased slightly.
Due to the pandemic, AP success is likely to be negatively affected. The shut down of school in the final weeks before the tests damaged preparation. The tests were offered, online, in modified form, but it is unclear what the participation and success rate will be due to the alteration.
College Credit
This category measures the percentage of seniors who earned college credit by taking and passing a college-level course while still in high school. For the most part, these are courses offered through the state’s network of community colleges. The percentage of students earning dual enrollment credit has climbed from 10% to 14% of high school seniors, thanks to a boost in investment from the state to expand these offerings, as well as a greater effort on the part of K–12 and community colleges to make these opportunities available to students.
These dual enrollment courses can be academic in nature, but more often, are career-oriented, giving students a jumpstart on college or training for workplace certifications and licenses.
Career Technical Education
This area, which has been an area of expanded focus for schools, saw the biggest gains between 2017 and 2019.
The percentage of students earning credit through CTE rose from 22% of seniors in 2017 to 37% of seniors in 2019, the largest gain among all the measures. Some CTE credit is hard-won, the product of months or years of training and education resulting in a valuable credential or certification that can be used to secure a job upon graduation.
However, some of the fastest-growing credentials are of questionable value in the marketplace and can be earned through brief coursework and short online examinations. PARCA research for the Business Education Alliance found that some of the fastest-growing credentials included certifications such as adult beef quality assurance and certified guest professional. Thousands of additional credentials have been issued along these lines. While the certificates may reflect useful knowledge, they don’t require extensive coursework or knowledge to earn. Beyond that, the volume at which these credentials are being issued doesn’t match available employment opportunities.
According to data provided by the Alabama Department of Education, credentials issued in Adult Beef Quality Assurance and Certified Guest Service Professional constituted almost 40% of the 30,040 credentials issued in the 2018-2019 school year for students 6th – 12th grade.
State Education Department officials as well as officials in colleges, workforce agencies are working with the governor’s office and industry to provide schools more guidance on how to define an industry-recognized credential. Going forward, an industry-recognized credential that counts for career readiness should be one that is linked to a rigorous course of study, one that confirms a student has mastered the material. Further, the credential should qualify its holder for a legitimate job opportunity in an in-demand field.
Conclusion
Educators have shown that they can respond to a performance goal. Over the past decade, Alabama has seen a dramatic rise in its high school graduation rate from among the lowest in the nation to among the highest.
In an even shorter time frame, the percentage of students designated college and career-ready has also climbed significantly. Progress toward goals should be applauded. At the same time, we should ensure that the pursuit of goals should produce meaningful results for students and the broader public.
The pandemic will undoubtedly lead to some erosion in immediate measures of educational progress, but it also affords an opportunity to focus measurement and goal setting on valuable ends.
The visualizations below allow you to compare systems individual schools on graduation rates and college and career readiness. Use the available menus to select schools and systems you want to focus on. Remember, the socio-economic composition of the student body tends to affect performance.
Performance by System
Performance by High School
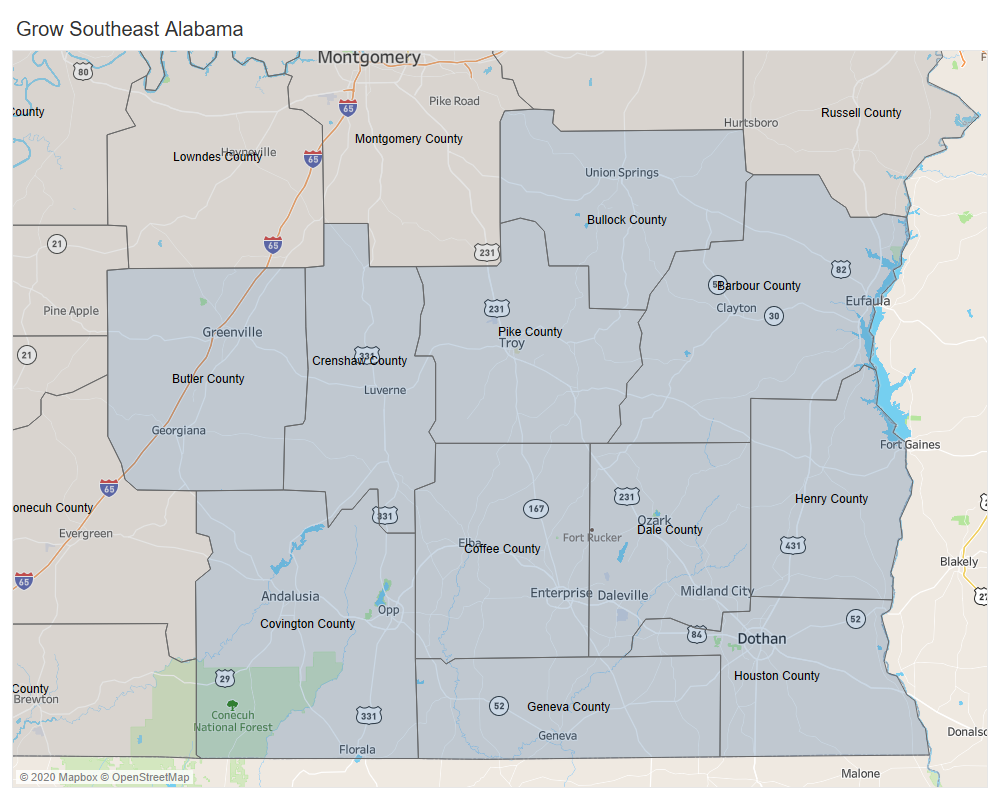
Cooperating for Growth in the Wiregrass
Before the Coronavirus pandemic, economic developers in Southeast Alabama recognized the advantages of pulling together as a region rather than each city and county trying to recruit new industry independently. Wanting to take cooperation to a new level, they asked PARCA to investigate how other regional economic development organizations across the state and across the nation work.
When the pandemic struck, cooperation shifted into overdrive, and more counties rallied to the cause.
“We really pulled together as a region. We shared information about challenges and opportunities in the face of the crisis, and we strengthened our relationships,” said Veronica Crock, president of the Ozark-Dale County Economic Development Corporation. “As we come out of the pandemic, we will all benefit from working together to retain our existing businesses in a time of such uncertainty, and we will benefit from working together as a team to bring new jobs and industry to our region.”
PARCA’s newly released report, Growing Cooperation in Southeast Alabama, describes the efforts of the 11 counties in the state’s Wiregrass region to turn their loose alliance into a sustainable regional organization. Together, the counties hope to broaden their appeal, extend their reach, and amplify their message, while decreasing duplication of effort and expense.
Grow Southeast Alabama consists of economic development entities in Houston, Henry, Butler, Crenshaw, Coffee, Covington, Dale, Barbour, Bullock, Geneva, and Pike counties. Most off the Interstate corridors that connect the state’s largest metros, the counties in the Southeast corner of Alabama sometimes feel overlooked and undervalued. While known for peanut farming and pine forests, the region’s strength as a hub of aerospace and defense contractors is under-appreciated. Dothan, the region’s center of gravity, is the state’s seventh-largest city and is ringed by smaller but still considerable population centers, Enterprise and Ozark. Dothan is growing and serves as a trade and healthcare hub for a wide radius of counties in Alabama, Georgia, and Florida.
Though the counties are united under the state’s regional workforce council system, they are spread and don’t have a long history of working together. While that’s not uncommon, some portions of the state have a head start on building economic coordination and regional identity across county lines. For instance, North Alabama counties have been working together for decades through the North Alabama Industrial Development Association and the Alabama Mountain Lakes Tourist Association. There is no set pattern for how the various roles in economic development and workforce development are organized and carried out at the regional level. Sometimes a regional chamber of commerce, like the Birmingham Business Alliance or the West Alabama Chamber of Commerce, may play an overarching role. And meanwhile, a locally-funded economic development organization engages in more targeted recruitment and support for existing industries.
The developers involved in Grow Southeast are sorting out which functions will be carried out by a regional organization and which will remain local. A central challenge will be sustainably financing the regional organization while preserving funding for the local economic development organizations and programs. Another will be setting up rules and expectations for working together for the region while, at times, competing on behalf of their local community.
“We greatly enjoyed working with the PARCA team and are grateful for the professional, thorough, and detailed report they provided,” Crock said. “Their research was not only instrumental in bringing to light the positive and negative aspects of working collaboratively in a competitive environment, but also confirmed our commitment to putting this competitiveness aside for the sake of the region.”
“We benefitted from the research into the framework of successful economic development in other regions in the United States,” she said. “We will certainly rely on this report as we position ourselves to move forward in our regional collaboration effort.”
Raising Educational Attainment by Keeping College Graduates
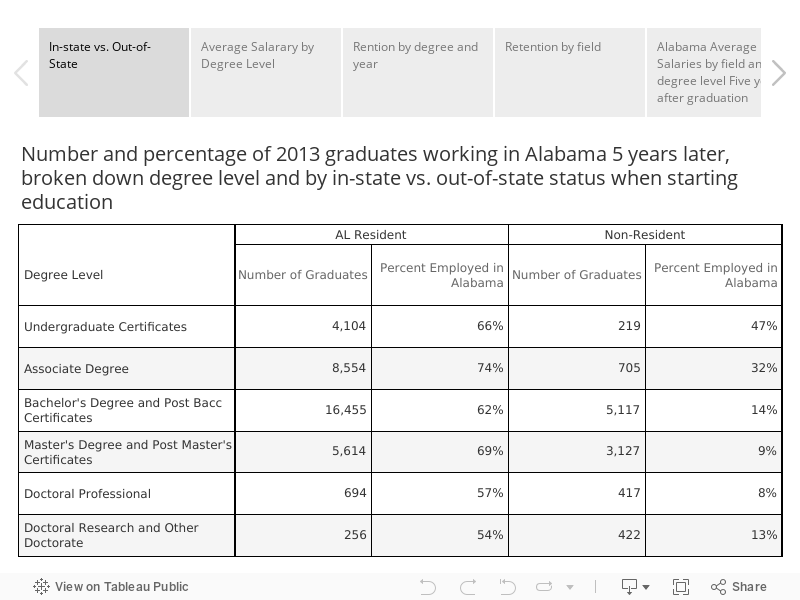
The study, which compared graduation records to labor force data, found that 62% of in-state students who earned a degree were in the state’s labor force after five years, but only 14% of the out-of-state students who earned bachelor’s degrees from Alabama institutions continued to work in the state.
Keeping more college graduates in Alabama is vital. Increasing the number of highly trained and educated individuals in Alabama is a cornerstone goal of Success Plus, the workforce improvement initiative championed by the Governor’s Office and state business and education groups. So far, most of the attention in that initiative has gone toward enhancing connections between education and business and aligning education and skills offerings with the needs of students and Alabama’s employers. Those efforts may help keep graduates, but more direct retention efforts appear to be warranted.
Education Powers the Economy
The state’s overall economic and social prosperity is strongly tied to its raising levels of educational attainment. Earning power and labor force participation rates are closely linked with educational attainment, a fact the ACHE study reinforces. As a recent PARCA analysis shows, states with higher levels of education, particularly bachelor’s degree attainment, have higher income levels and better health outcomes. Alabama has historically lagged behind other states’ residents with a high school degree but is now close to the U.S. average. However, when it comes to college education, the gap remains, and may be widening.
Post-high school training and education is required in most of the job fields where employment growth is occurring. Companies looking for highly skilled workers tend to locate and expand in areas where those graduates are concentrating. That drives job creation which then draws applicants, creating a feedback loop.
This cycle can be seen within Alabama with metro cities and counties drawing an increasing share of the highly educated population. And it can be seen nationally, as the percentage of population with a college education grows faster in other states than it is grows in Alabama. The ACHE study shows one reason why: Alabama is exporting its higher education graduates.
ACHE’s study used institutional data from Alabama two-year and four-year schools to identify graduates and then looked for those graduates one year and five years later in Alabama Department of Labor data drawn from the unemployment compensation system.
The study would not capture graduates who are self-employed or who are not in the workforce but are still living in Alabama. And it does not provide information on where graduates may have moved.
Still, ACHE’s analysis is an innovative collaboration between state agencies, a collaboration that previews the insights that can be gleaned from a privacy-protected, linked system of government databases.
Rate at which graduates are working in the state five years after graduation
In-state employment rate by degree field and degree level
Earnings by field and degree level from community college-awarded certificates up to doctoral degree.
National Comparisons
Since this is data specific to Alabama graduates and Alabama workers, ACHE can’t provide a matching dataset from other states to determine whether Alabama’s retention of graduates is higher or lower than other states.
However, studies based on other data also indicate that Alabama is a net exporter of college graduates and is experiencing a brain drain.
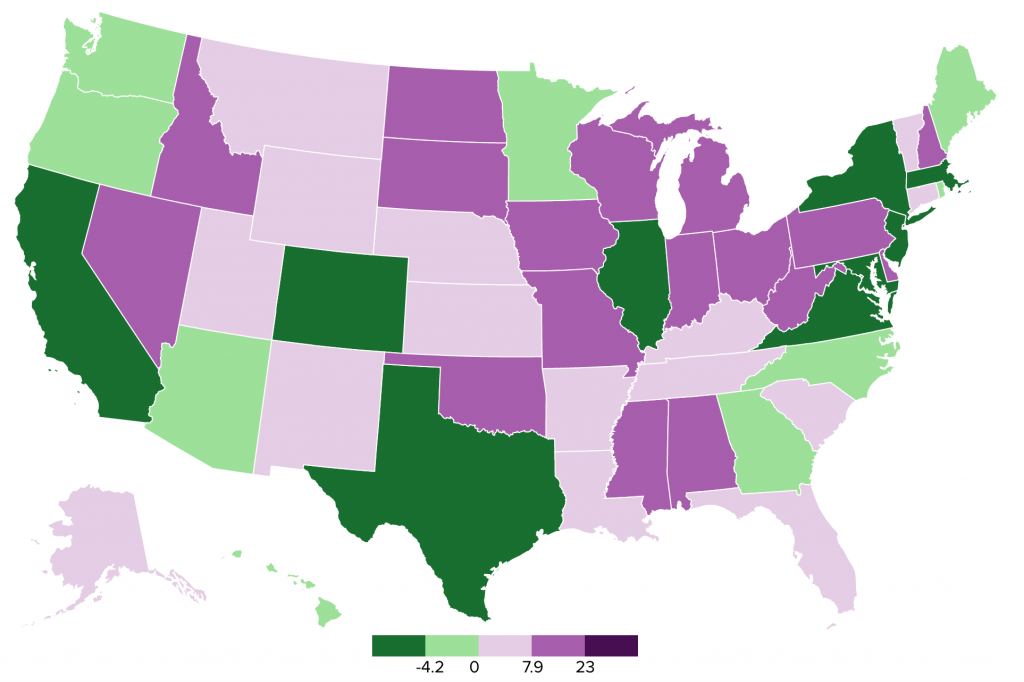
A 2019 study by the Joint Economic Committee of the U.S. Congress used Census data to track patterns of migration between states of individuals with higher education credentials.[1] The data identified individuals born in one state who, as middle-aged adults, were living in another state. A group of states clustered along the East and West Coast are drawing a disproportionate share of people with higher levels of educational attainment. Texas, Colorado, and Illinois are also gaining college graduates. They also tend to be home to large cities and their suburbs. The report concludes that the overall pattern of migration has led to a sorting process, a divergence in economic growth, and a parallel divergence in political attitudes between the states.
Figure 1. Net Brain Drain, 2017
The states in green are taking in more college graduates than they are sending away. The states in purple send more graduates out of state than they are bringing in.
This map displays each state’s “net brain drain.” Net brain drain calculates the number of highly educated people who stayed, minus those who left, plus the new highly educated “entrants” who come from other states. Accounting for those flows, Alabama and Mississippi were experiencing brain drain, represented by a positive number. (Alabama has 8.8 percentage point Net Brain Drain; Mississippi’s was 13.5). By contrast, Georgia had a negative brain drain (-1.1), indicating they were actually experiencing a brain gain, drawing in more educated residents than they were losing.
The data from the report indicates that Alabama exports highly educated individuals primarily to other Southern states. Alabama exports the most graduates to Georgia, followed by Florida, Tennessee, Texas, and North Carolina.
Who do we keep?
Most people, 70%, who earned an associate degree in Alabama were working in Alabama five years later. Those earning certificates were slightly less likely to show up on Alabama work rolls five years later, with about 64% located.
For degrees above associate, the higher the degree the less likely that the individual could be found working in the state five years later. Those who earned doctoral research degrees at Alabama institutions are the least likely to be working in the state five years after earning their degree.
Looking under the surface, Alabama residents are much more likely to remain and work in the state compared to non-residents who come to Alabama to attend college.
About a quarter of those earning an undergraduate degree in Alabama originally came from out-of-state to attend college in Alabama. The University of Alabama has been particularly aggressive about recruiting out-of-students. So much so, that resident students now make up less than 40% of the student body. Auburn has a long tradition of attracting out-of-state students, particularly from Georgia, over 40%t of its student body is from out-of-state.
But five years after earning a degree in Alabama relatively few of those out of state students were found to be working in the state.
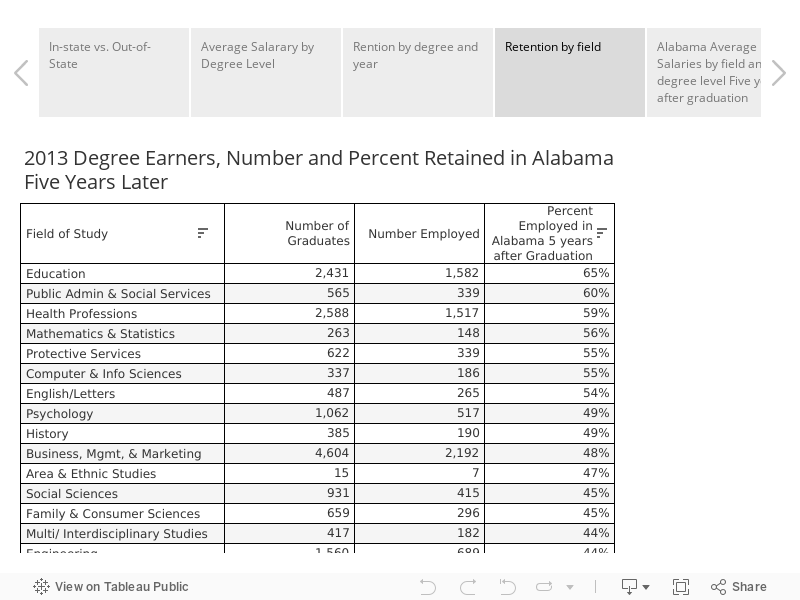
Graduates in education, health professions, engineering technologies, and social services were most likely to work in Alabama.
On the other hand, doctoral graduates and graduates in fields of study such as architecture, physical sciences, and communications were the least likely to be employed in the state after five years.
As Alabama attempts to raise educational attainment levels in the workforce, those out-of-state students would be a prime target for retention. At the same time, investments in the success of our in-state students are more likely to pay dividends since they are more likely to stay in the state.
Earnings by degree field
The ACHE study confirms national studies on the effect of education on income levels. In general, each step up the educational ladder yields a higher income. That differential further explains why raising educational attainment is advantageous for a state: the more highly educated residents in the state, the higher the total income.
Across the board, a person earning a doctoral degree in a field earns about 3 times more that someone who earned an associate degree in the same field.
This snapshot of earnings does not take into account the cost incurred by an individual who pursued higher education. Nor does it take into account the delay in starting a career while pursuing a degree. However, considering the long term pay off, the additional investment does, on average, produce rewards.
Still, the differential provided by a degree very much depends on which field the degree is in. For instance, associate degree holders in science technologies, construction trades, agriculture, and precision production were, on average, earning over $50,000 a year five years after graduation. On the other hand, bachelor’s degree holders in 23 fields identified in the ACHE study– area and ethnic studies, communications technologies, English, public administration, visual and performing arts, psychology, and foreign languages among them) average less than $50,000 a year after five years.
The highest average salaries among bachelor’s degree holders five years after graduation were among those with degrees in engineering ($74,191) and computer and information sciences ($65,792). Followed by engineering technologies ($59,796), health professions ($54,832), and business management and marketing $54,547).
Strategies for Retention
As a result of the Employment Outcomes report, ACHE has begun to implement initiatives designed to improve the retention of recent graduates. Such initiatives include increasing student engagement with Alabama industry by increasing internships, and having invitation-only community-based job fairs for soon-to-be graduates in certain fields.
ACHE plans to conduct a survey of soon-to-be graduates to get a baseline impression of Alabama and career opportunities. Institutional level results from the Employment Outcomes report have been supplied to colleges so those schools can examine in-state demand for graduates by field. They can also target for retention those students in fields where graduates are being lost.
ACHE is helping retain education graduates through incentive programs that help students pay back college loans in exchange for teaching in high need fields and in school systems that face challenges in hiring teachers. ACHE has also helped local communities, most recently Decatur and Demopolis, with initiatives designed to recruit and retain recent college graduates.
[1] U.S. Congress, Joint Economic Committee, Social Capital Project. “Losing Our Minds: Brain Drain across US States.” Report prepared by the Chairman’s staff, 116th Cong., 1st Sess. (April 2019), https://www.jec.senate.gov/public/index.cfm/republicans/2019/4/losing-our-minds-brain-drain-across-the-united-states.
Agenda for Alabama’s Third Century: Raising Educational Attainment for All
While Alabama continues to gain on other states in the percentage of adults with a high school diploma, it is falling further behind the national average when it comes to the percentage of the population with a bachelor’s degree or better.
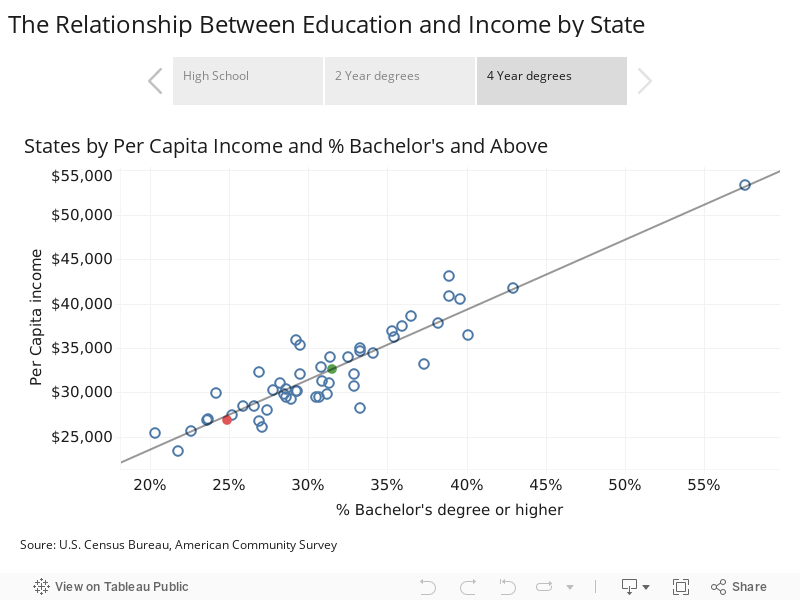
The visualization below shows the correlation between a state’s per capita income and the percentage of adults (individuals 25 years or older) who hold a bachelor’s degree or higher. The greater the percentage of college-educated adults in the state population, the higher the state’s per capita income. And vice-versa. The correlation holds true for the percentage of the population with an associate degrees.
In response to changes in demographics and the economy, Alabama leaders launched a full-court press to raise levels of educational attainment, recognizing that as a cornerstone of future prosperity. The Success Plus initiative brings government, education, and business together around a coordinated effort to raise educational attainment and post-high school advanced skills training, with the goal of adding 500,000 highly skilled workers to the workforce by 2025. In the face of the Coronavirus pandemic, it’s all the more important to sustain educational momentum and prevent the exacerbation of educational inequities that have held Alabama back.
PARCA opened 2020 with an annual meeting in January that challenged speakers to sketch out a vision for our state’s third century. We’re revisiting the central themes explored at that meeting in the coming months, beginning with this installment on educational attainment.
From PARCA’s work with schools and governments, successful organizations follow a process in order to pursue a vision.
Know where you stand and own your data.
Make a plan for improvement, one that includes goals and evidence-based strategies for how to achieve them.
Measure progress toward your goal. Analyze the results.
Celebrate successes. Shift resources and strategy if tactics aren’t working.
This report, as a first step, describes where Alabama stands in comparison to other states in educational attainment.
Narrowing the Gap in High School Attainment
It’s not a surprise that Alabama trails other states. The state is dragged down by its historic underinvestment in education, by the legacy of racially-segregated, separate and unequal schools, as well as continuing inequities and de-facto segregation in some areas.
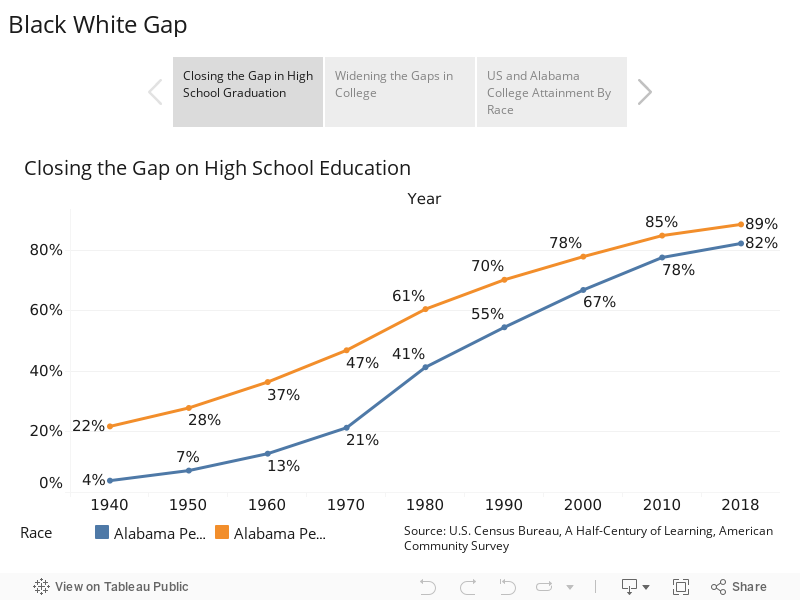
Here’s the good news: Alabama has shown it can produce dramatic change. When it comes to raising the percentage of adults with high school education, it has, according to Census Bureau data. 1
By 2018, Alabama had nearly closed the gap with the US average for the percentage of the state’s adult population with a high school degree.
In 2018, 87% of Alabama adults had a high school degree compared to 88%.
And while work remains to be done, Alabama has also made significant progress in closing the gap between Blacks and whites in high school attainment. In 1940, after decades of Black flight from the South and with segregation still in full force, only 4% of Black adults in Alabama had a high school diploma, compared to 22% of whites. Both races trailed well behind the national averages. By 2018, 82% of Black adults in Alabama had a high school credential compared to 89% of whites. Across the U.S., 85% of Blacks and 93% of non-Hispanic whites have a high school credential.
In spite of advances, Alabama still ranks No. 44 among the 50 states in the percentage of its population with a high school degree, thought the gap between all states is much narrower than it once was.
Falling Behind in Bachelor’s Degree Attainment
The gap is much wider when it comes to the percentage of the population with a four-year degree. When it comes to bachelor’s degree attainment, Alabama has failed to keep pace with the growth rates in other states.
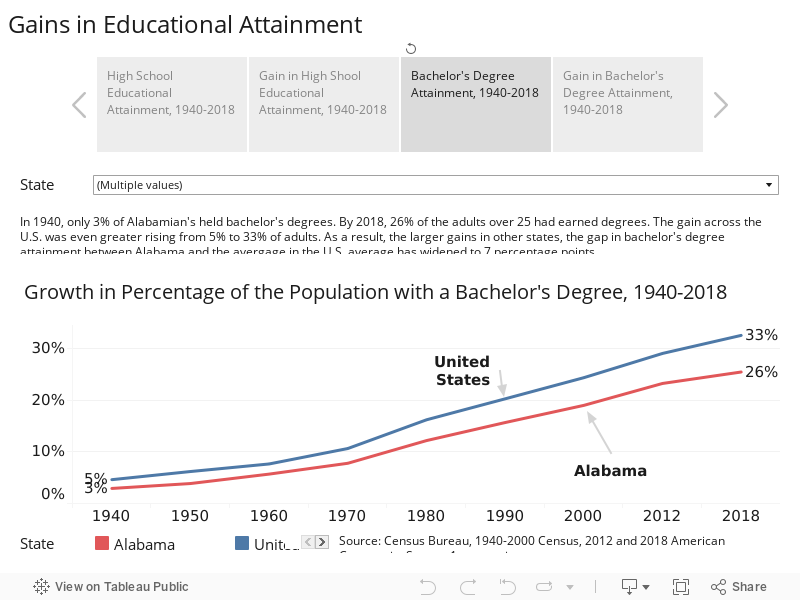
In 1940, the percentage of the population with a college degree was small in Alabama (3%) and the U.S. (5%).
Since 1940, the percentage of the population with a college degree has steadily increased but Alabama’s growth rate has been slower than the national rate, resulting in the current gap of 7 percentage points.
Use the menu to select other states for comparison
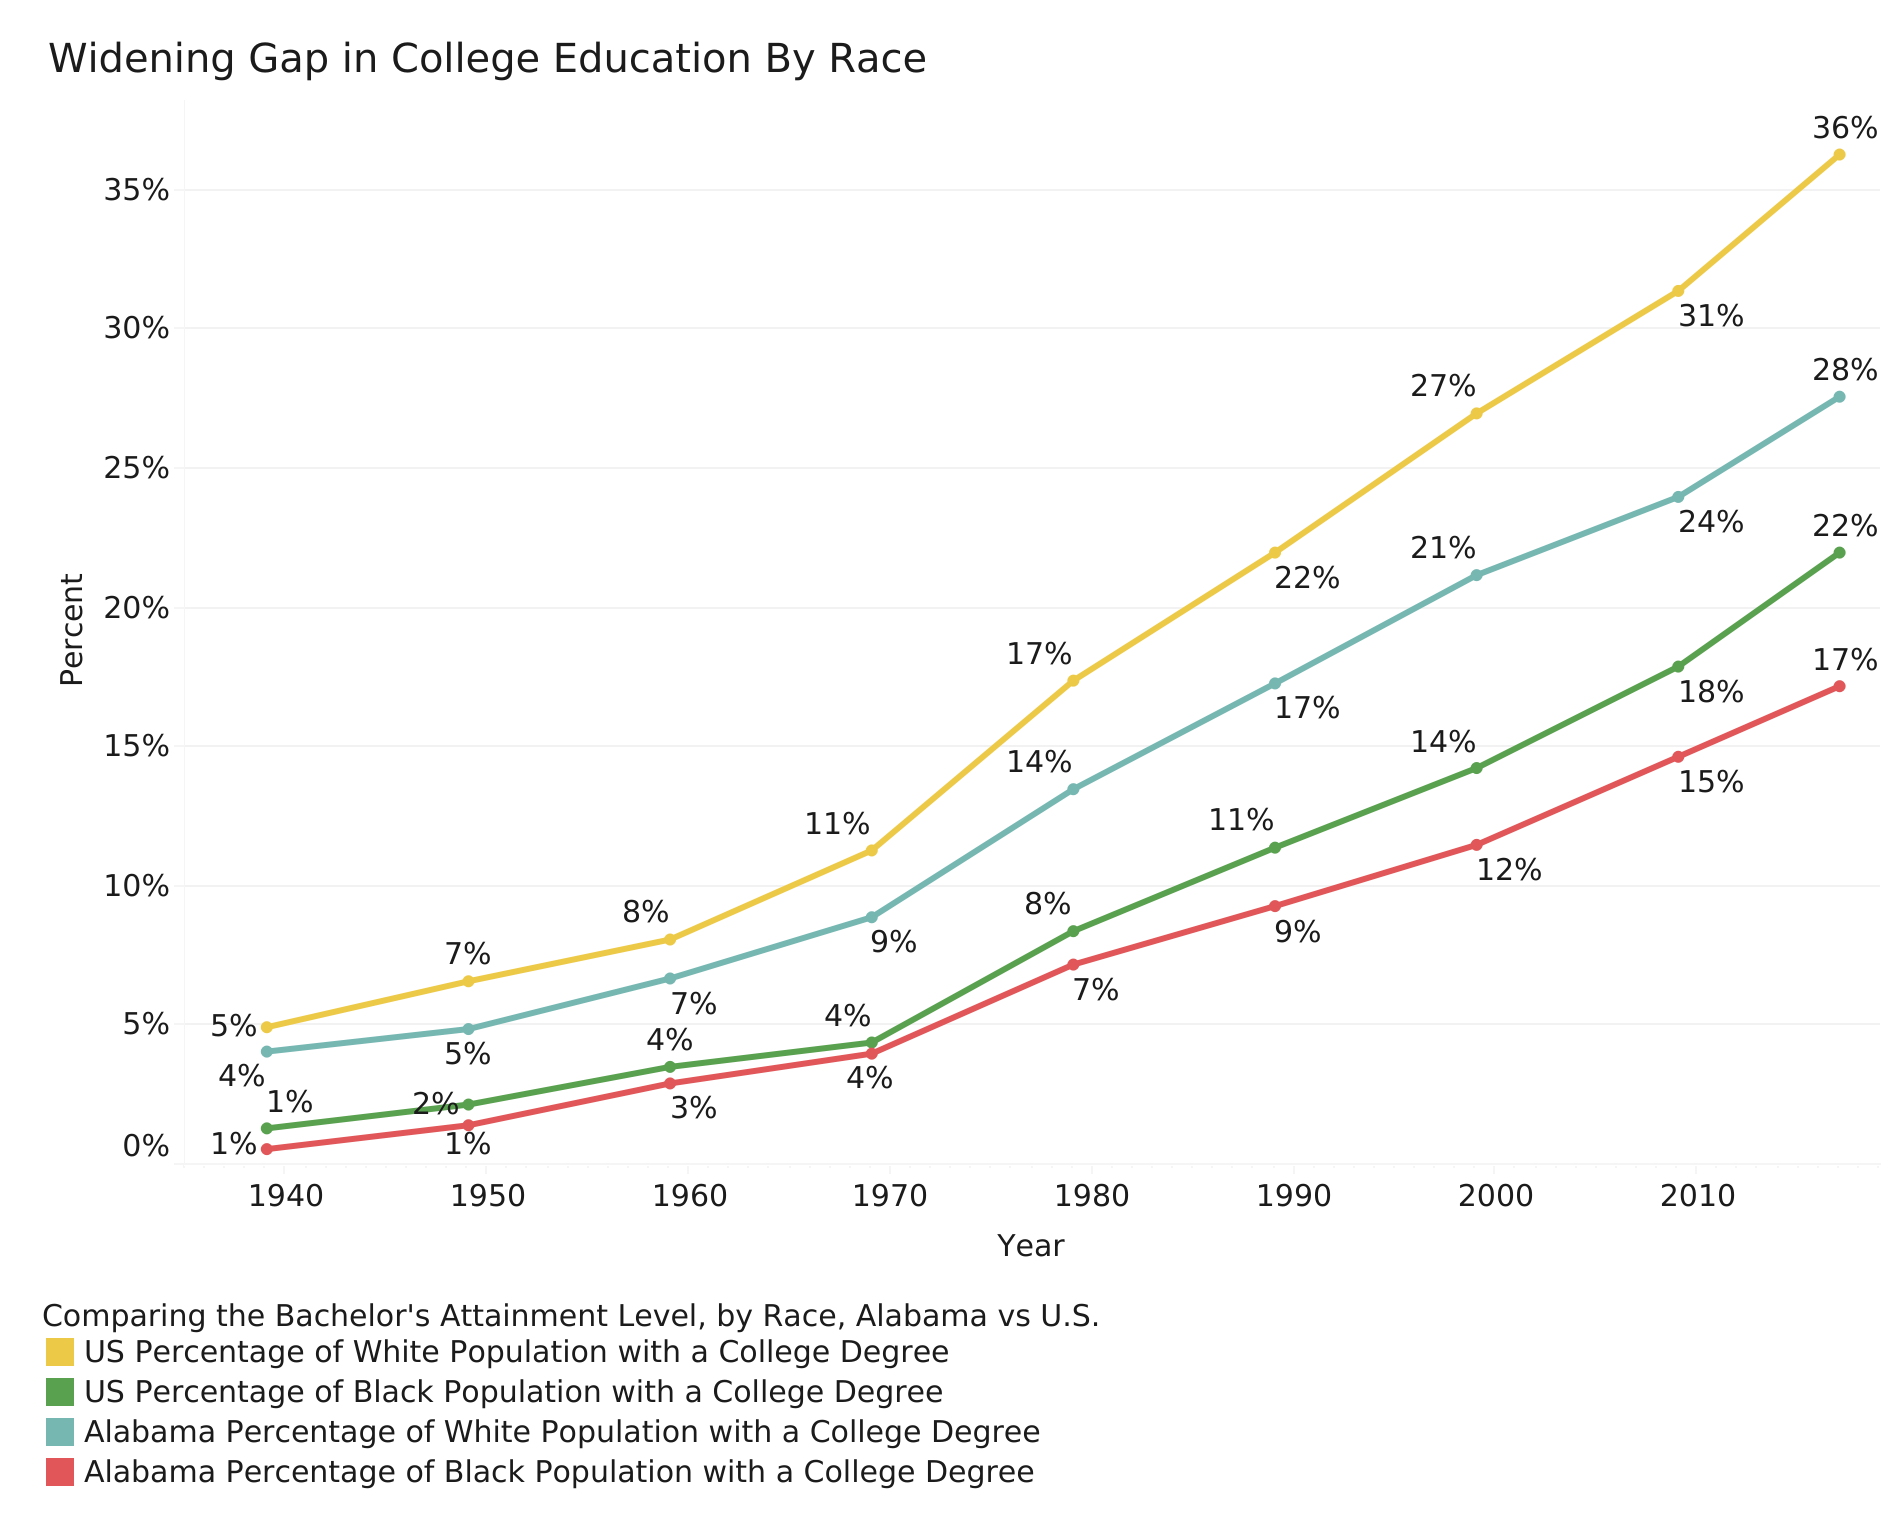
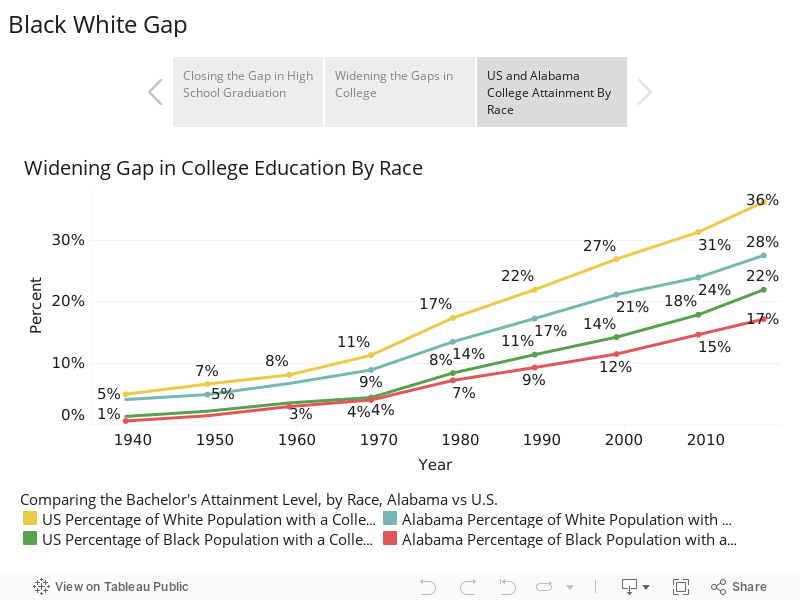
Alabama’s bachelor’s degree attainment trails the national average for both Blacks and whites. Among Alabama whites, 28% of adults have a bachelor’s degree or higher, compared to 36% of whites nationally. That’s a gap of 8 percentage points.
In Alabama, among Blacks, 17% of adults have a bachelor’s degree or higher, compared to 22% nationally. That’s a gap of five percentage points. Throughout this period, more students began enrolling and graduating from college. However, white students nationally and in Alabama seem to have been better positioned to take advantage of this major shift in higher education.
Nationally, the gap in bachelor’s attainment between whites and Blacks is 14 percentage points, compared to a gap of 11 percentage points in Alabama. For both races, the gap with the US average has widened between 2010 and 2018, according to the Census statistics. The percentage point growth in attainment was particularly slow for Alabama Blacks during the latest period, advancing only two percentage points.
These educational attainment measures are not solely attributable to the preparation levels and graduation rates from Alabama K-12 schools or colleges, though the performance of those schools has an effect. Also influencing the equation, particularly in terms of bachelor’s degree attainment, is where Alabama graduates move after college, which is often a function of where career opportunities are available, and the population and wages are growing. Data suggests that many of the states seeing rapid increases in the percentage of the population with bachelor’s degrees are drawing college-educated migrants from other states. Alabama research from the Alabama Commission on Higher Education also finds that the state exports college graduates.
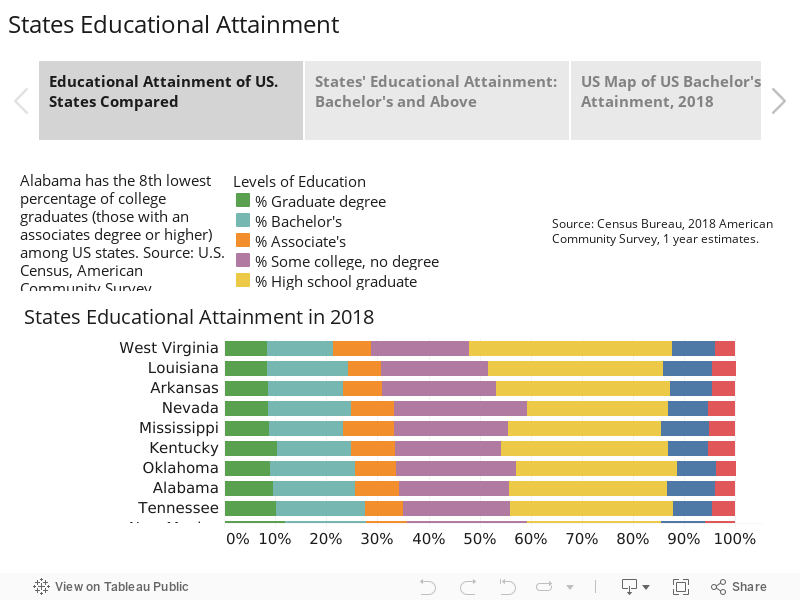
If you want a closer look at how the state’s compare on educational attainment, the visualizations below present a more detailed view. The charts break down the population into segments based on the percentage of the population in each educational category. An individual’s category is determined by his or her highest level of education. The percentage represents the number of people at that level each attainment divided by the total population 25 years and older. In this chart, the states are sorted by the percentage of the population with an associate degree or higher. Use the tabs to explore the states ranked by the percentage of the population with bachelor’s and graduate degrees or the states’ data displayed in an interactive map.
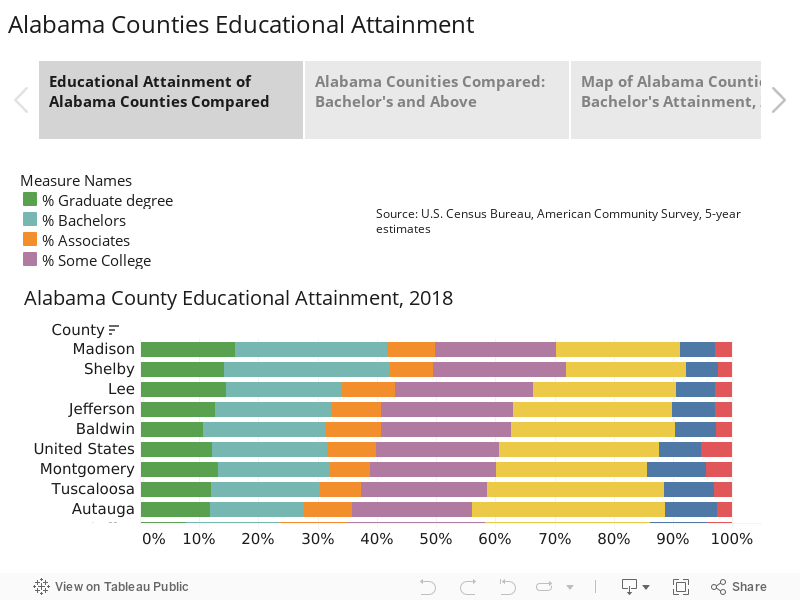
How Does Educational Attainment Compare within the State?
Overall, Alabama’s educational attainment rates may trail the rates of other states, but measures of attainment also vary widely within the state. Educational attainment, as measured by the percentage of the population with bachelor’s degrees or higher, exceeds the US average in five counties: Madison, Shelby, Lee, Jefferson, and Baldwin. Five additional counties exceed the Alabama average: Montgomery, Tuscaloosa, Autauga, Coffee, and Elmore Counties. Those top counties represent most of the major metro population centers plus the university towns. The exception is Coffee County which is home to Enterprise State Community College and includes the residences of many of the personnel, military and civilian, associated with Fort Rucker.
Within the top 20 are a few counties where educational attainment levels are higher than one might expect based on their rural character: Sumter, Pike, and Macon. On closer examination, all three have a university and a relatively small population. Macon County also has a large Veterans Administration Hospital. Pike County is home to some defense contractors and other manufacturing businesses that likely boost the county’s share of credentialed residents.
As in the national context, there is a relationship between education levels and income. In Alabama, the most predictive relationship can be found by comparing county per capita income and the percentage of the population with an associate degree or higher. In general, counties with higher levels of educational attainment have higher levels of income. Educated workers seek out locations where there are concentrations of higher-paying jobs. Higher-paying jobs generally require higher levels of education or training. Businesses seek out locations where there is an ample supply of educated residents so hiring will be easier. Higher incomes generate more business opportunities.
The quest to close the gap
For its first 150 years of statehood, Alabama intentionally operated separate and unequal schools for blacks and whites. And even for whites, the schools weren’t adequate to keep students on pace with the rest of the United States. Through the 1950s, Alabama’s population was predominately rural with an economy oriented to agriculture or blue-collar industry. Alabama’s primary recruiting tools were low taxes, low wages, and cheap land.
The lingering effects of this historic underinvestment in students become apparent in the period of record-low unemployment prior to the pandemic. Despite a booming economy and low unemployment, Alabama continued to have one of the lowest labor force participation rates in the U.S. Businesses struggled to find employees to meet the demands of more technologically advanced workplaces, while a disproportionate number of citizens, primarily those with lower levels of education, stayed stuck on the sidelines.
If Alabama is to reach its full economic potential, the state needs to continue to improve the equity, effectiveness, and efficiency of its educational delivery system. It needs to reach out to adults who need to advance their education. And it needs to retain the graduates its schools produce.
2019 ACT WorkKeys: Preparing Students for Work in a Time of Uncertainty
High school seniors and recent graduates are preparing to enter a workforce that has been disrupted, hopefully only temporarily. In a matter of weeks, the nation has gone from record low unemployment to levels not seen since the Depression. Employers are adapting to a new set of work conditions and the demand for new skills appropriate for remote work is rapidly rising.
The WorkKeys Assessment may now be more valuable than ever in helping employers assess the practical skills and adaptability of potential hires.
WorkKeys Assessments in Alabama
WorkKeys is a standardized test given to 12th graders in Alabama public schools. The assessment is meant to measure skills relevant to many of today’s work environments. This is a test that generates positive results in Alabama with steady progress.
WorkKeys is one of the measures through which a student can be designated as College and Career Ready in the state. They may not have the specialized training needed for particular occupations, but if a student earns a certification at the higher levels, the measure should increase the confidence of employers in hiring staff who are adept at applying useful cognitive skills and knowledge to applied work tasks in contemporary work settings.
The Assessments. The assessments consist of three tests of applied cognitive skills which are relevant, according to ACT’s research, to over 20,000 occupations:
The Applied Math test
The Graphic Literacy test
The Workplace Documentstest (applied reading for understanding)
Students are awarded a National Career Readiness Certification if they score a Platinum, Gold, Silver, or Bronze score on the WorkKeys. Platinum is the highest level, followed by Gold, Silver and Bronze.
After modifications to the 2018 assessment created significant fluctuation among the different certificate levels, the results in 2019 showed steady gains in the Platinum and Silver levels, and slight decreases in the percent of students earning Gold and Bronze certificates, as well as the percent of students not receiving any certificate.
In Alabama students earning a Silver certificate or above are considered career ready.
Highlights of the WorkKeys test results for the Class of 2019 include:
66% of Alabama high school graduates were deemed workforce ready as measured by the ACT WorkKeys assessment, an improvement over 64 % in 2018.
At 94%, Hartselle had the highest percentage of workforce-ready graduates, as measured by WorkKeys.
The Silver Certificate continues to be the level with the highest percentage of students.
WorkKeys is emerging as another source of information for making employment decisions and helping prospective workers learn about strengths and weaknesses and opportunities for growth. Using job profiling data provided by ACT, the Alabama Department of Labor maintains data listing the median WorkKeys scores for high demand occupations requiring an associate’s degree or less.
2019 Assessment Results
The following charts show the percentage of graduates in Alabama who demonstrated workforce readiness on WorkKeys assessments.
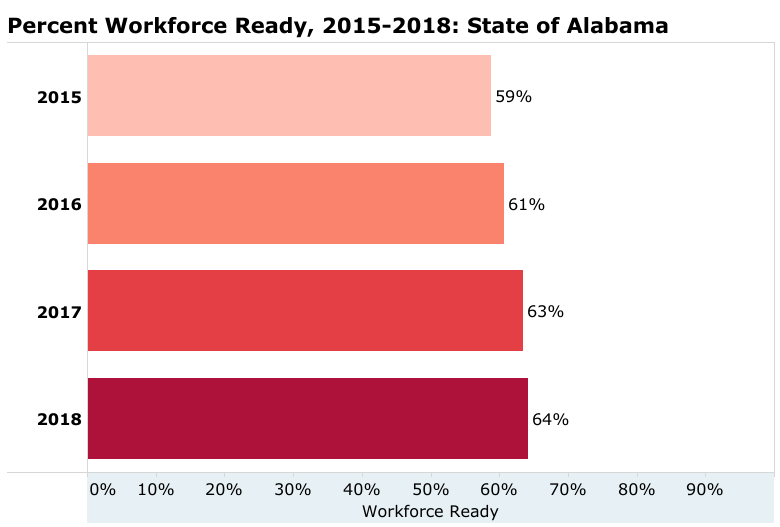
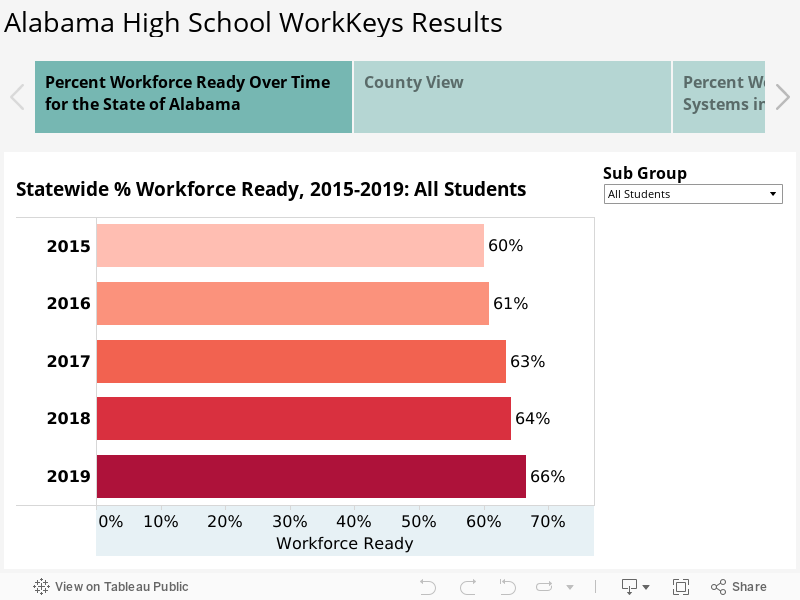
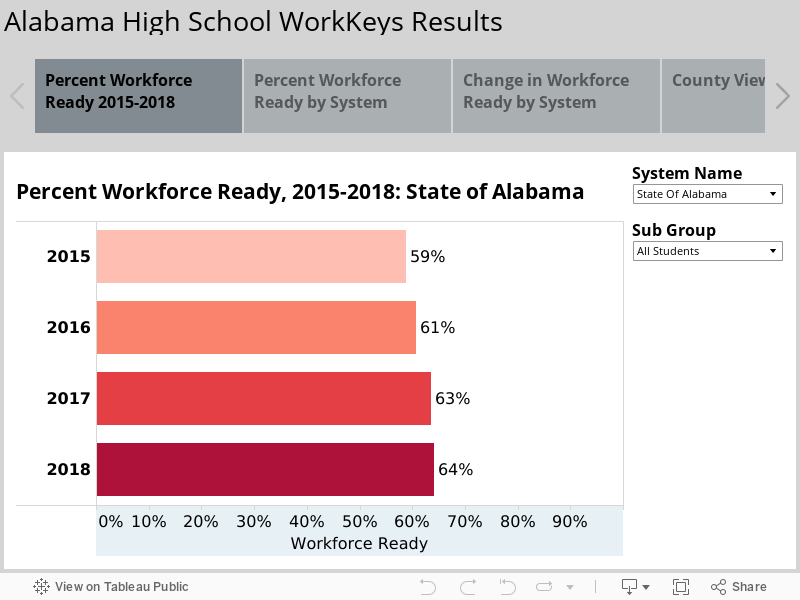
Percent Workforce Ready Increased in 2019.
In 2019, 66% of high school graduates taking the assessment were deemed workforce ready. This percent has steadily increased since 2015.
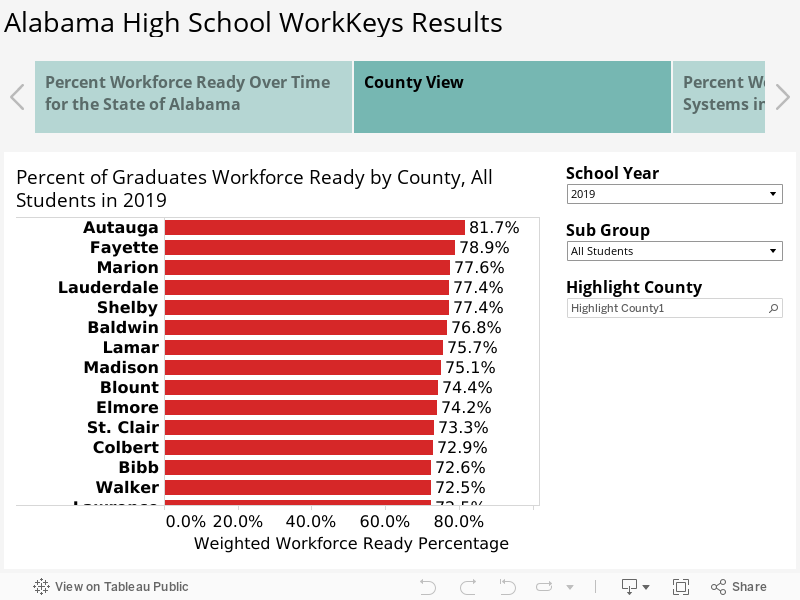
Workforce Ready at the Local Level
The following charts focus on workforce readiness among graduates at the local level. A county view is appropriate when thinking about the quality of a local workforce.
Of course, local school systems and schools are the places where students develop knowledge and skills related to work readiness.
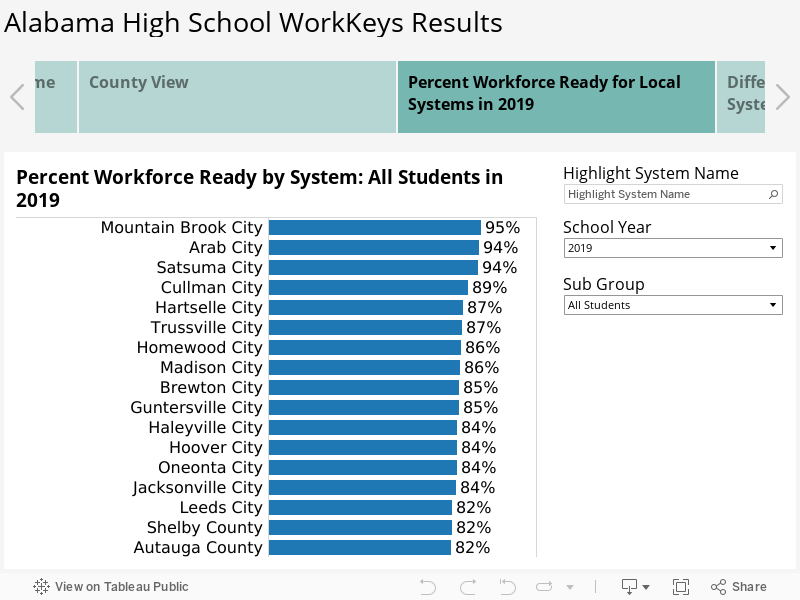
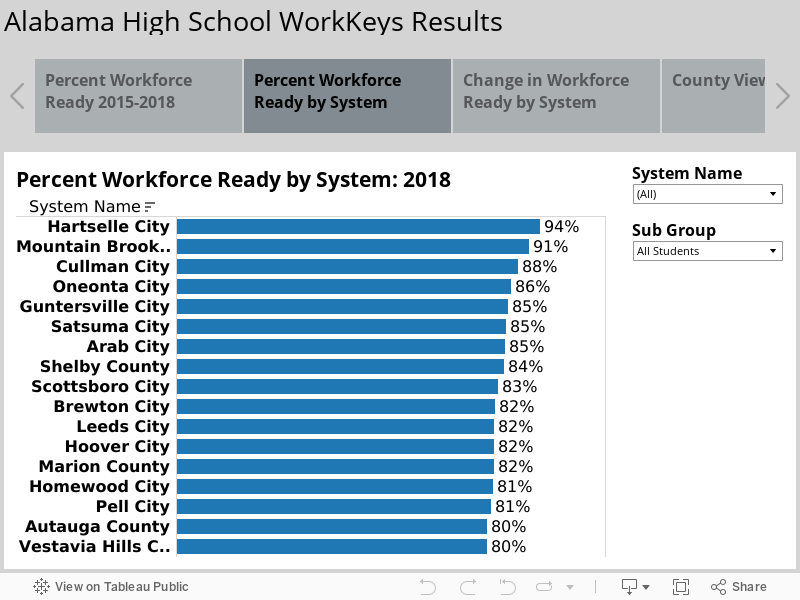
Listed below are the top ranked systems based on workforce readiness assessed through WorkKeys:
Mountain Brook City – 95%
Arab City – 94%
Satsuma City – 94%
Cullman City – 89%
Hartselle City – 87%
Trussville City – 87%
Homewood City – 86%
Madison City – 86%
Brewton City – 85%
Guntersville City – 85%
Mountain Brook has made positive gains over the past two years and appears to remain committed to WorkKeys as a valuable assessment.
With committed effort, WorkKeys is an assessment where systems can show growth, as demonstrated by a variety of systems and schools in Alabama.
A number of large and medium-sized systems made noteworthy gains over 2018. Auburn City topped all, showing remarkable gain (up by 24 percentage points).
Among the schools, Loveless Academy continued its top ranking with 100% of students deemed workforce ready. Top schools include:
Loveless Academic Magnet High School, Montgomery County – 100%
New Century Technology Magnet High School, Huntsville City – 95%
Mountain Brook High school – 95%
Brewbaker Technology Magnet High School, Montgomery County – 94%
Arab City High School – 94%
Ramsay High School, Birmingham City Schools – 94%
Satsuma High School, Satsuma City Schools – 94%
A number of large and moderate sized high schools experienced positive gain over 2018. This is an area of growth for a number of schools failing to show gains in more purely academic assessments.
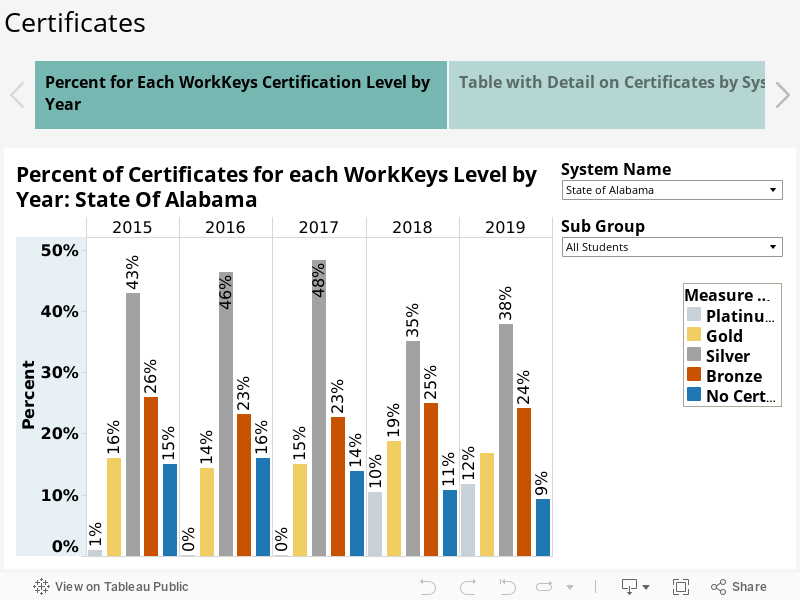
Change in Certificate Levels
Students are deemed workforce ready if they achieve certification at the Platinum, Gold, or Silver levels. The charts show that the percentage of students at the Gold and Silver levels increased moderately from 2015 through 2017, with Platinum barely making a dent. After modifications to one of the tests in 2018, Gold and Platinum level certificates grew substantially, while Silver certificates dropped significantly. The percent at each level in 2019 is comparable to 2018, but with positive gains in Platinum and Silver. The percent of students at the lowest level, with no certificate, continues to drop.
Overall, this resulted in a higher percent workforce ready for the state, with a positive trend toward higher certification levels.
Change in Certificate Levels at the System Level
Platinum: Mountain Brook and Homewood City finished in a tie with the highest percent of Platinums, followed by Madison City, Hoover, Hartselle and Arab City. Aburn City climbed up in 2019 to join these state leaders.
Gold: Oneonta, Arab, and Mountain Brook are the systems with the highest percentage Gold. Though the majority of systems decreased at the Gold level, a number of systems increased their percentage. Leading the way in percentage point gain was Chickasaw City and Jacksonville City, followed by Piedmont City and Talladega County. Arab City continues to show nice gains as well.
Silver: This is the minimum level to be counted as workready. A number of less affluent systems are among the leading systems for Silver certificates. Systems with the highest percentage at this level include Opp City, Satsuma City, Haleyville City, and Lamar County. The vast majority of systems increased in the percentage of students earning Silver certificates in 2019, led by Opp City.
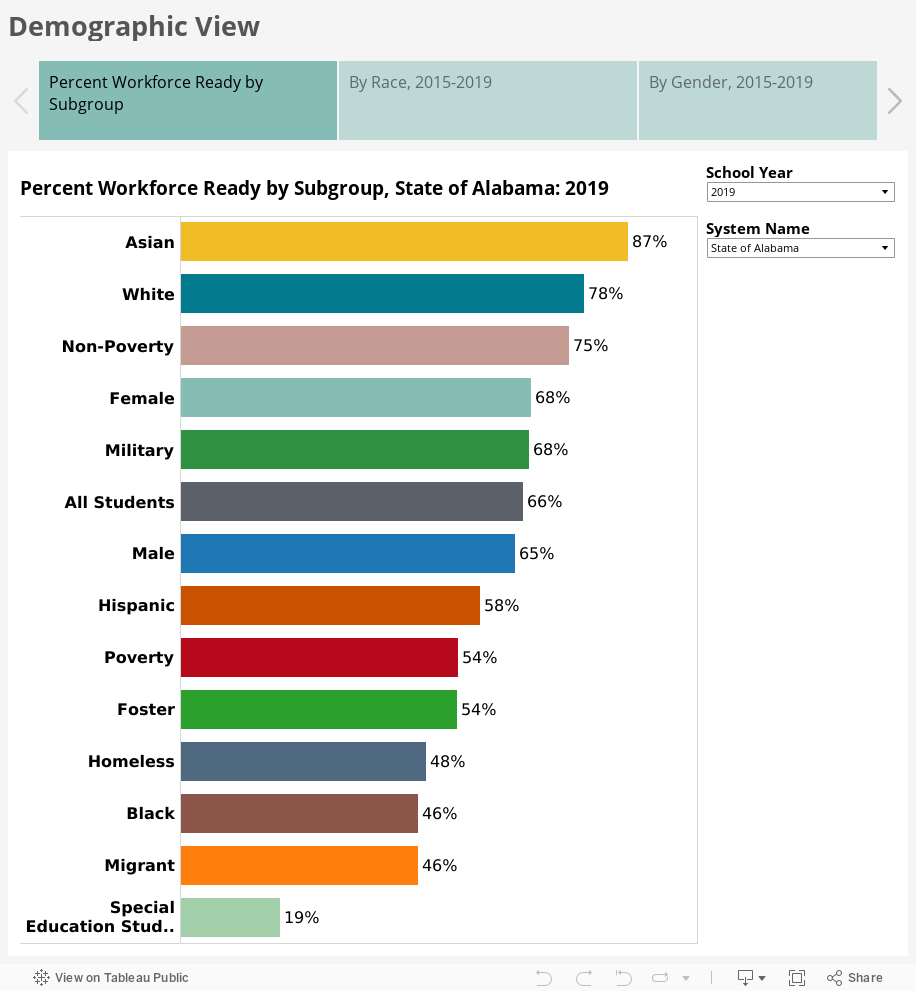
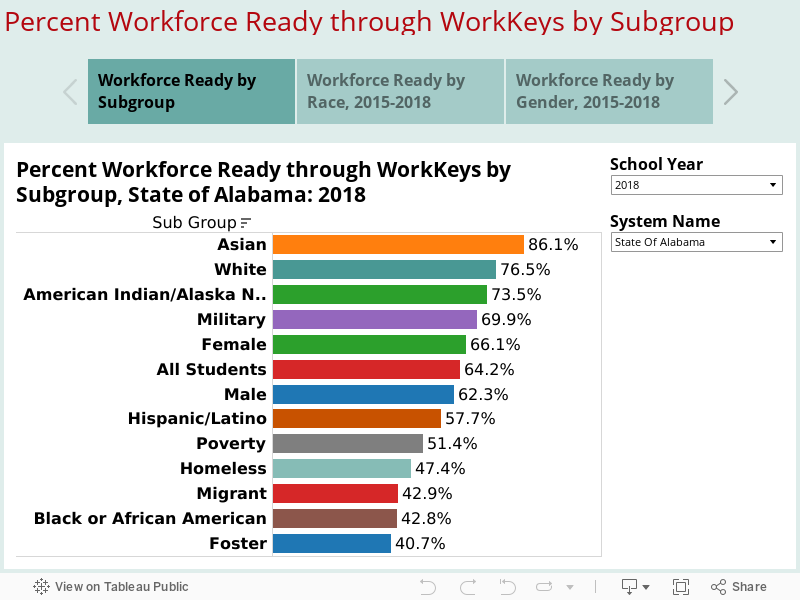
Subgroup Analysis
Analysis of subgroup results shows a continuing disparity between subgroups. Use the filters to see how systems differ in subgroup performance. Some schools may be better at assisting struggling groups than others.
The highest performing groups include students who are Asian, white, non-poverty, female, and military-affiliated. The lowest-performing groups are black, migrant, and special education. While all of the racial groups are increasing their percentage of workforce ready, black students have made the most gain since 2015.
Females continue to outperform male students, though both have shown comparable positive growth since 2015.
In looking at trends, all racial groups are showing progress from year to year, especially Asian and black students.
Finally, special populations are also showing positive growth in workforce readiness, especially students qualifying for free lunch (poverty) and students living in foster homes.
Discussion
The 2020 report, Education Matters, written by PARCA on behalf of the Business Education Alliance, recommends increasing the awareness of WorkKeys as a valuable tool for employers, communities, and schools.
In addition to the assessments, WorkKeys provides a full suite of resources that can help provide training for teachers, test preparation for students, and design career-related curricula to help students improve their “hard” and “soft” skill levels. ACT Career Ready 101 is designed to help teachers bring work readiness skills into the classroom. This raises questions about how students become workforce ready in school. Beyond special resources for preparation, is the curriculum and content delivered in schools changing to strengthen career readiness, even in traditional academic subjects?
The long-term future of WorkKeys will be determined by the continuing value educators give to these assessments and suite of resources, and the degree to which employers value WorkKeys. A growing number of communities and employers are aware of the utility of WorkKeys, but this still varies across the state. Currently, schools also vary in the degree to which they emphasize WorkKeys.
ACT WorkKeys – An Assessment of Workforce Readiness Among High School Graduates in Alabama
The WorkKeys Assessment is a standardized test given to 12th graders in Alabama public schools. The assessment is meant to measure skills relevant to many of today’s work environments.
In 2018:
64 percent of Alabama high school graduates in 2018 were deemed workforce ready as measured by the ACT WorkKeys assessment, a year over year improvement of a half percent.
At 94 percent, Hartselle had the highest percentage of workforce ready graduates, as measured by WorkKeys.
High fluctuations occurred among the different certificate levels, with Platinum (highest level) and Gold dramatically increasing, but Silver decreasing. Bronze (below workforce ready) increased, though the percent not earning a certificate decreased.
What is WorkKeys?
The WorkKeys assessments are meant to provide a meaningful assessment of applied cognitive skills useful in contemporary work settings. It is also one of the components of Alabama’s College and Career Ready measure.
The assessments do not measure a student’s attitudes about work, dependability, interpersonal skills, teamwork, communication skills, or instincts for creativity, innovation, or leadership. They also do not provide insight about a student’s competency for a job requiring specialized knowledge and skills.
The Assessments. The assessments consist of three tests of applied cognitive skills which are relevant, according to ACT’s research, to over 20,000 occupations:
The Applied Math test measures critical thinking, mathematical reasoning, and problem-solving techniques for situations in today’s workplace.
The Graphic Literacy test measures the skill needed to locate, synthesize, and use information from charts and graphs.
The Workplace Documentstest measures the skills needed to read and understand written text such as memos, letters, directions, signs, notices, bulletins, policies, and regulations on the job.
Students are awarded a National Career Readiness Certification in they score a Platinum, Gold, Silver, or Bronze score on the WorkKeys.
Platinum: These are students with the highest level of applied cognitive skills. According to ACT, students at this level have demonstrated applied foundational skills for 96 percent of the occupations in the ACT jobs dataset.
Gold: Those earning a Gold level certificate should have the applied foundational skills for 90 percent of jobs in the database.
Silver: Students scoring at the Silver level should have the applied foundational skills for 71 percent of jobs in the ACT database.
Bronze: Students earning a Bronze certificate are judged to be ready for 16 percent of jobs.
In Alabama students earning a Silver certificate or above are considered career ready.
2018 Assessment Results
The following charts show the percent of graduates in Alabama who demonstrated workforce readiness on WorkKeys assessments at the state, local system, and school level.
Percent Workforce Ready Remained the Same. The first chart shows that in 2018 64 percent of high school graduates in the state were deemed workforce ready as measured by WorkKeys. The percent steadily increased from 58.8 percent in 2015 to 60.8 percent in 2016 and 63.5 percent in 2017. The increase from 2017 to 2018 was comparatively small, with both years rounding at 64 percent workforce ready.
Workforce Ready at the System Level
Listed below are the top ranked systems based on workforce readiness assessed through WorkKeys:
Hartselle City – 94 percent of students
Mountain Brook – 91 percent of students
Cullman – 88 percent of students
Oneonta – 86 percent of students
Guntersville -85 percent of students
There does appear to be some correlation between performance on the WorkKeys and the ACT exam, but not an exact one-to-one match. For example, some systems achieved a comparable state ranking on both sets of assessments:
Mountain Brook was number 1 on the ACT and 2 on WorkKeys
Shelby County was 8th on the ACT and 8th on WorkKeys.
However, other systems saw a larger separation.
Vestavia Hills was 2nd on the ACT and 16th on WorkKeys.
Madison City ranked 4th on the ACT and 18th on WorkKeys.
Trussville was 6 and 25, respectively.
All of the systems in the top 10 on the ACT are in the top 25 on WorkKeys, except Auburn.
At the same time, a number of less affluent systems demonstrated progress on the WorkKeys assessment over the previous year. Those systems showing the most improvement over 2017 included:
Perry County – 28 percent increase
Elba – 27 percent increase
Alexander City – 25 percent increase
Thomasville – 21 percent increase
Sheffield – 18 percent increase
Change in Certificate Levels
Significant Growth in Platinum and Gold Certificates. Students are deemed workforce ready if they achieve certification at the Platinum, Gold, or Silver levels. The charts show that the percent at each of these levels from 2015 through 2017 increased moderately each year and the distribution of students across the different levels remained about the same. However, ACT’s decision to change one of the tests for a new one apparently led to dramatic changes in the scoring of the WorkKeys test, producing far more Gold and Platinum level certificates:
Platinum certificates dramatically increased from essentially zero percent all three previous years to 10 percent of students in 2018.
Gold certificates, remaining fairly stable around 15 percent in the previous three years also showed a more significant increase to 19 percent in 2018.
Silver certificates dropped to 35 percent in 2018 after increasing to from 43 percent in 2015 to 48 percent in 2017.
Overall, this resulted in roughly the same percent workforce ready, but with a positive trend toward higher certification levels. Furthermore, while the percent of Bronze certificates increased, the percent with no certificate decreased. This is a positive trend with more students edging toward the readiness threshold.
Change in Certificate Levels at the System Level
Platinum: None of the systems decreased at the Platinum level. While a fair number showed no growth, the vast majority increased. In 2017,Sheffield generated the highest percent of Platinum level students of any system in the state at only two percent of its students. All other systems were at zero or one percent. In 2018, Mountain Brook increased from one percent to 41 percent, followed by Homewood, which increased from one percent to 29 percent. Each of the remaining schools in the 2018 top ten increased from one percent or less to 20-29 percent. Sheffield increased from two to 11 percent.
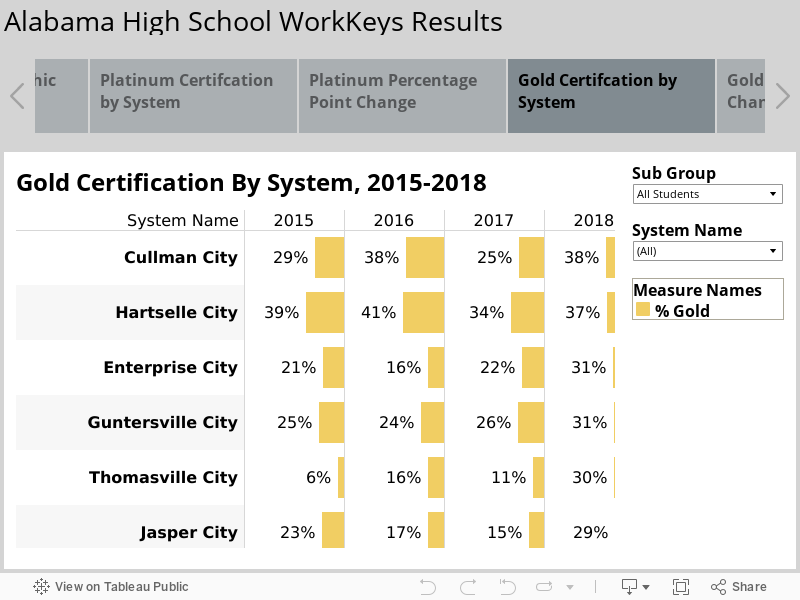
Gold: Cullman generated the highest percentage of Gold Certificates, followed by Hartselle. The percentage receiving Gold increased for most systems, though not at the level of change experienced for Platinum. Fourteen systems generated fewer Gold Certificates in 2018, including some of the top academic systems. Supposedly more of their high performing students moved into the Platinum level. Statewide, Thomasville generated the highest increase in Gold Certificates, moving them into the top five in overall state rankings.
Silver: Finally, most systems decreased in the percentage of students receiving Silver Certificates, the threshold for being considered workforce ready. The highest gains were in Perry County and Elba. The highest decreases were in Mountain Brook, Jasper, Cullman, Marion County, and Brewton. Rounding this out, the percent of students receiving Bronze Certificates increased in the majority of systems, while the majority of systems have a lower percentage of students who did not receive a certificate.
Possible Causes for the Change
A variety of explanations can be considered for the changes in WorkKeys results:
Changes in the WorkKeys assessments;
Stronger alignment between WorkKeys teacher training, test preparation, and test questions; and
Stronger concerted efforts in schools to prepare students for the assessments.
In 2018 WorkKeys underwent a number of changes, though the only test section that involved significant content change was the Locating Information test, which is now called Graphic Literacy. The names used for the other two assessments were changed to their current titles, Applied Math and Workplace Documents, though apparently no significant content changes occurred in these assessments.
Changes in an assessment often lead to scoring changes and other issues that can affect results. The new Graphic Literacy test may account for the leap in higher certificates at the Platinum and Gold levels, but the new test is supposed to be more rigorous. While higher rigor would usually not be associated with higher scores, higher relevance in an improved test could produce better scores.
Aligned with the changes in the actual assessments are changes in teacher training and student prep tools, including practice exams. These are potentially a better fit with the formal assessments being rolled out than was available in preparation for the prior assessment.
More systems may also be using the ACT WorkKeys Curriculum, which is aligned with the WorkKeys assessments. The courses are delivered through a mobile-based learning management system. It provides students and teachers with a customized study schedule and detailed instructional content. While the curriculum can improve test performance, it is primarily designed to develop workplace-ready skills in students.
Subgroup Analysis
Analysis of WorkKeys results for student subgroup performance shows continuing disparity between subgroups. Use the filters to see how systems differ in subgroup performance. Some schools may be better at assisting struggling groups than others.
In looking at trends, all racial groups are showing progress from year to year, especially Asians, Native Americans, and black students. The gap between Asian students and all other races is growing. The gap between white and Hispanic students is also growing, while the gap between white and black students has remained about the same – but not closing. Black students are gradually closing the gap with Hispanic students.
College and Career Readiness in Alabama
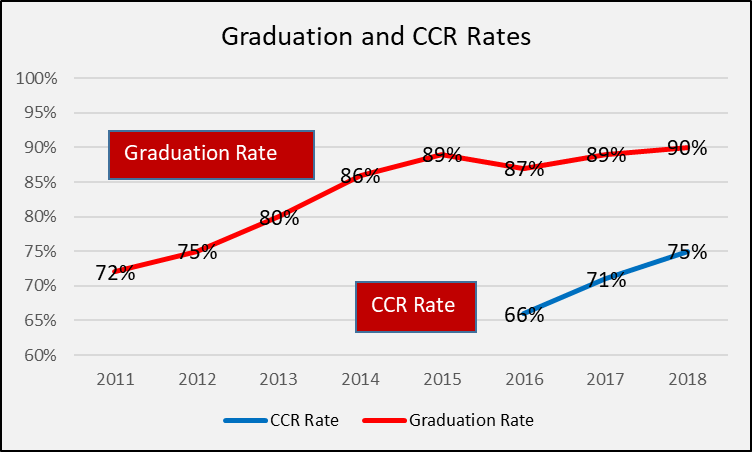
In 2012, the Alabama State Board of Education adopted Plan 2020, which embraced a vision for the state education system led by the motto: “Every child a graduate. Every graduate prepared.” The plan called for raising Alabama’s high school graduation rate to 90 percent, while at the same time producing graduates who are better prepared for college and the workplace. Since that time, significant progress occurred in raising the graduation rate from 72 percent in 2011 to 90 percent in 2018.
While the high graduation rate is laudable, state education leaders have raised concerns about the gap between the percent graduating and the percent prepared for college or work. The other half of the motto — “Every graduate prepared” — came under question.
The following chart shows Alabama high schools are closing the gap between the percentage of students graduating and the percentage of seniors demonstrating they are ready for college and the workforce.
According to yet-to-be finalized data from the Alabama State Department of Education, significant progress has been made over the past three years. Final and complete data are expected to be published later this year:
In 2016, Alabama graduated 87 percent of its students, though only 66 percent were college and career ready.
In 2017, the gap closed, with 89 percent graduating and 71 percent college and career ready.
In 2018, improvement continued with 90 percent graduating and 75 percent college and career ready.
Though the gap is still large, it is improving.
Continuing to close that gap is vital. The state has a goal of adding 500,000 highly-skilled workers to the workforce by 2025. To meet that goal, virtually all high school graduates will need to be prepared for education beyond high school or prepared to enter the workforce directly after high school.
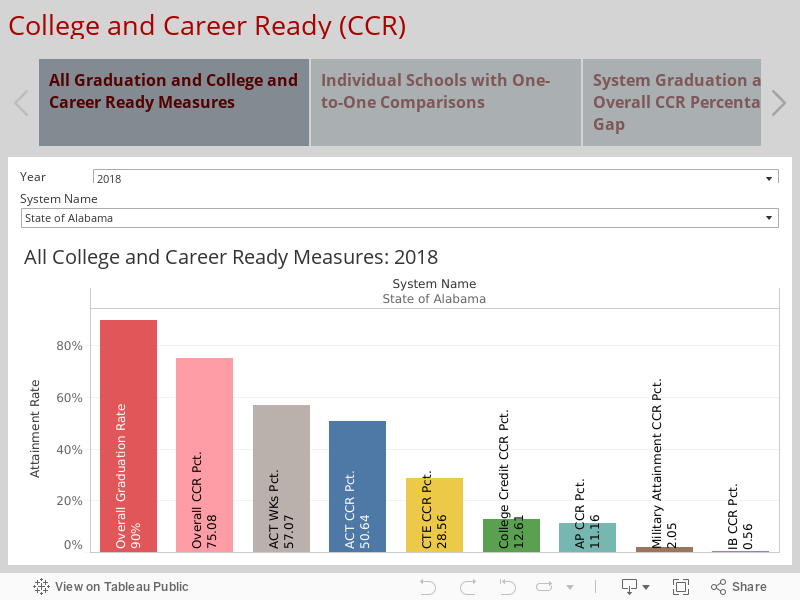
The 2018 CCR data shows:
Career Technical Education (CTE) certificates are the fastest-growing means for classifying students as college and career ready.
Qualifying scores on the ACT and WorkKeys assessments are the two most common measures used to classify students as college and career ready.
Systems and schools leverage different strategies for preparing students – reflecting varying strengths, resources, and goals for education.
Some systems are very strong in particular areas and weak in others, which may not meet the needs of all students.
Disparities in performance exist across schools and student subgroups that may go beyond poverty.
Alabama’s College and Career Readiness Measure
The Alabama College and Career Strategic Plan (a component of Plan 2020) articulated a vision in which all Alabama students graduate high school college and career ready. The plan defines college and career readiness as:
“…a high school graduate [that] has the English and mathematics knowledge and skills necessary to either (1) qualify for and succeed in entry-level, credit-bearing college courses without the need for remedial coursework, or (2) qualify for and succeed in the postsecondary job training and/or education necessary for their chosen career (i.e. technical/vocational program, community college, apprenticeship or significant on-the-job training).”
High school graduates are classified as college and career ready (CCR) if they meet at least one of the following criteria.
Score college ready in at least one subject on the ACT
Score at the silver level or above on the WorkKeys Assessment
Earn a passing score on an Advanced Placement or International Baccalaureate Exam (college-level courses delivered in high schools)
Successfully earn a Career Technical Education credential
Earn dual enrollment credit at a college or university
Successfully enlist in the military
Some of these measures are more aligned with college preparation and others with career preparation.
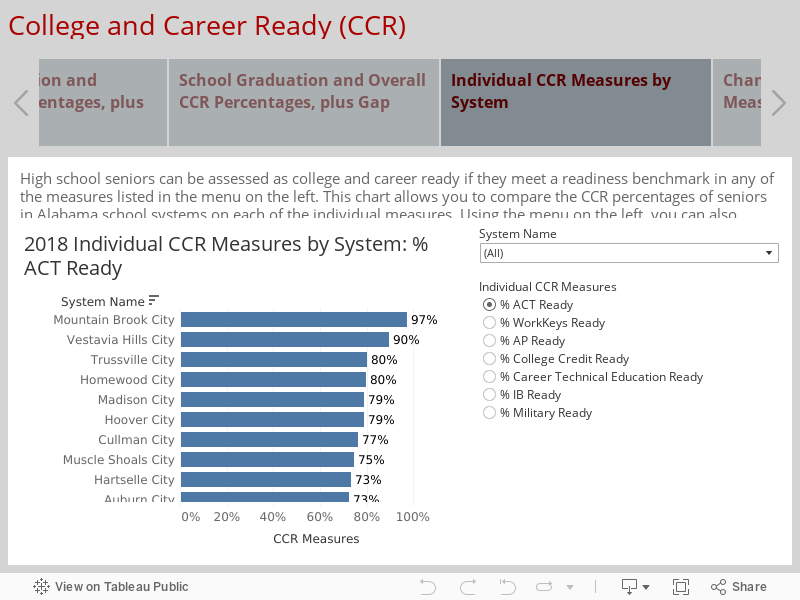
The state now provides data on the overall CCR rate and data on the individual metrics that create the measure. Detailed analysis is found in the interactive charts below, which allow users to explore college and career readiness percentages for high school seniors in 2018 at the state, school system, and high school level.
Graduation and CCR Rates
The first chart shows the percentage of students graduating, followed by the percentage of seniors who are college and career ready, followed by the percentage achieving readiness on the various performance measures that compose the CCR rate. While preset for the state in 2018, the filters can be used to produce the same chart for individual school systems in 2017.
Statewide, the percentage of seniors testing “ready” is highest for the WorkKeys assessment, followed closely by ACT. Those are the two main channels through which a CCR rating is achieved, though a growing number of students are deemed CCR by earning a credential in a Career Technical Education (CTE) field. Earning college credit or a qualifying score on an AP exam are also used by a smaller percentage of students. A very low percentage of seniors achieve a CCR rating by getting a passing score on an International Baccalaureate exam or successfully enlisting in the military. Exploring these measures at the system and school level suggests the use of different strategies across school systems reflects different goals for education, local needs and strengths, and characteristics of the community.
Graduation – CCR Gapby Local System
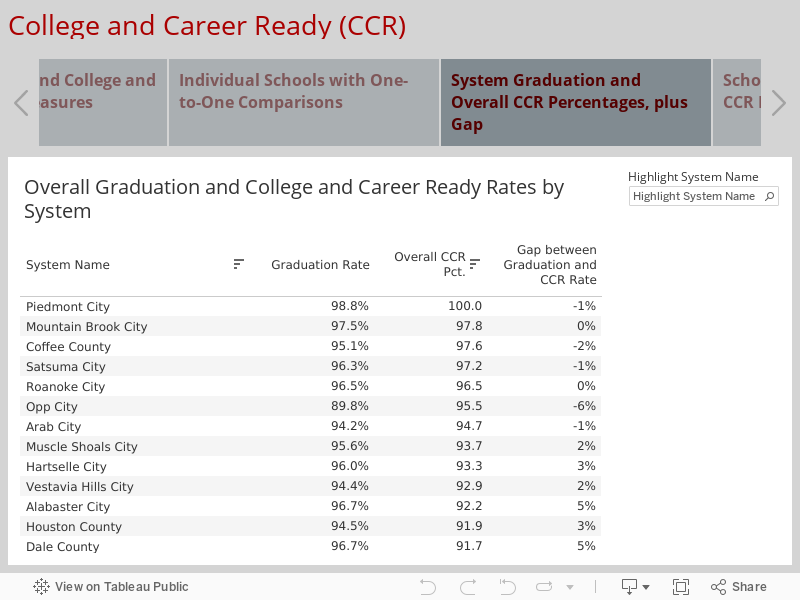
Chart 2 shows the graduation rate, CCR rate, and gap between these two rates in each system. They are listed in the order of CCR rate from highest to lowest. The Piedmont City School System is No. 1 in the state for CCR — the only system where 100 percent of seniors are classified as college and career ready. The system also graduates close to 100 percent of its students.
Some systems actually have negative gaps where the percent of seniors who are college and career ready exceeds the percent who graduate after four years in high school. This includes the Coffee County System, and city systems in Opp, Arab, Satsuma, and Piedmont.
On the other end of the spectrum, systems with the lowest CCR rates tend to have the highest gaps between graduation and CCR rates, though not always.
Graduation – CCR Gap by School
Individual schools are showing similar trends, with wide disparity between high and low performing schools.
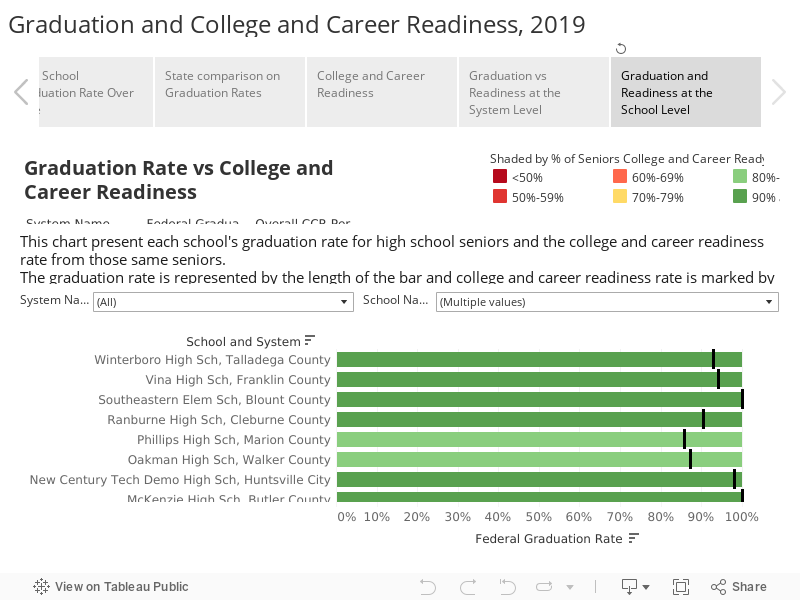
Keith Middle-High School in Dallas County graduates 90 percent of its students, matching the state average, but only 19 percent of its seniors are measured to be college and career ready.
Barbour County High School graduates 77 percent of its students, but only 12.5 percent of seniors are measured as college and career ready.
Having both high graduation rates and CCR rates indicates that the diplomas issued by those schools have credibility and value. Where graduation rates are high but CCR rates are low, there is cause for concern.
Individual Components of CCRby System and School
The remaining charts in this section display individual components of college and career readiness by system and school. The final chart shows the percent change in CCR rates from 2017 to 2018.
Overall for the state, the largest change occurred in the percent of students earning career technical education credentials, increasing from 22 to 29 percent. The state and individual systems have put an increased focus on providing career-related coursework in high school, and the increases here may reflect that emphasis. At the same time, it is important for policy-makers to monitor what career credentials students are earning. For this to be a meaningful measure of career readiness, those credentials need to be recognized and valued by employers and should be in a field in which a student is likely to obtain workor more advanced training.
Other increases occurred in students earning college credit (10% to 13%), and in WorkKeys readiness (55% to 57%).
As cited earlier, when looking at individual systems and schools, it becomes apparent that different places achieve college and career readiness through different strategies.
Mountain Brook is No. 1 in ACT, WorkKeys, and AP, but lower on college credit and career technical credentials.
Vestavia is second on ACT readiness, among the top schools on the AP exam, and in the top 25 percent in career technical credentials, but much lower on WorkKeys and dual enrollment.
Opp City exceeds the state average on all measures of CCR but is especially high-achieving in students earning college credit, where they are No. 1 in the state, and in career technical credentials, where they are No. 5.
The system with the highest CCR rating, Piedmont City Schools, is at the state average on ACT and WorkKeys, but far and above other systems in credentials.
Are schools meeting the needs of all students? One concern this analysis raises is that some systems may not be meeting the varying needs of all students. Those systems scoring high or at least moderately high on a balance of college and career measures are providing a breadth of services that can help students shine where they show interest and potential. The lack of balance in some systems or schools may reflect an intentional emphasis on what they value most: college preparation or career readiness. It is important for schools to assess whether they are providing options that fit the needs and interests of the diverse array of students they serve.
Conclusion
As a composite of various academic and career indicators, Alabama’s College and Career Ready metric reflects three important concepts.
Every student needs either a post-secondary education or credible career-focused training in high school.
Post-secondary education need not be a traditional four-year college degree.
There are many different pathways for students.
The gap between Alabama’s graduation rate and the number of graduates deemed college and career ready has been a concern, but one with optimism given progress in closing that gap.
Career Technical Education certificates are the fastest-growing measure through which students are earning the CCR marker. These credentialing programs are meant to prepare students for workforce opportunities in high-demand fields right out of high school. They combine academics with work-based learning as a strategy to address the widening gap between job applicants’ skills and the skills employers need. The state will need to continuously ensure that all courses and concentrations are of high quality and relevant to the workforce needs in the state and in local communities.
Beyond preparing students with skills for specific jobs, an array of academic, extracurricular, and work-based learning opportunities can develop the student as a whole person capable of thoughtful decision-making and meet the unique needs and preferences of each student. Academics, career training, life skills, and the cultivation of passions and interests can all come together to support college, career, and life readiness.
Alabama is assessing progress on part of this, but not all. The state has made a good faith effort to evaluate college and career readiness through a variety of measures such as the ACT, college dual enrollment, WorkKeys, and Career and Technical Education (CTE) certification. Still, this is a changing and growing field. Skills and attributes needed in various careers are continually changing. Alabama should remain alert to more rigorous and authentic measures of college and career readiness that may emerge.
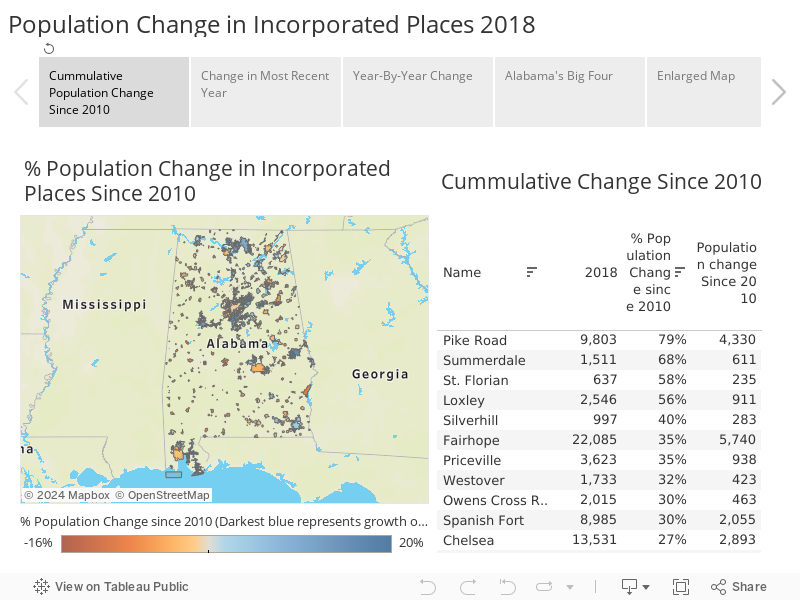
Population Change in Alabama Cities 2018
Huntsville continues its trajectory towards becoming Alabama’s largest city, while Birmingham, Montgomery, and Mobile continue to drift lower, according to the most recent city population estimates released by The Census Bureau. The two major college towns Auburn and Tuscaloosa continue to grow, as do several cities in Baldwin County.
The new estimates cover the time period between July 1, 2017, and July 1, 2018, and also look back to 2010, the year of the last official Census. Data from the same time period has already been released for state level, metro areas, and counties, and PARCA has published analyses and interactive tools exploring that data. The new cities data is below. Use zoom and drag tools to explore a particular area. Use the button in the bottom right corner if you want a full-screen display.
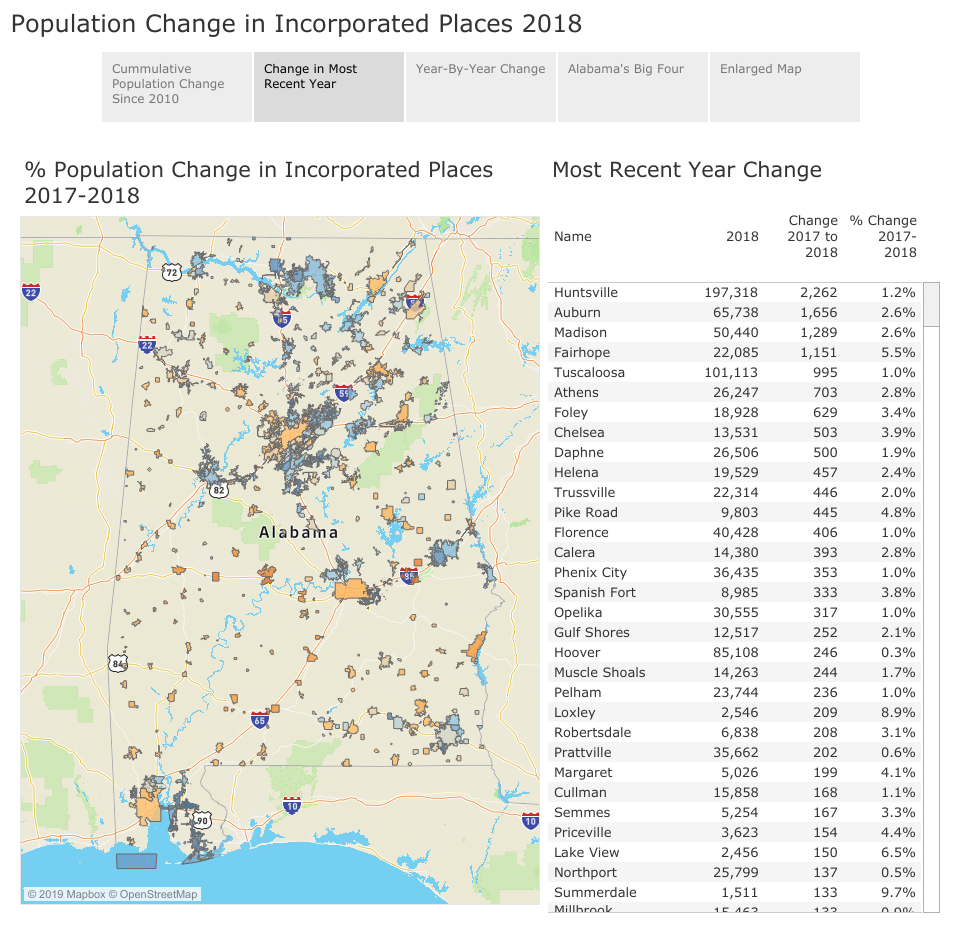
Huntsville and North Alabama
The city of Huntsville added more residents than any other Alabama city with an estimated 2,262 gain in 2018. If current trends continue, Huntsville (197,318) will surpass Birmingham (209,880) as Alabama’s largest city within the next several years. However, Birmingham’s metropolitan area population (1,151,801) is more than twice as large as Huntsville’s MSA (462, 693).
The Huntsville suburb of Madison ranked third in numeric gain adding 1,289. Huntsville has avoided the dilemma faced by many center cities: becoming hemmed in by and losing population to newer suburbs. In fact, Huntsville, through strategic annexation, has now completely surrounded Madison. While Madison can continue to add residents in its current footprint, it will not be able to spread out by annexing contiguous territory.
Though Madison County cities are capturing most of the North Alabama growth, nearby Athens in Limestone County appears to be receiving some of that inflow. In the farther reaches of the Huntsville orbit, Florence and Muscle Shoals had bigger gains in population in 2018 than in any year other in the decade.
Birmingham Area
In the Birmingham metro area, the core city of Birmingham was estimated to have lost over 1,000 residents between 2017 and 2018. Birmingham has bobbed up and down through the decade, but this most recent year saw the steepest decline.
However, there is population growth south and east of the core city, and the most recent estimates indicate that growth is shifting to suburbs farther south. In the most recent year, the suburbs immediately south of core city, Homewood and Mountain Brook show slight population losses, and Vestavia a slight gain. Hoover, while it did add 246 residents, is growing more slowly now than smaller cities to the south like Chelsea (+503), Helena (+457), and Calera (+393). Meanwhile, to the east of Birmingham, Trussville added 446 residents, according to the estimates.
Montgomery Area
The estimates show Montgomery losing 1,674 residents in 2018, while its emerging suburb of Pike Road gained 445. Suburbs to the north, like Prattville (+202), Millbrook (+133), and Wetumpka (+37) saw gains, but the Montgomery metro area as a whole has seen a population outflow.
Some of the population loss in the Montgomery area may be due to the strong growth being seen in Lee County, home to Auburn University. A separate Census survey tracks residential migration across county lines. A look at that data reveals that Elmore County had a net loss of 352 residents to Lee County. Nearby Tallapoosa and Macon County, which are not officially part of the Montgomery metro area, are also losing residents to Lee County.
Meanwhile, Lee County’s two larger cities have been among the state’s biggest gainers in population, according to the estimates. Auburn is second to Huntsville in numerical gain, having added an estimated 12,000 residents since 2010. Over the same period, Opelika ranks No. 10 in the state with an estimated gain of 4,000.
Mobile Area
The 2018 estimates have the City of Mobile declining in population by 953 residents. Census estimates the city has lost about 5,000 people since 2010. Some nearby communities in Mobile County like Semmes and Saraland have gained population over the past decade, but the growth in those communities isn’t enough to offset Mobile’s population loss. One might assume that the rapid growth just across the bridge in Baldwin County is being fed by residents moving out of Mobile. However, other Census data sets indicate that isn’t necessarily the case. While there is some movement from Mobile to Baldwin County, there is also a considerable residential movement back and forth between Baldwin County to Mobile. When moves to and from the county in question are accounted for, Jefferson County had a net gain of about 500 people from Mobile County, compared to a gain for Baldwin of about 250.
Other Urban Centers and the Rest of the State
Like Auburn and Opelika, Tuscaloosa and Northport both continue to grow, though at a slower pace than the rival towns to the east. Tuscaloosa remains substantially larger than Auburn, about 100,000 vs 65,000. Opelika is larger than Northport: about 30,000 vs. 25,000.
As mentioned, Florence and Muscle Shoals showed slight growth in 2018, according to the estimates, as did Phenix City. Dothan was flat, and Anniston and Gadsden both experienced net out-migration.
A scattering of smaller towns in northeast Alabama and southeast Alabama showed population growth. However, most smaller cities in rural counties lost population. Selma was particularly hard hit, with a net loss of almost 500 people in 2018. Since 2018, Census estimates Selma’s population has declined by 2,898 dropping from around 20,000 down to 17,000, a 14 percent population decline. Small towns in Black Belt counties, cities like Tuskegee, Eufaula, and Demopolis, continue to experience population declines, but so do towns in east central and northwest Alabama like Jasper, Alexander City, and Sylacauga.