ACT Scores for Alabama public high school students improved in 2023, bucking a downward trend nationally and providing another clue that Alabama schools began recovering from the Covid-19 pandemic more quickly than schools nationally. Students in the graduating class of 2023 were in ninth grade when the COVID-19 pandemic reached the U.S.
Printable PDF Document Available Here
Figure 1. Alabama Public High School Average Composite Scores, 2015-2023
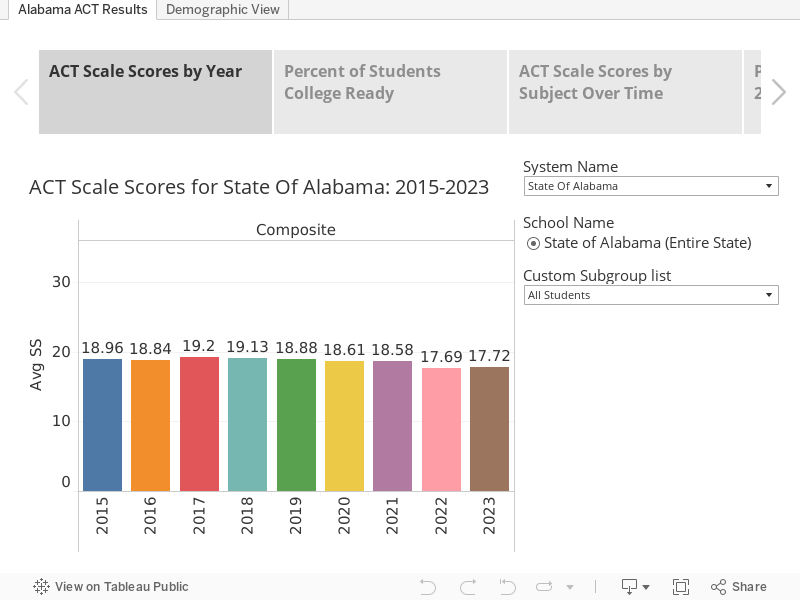
Alabama’s Class of 2023 still trailed the score levels of classes tested prior to the academic disruptions wrought by COVID-19. The average composite score in 2023 was 17.72 on the ACT’s 36-point scale, up from 17.69 in 2022 but down from 18.58 in 2021.
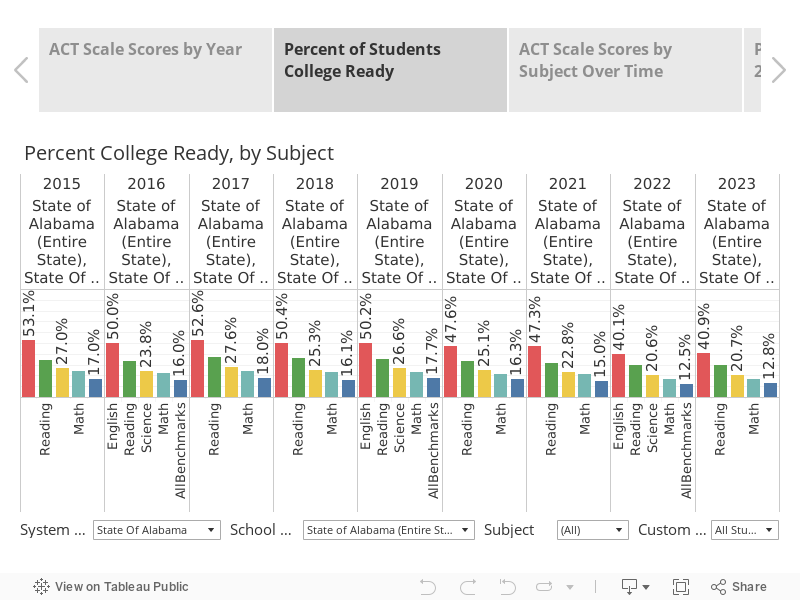
The percentage of test-takers who achieved ACT’s college-ready benchmark in all four tested subjects – English, reading, science, and math – climbed to 12.8%. According to ACT, students scoring at or above the benchmark on a subject test have a 50% chance of earning a B in an introductory college course in the subject and a 75% chance of earning a C.
Figure 2. Percentage of students scoring at or above the college-ready benchmark in 2023, by subject
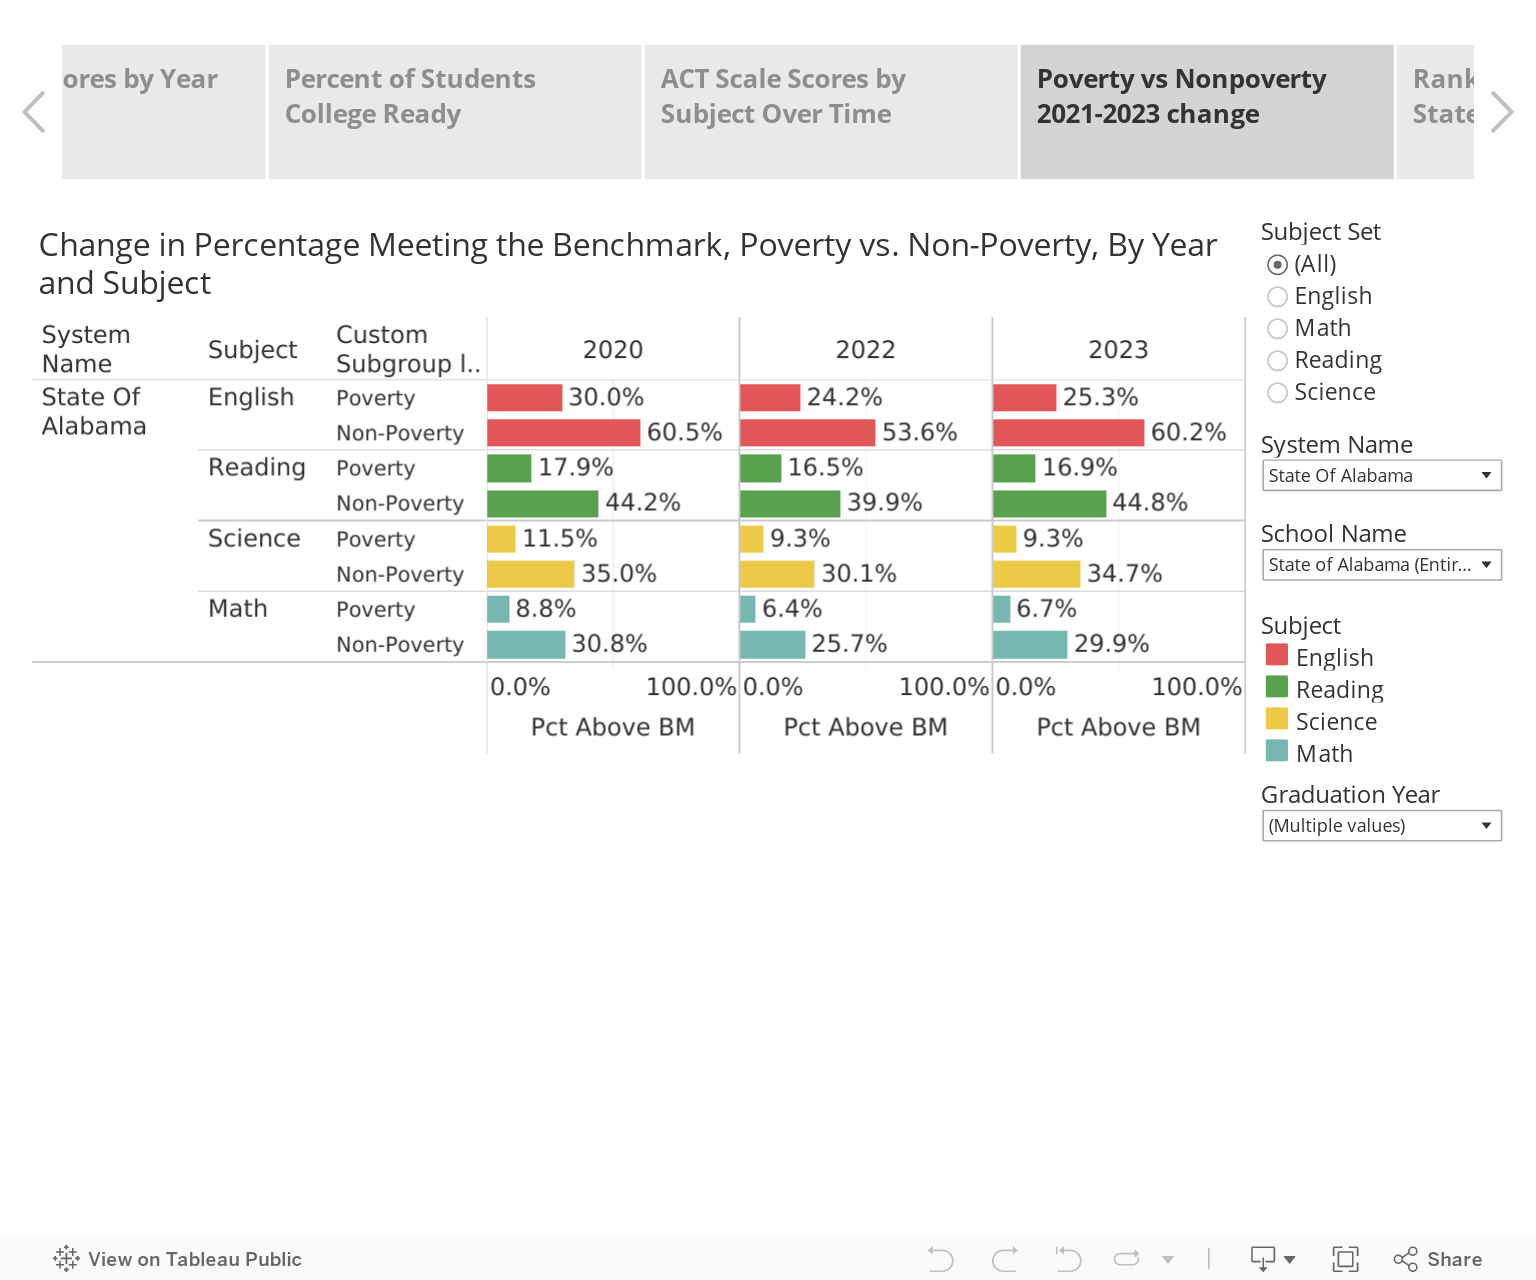
The scores of students from low-income households fell further during the pandemic and have not recovered to the same extent as students from non-poverty households.
The percentage of non-poverty students who were college-ready in reading was higher in 2023 than in the graduating Class of 2020. In English and science, the non-poverty students in the Class of 2023 had nearly closed the gap. In math, non-poverty students still have some catching up to do.
In comparison, the percentage of economically disadvantaged students who scored college-ready in 2023 remains significantly lower than pre-pandemic levels.
Figure 3. Comparing Poverty and Non-poverty Students’ College Ready Percentage, by subject, by selected years
Compared to other states
Nationally, a shrinking percentage of students of students were college-ready in 2023. In all four subject areas, the percentage of students scoring at or above the college-ready benchmark was the lowest in recent history. The average Composite score declined by 0.3 points, from 19.8 in 2022 to 19.5. Immediately before the pandemic, the U.S. average ACT composite score was 20.7 in 2019. While Covid led to sharp drops in scores, the national average score on the ACT has been trending down for several years. In 2017 and before, the national average composite was 21.
Comparing Alabama’s average composite score to the national average isn’t appropriate because of the difference in the universe of test-takers in different states. All Alabama public high school students take the ACT. In many states, only college-bound students take the test. Other states focus on the SAT instead, leaving only a small portion of students to take the ACT.
Looking strictly at the states where 100% of students took the test, the average composite score was 18.3, compared to Alabama’s 18 (When it comes to state-to-state comparisons, ACT provides a different state average than the data strictly focused on Alabama public school students).
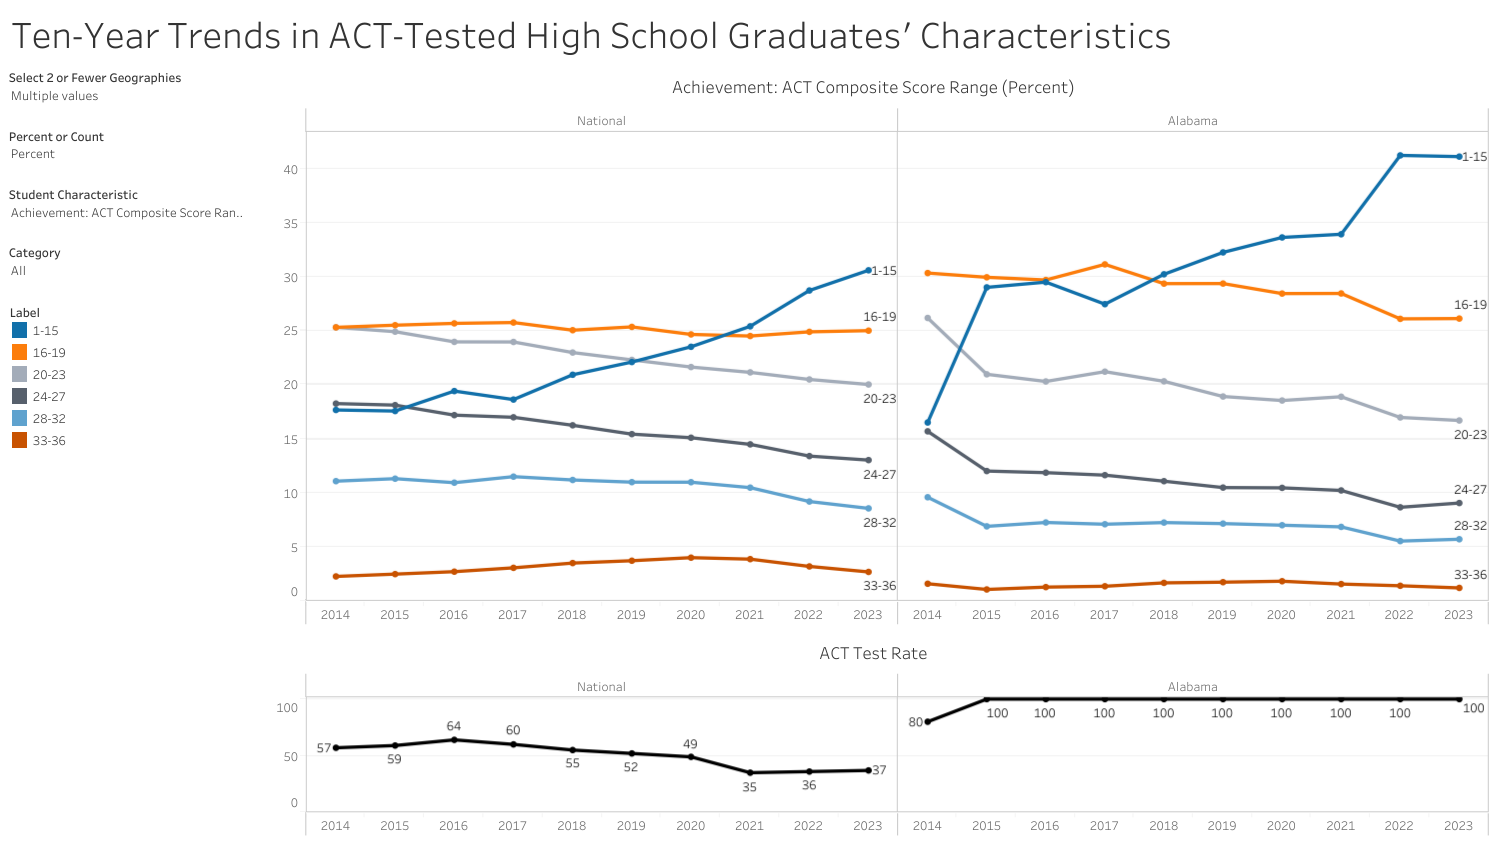
Data provided by ACT and accessible through ACT’s online dashboard indicates that White students in Alabama have caught up to and scored at the same average as White students in other 100% states. However, Black and Hispanic students in Alabama haven’t regained as much ground. There also appears to have been a steep jump in the percentage of students scoring in the lowest ranges of the test. The percentage of Alabama students who scored 15 or below jumped from 34% to 41% during the pandemic.
Figure 4. Trends in the percentage of ACT test-takers in score ranges US vs. Alabama
Focus on Alabama Scores
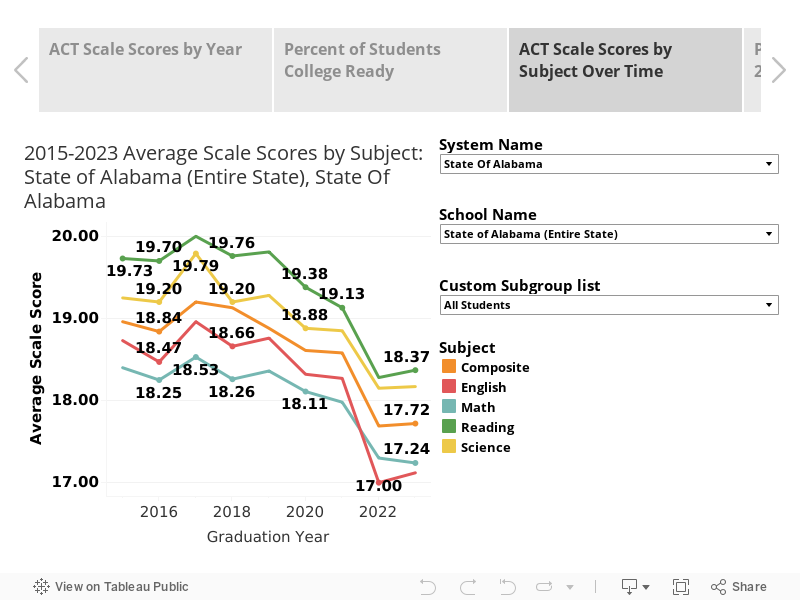
Alabama students’ average scores improved in reading, English, and science but not math.
Figure 5. Trends in scale scores by subject
System Level Results
At the school system level, systems with a higher proportion of non-poverty students post higher average scores. Systems with a higher concentration of poverty post lower average scores.
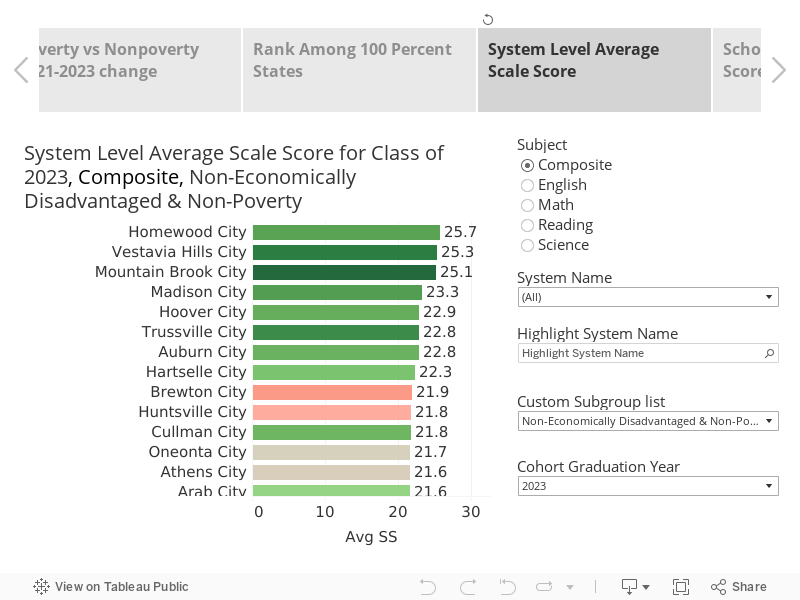
Using the menu options on the right of the visualization, you can adjust variables to see the data through different lenses. Figure 6 presents the average scale score of non-poverty students in each system. Applying this different lens helps identify high-performing systems where higher poverty percentages might affect overall performance. More than half of the students in systems like Brewton, Huntsville, Haleyville, Jasper, and Demopolis are economically disadvantaged. But the Non-poverty students in those systems post average scores that rank them in the top 20 of school systems,
Figure 6. Non-poverty student’s average scores, by system
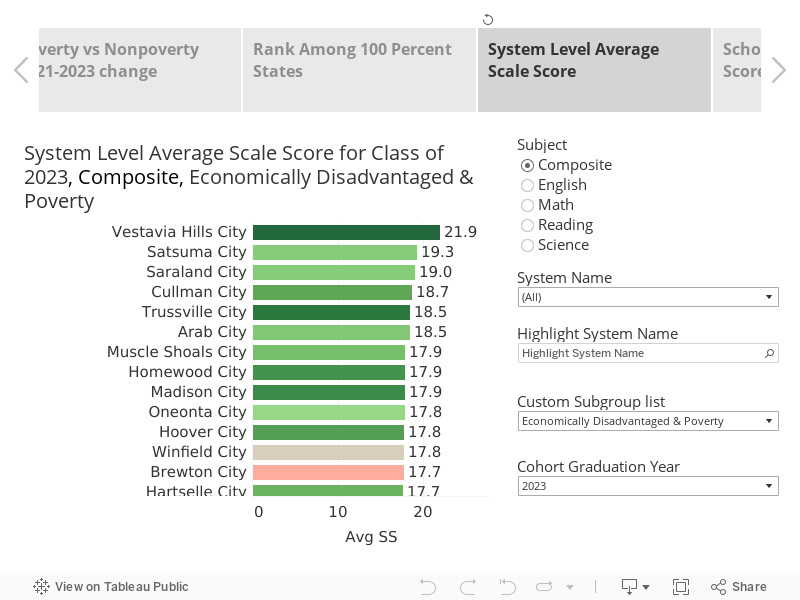
Meanwhile, Figure 7 compares the average scale score of economically disadvantaged students attending the various systems. Again, this different lens reveals a different set of high-performing schools. More than 40% of students in Satsuma, Saraland, Arab, and Oneonta are economically disadvantaged, and yet economically disadvantaged students there score higher than the all-students average statewide. Economically disadvantaged students make up more than half the student body in Brewton and Winfield, but despite that concentration, the system average for students in poverty ties or beats the state all-student average.
Figure 7. Economically Disadvantaged Students’ Average scores, by system
Examining results at the school level is also important for identifying high performance. Figure 8 presents the average scores of Black students by school. The highest average scores are found in Montgomery, Birmingham, and Huntsville magnet schools.
Figure 8. Black students’ average scores, by school
Use the menus and tabs to explore data on your own, find your school or system, and make comparisons keeping in mind student body socioeconomic composition. Available data options include:
- Change in system performance
- Change in school performance (when looking at the biggest change, keep in mind that schools new to the comparison may be improving from zero the year before)
- Get an idea of the average ACT score of students admitted to Alabama colleges and universities and also the average score of the lowest 25% and upper 75% of enrolled students.