More Alabama high school students graduated ready for college or careers in 2023, according to data recently released by the Alabama Department of Education.
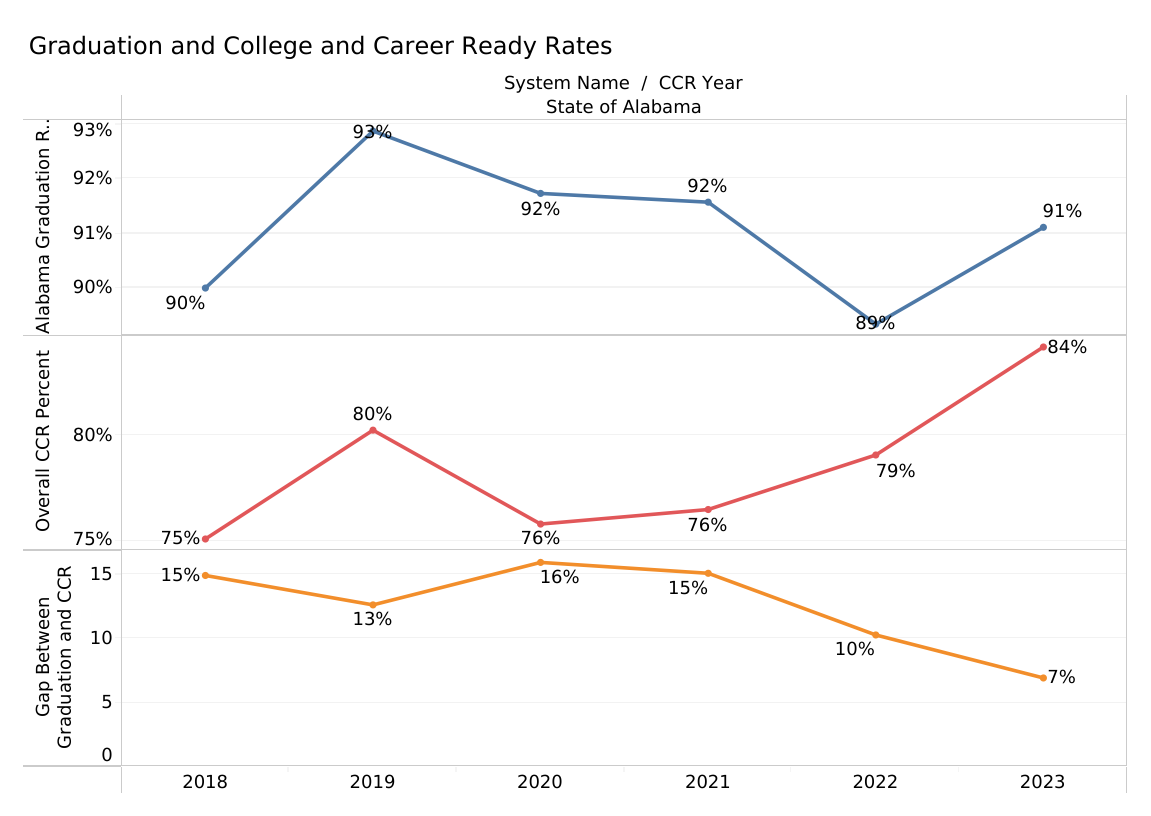
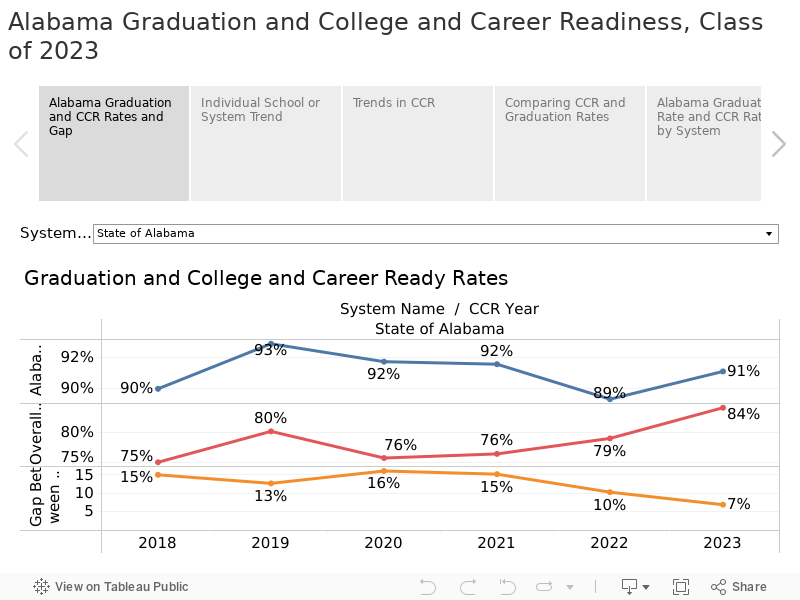
Students in the Class of 2023 made gains on all measures, bouncing back from the setbacks suffered during the pandemic and closing the gap between the percentage of students receiving a diploma and the percentage of students meeting the definition of college and career readiness: 91% of seniors graduated, 84% of seniors were college and career ready. That’s the highest readiness rate ever recorded.
The results show progress toward a goal established by the state Legislature and adopted by the State Board of Education that all students demonstrate college and career readiness in order to graduate.
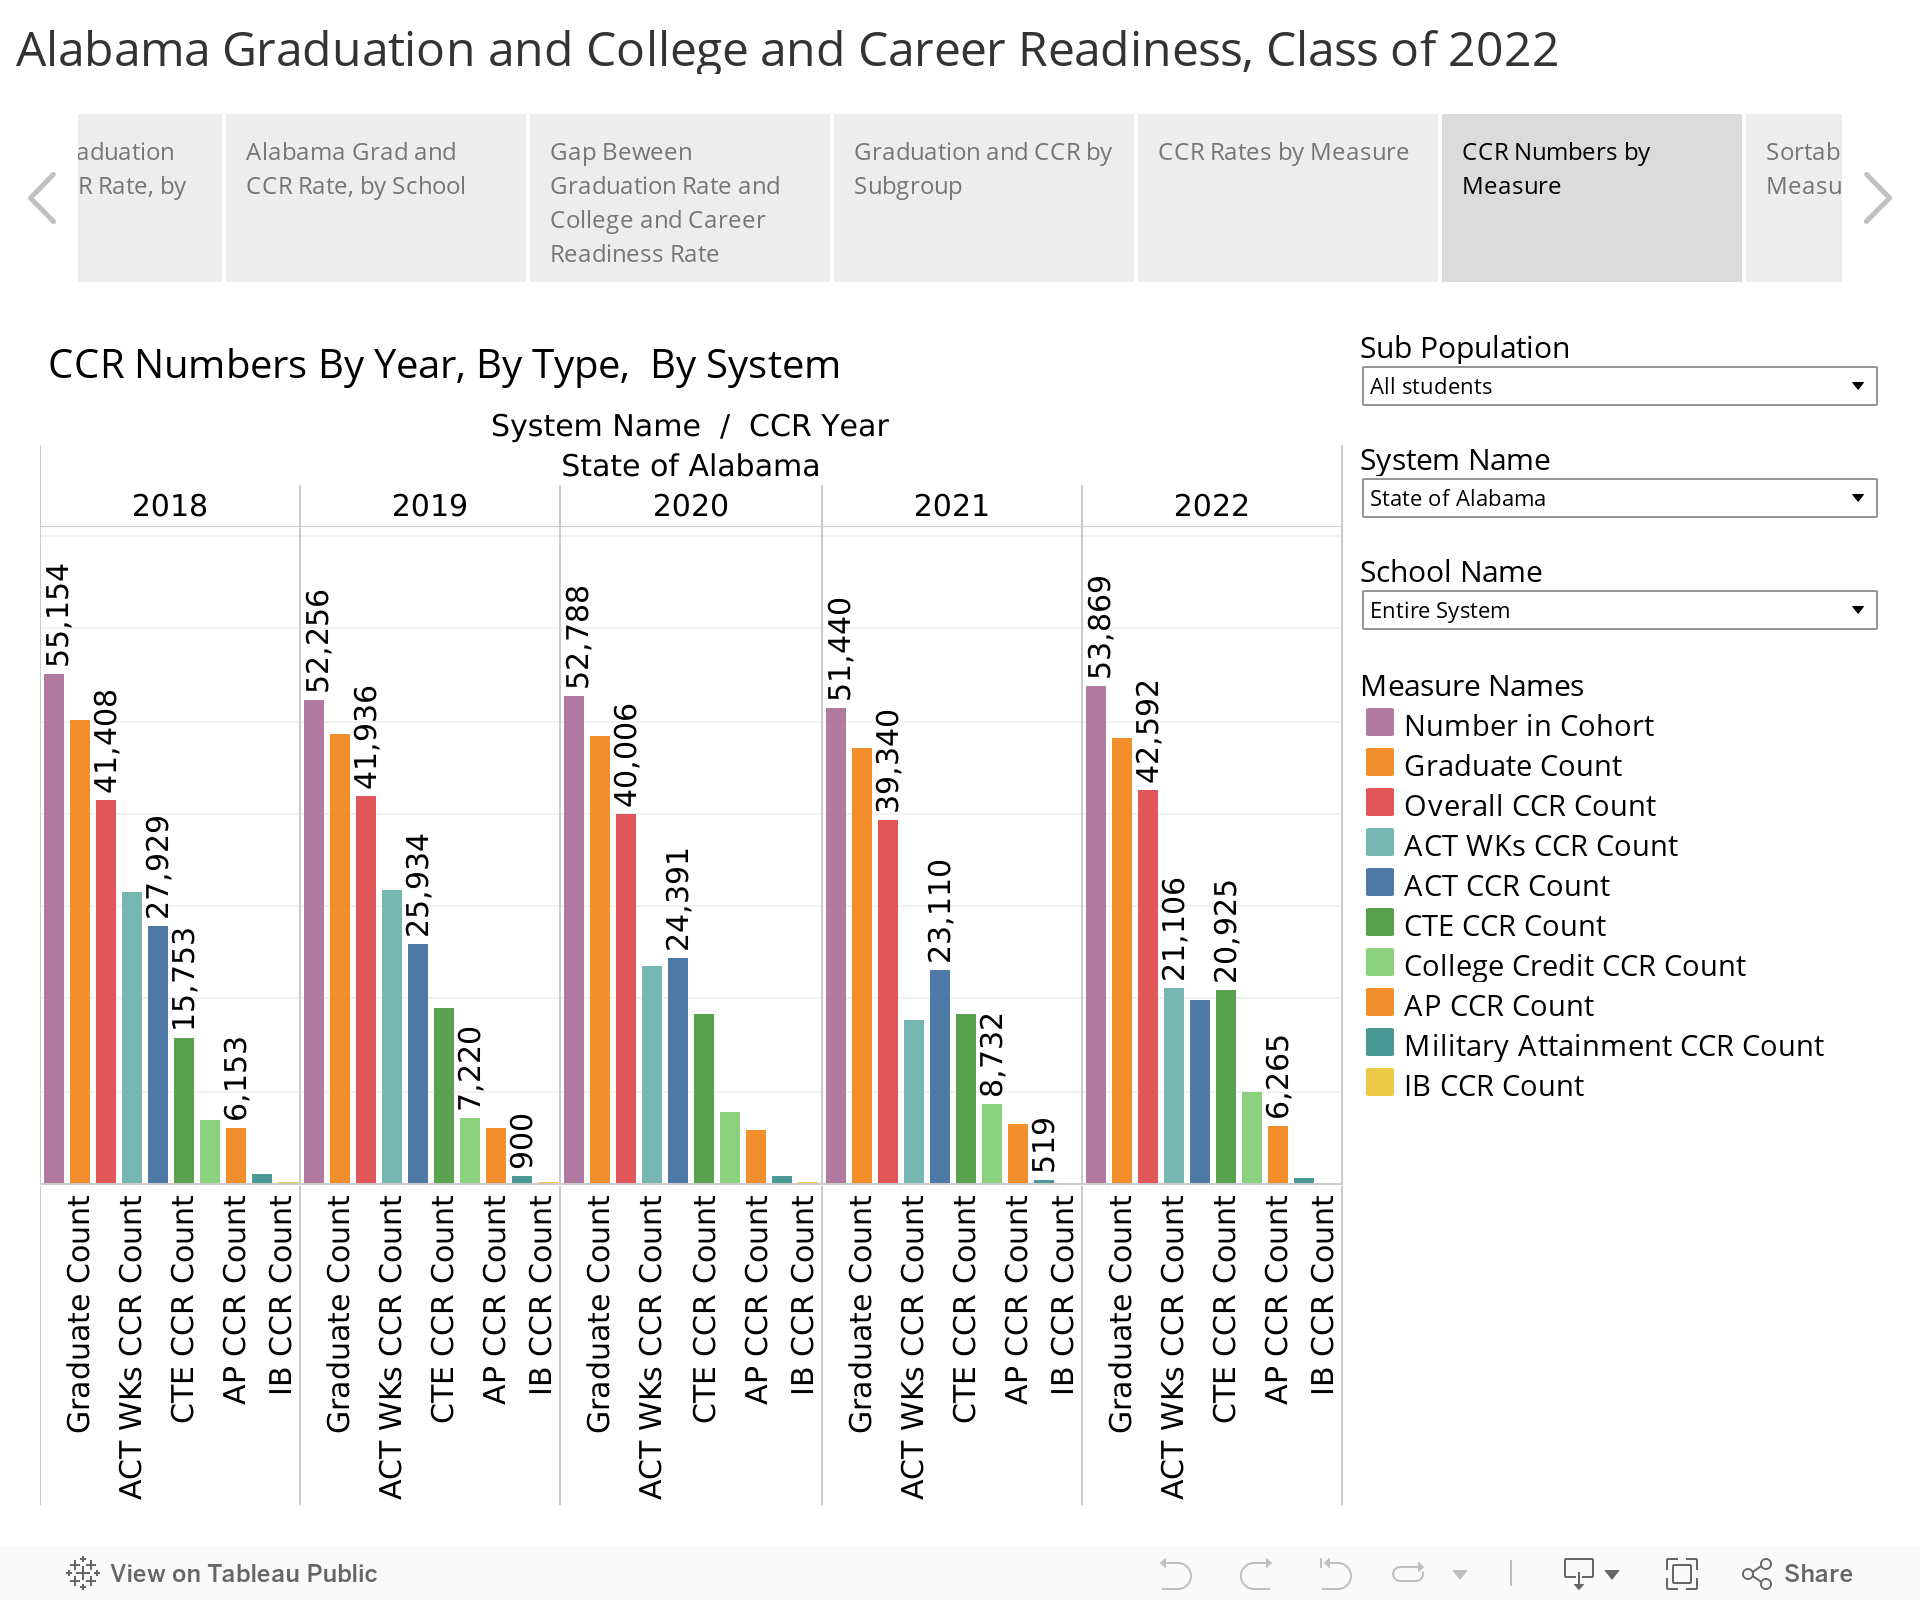
More seniors graduated in 2023, even though this cohort of seniors was smaller than the Class of 2022. Alabama’s college and career readiness rate (CCR) increased by five percentage points over the levels recorded in 2022.
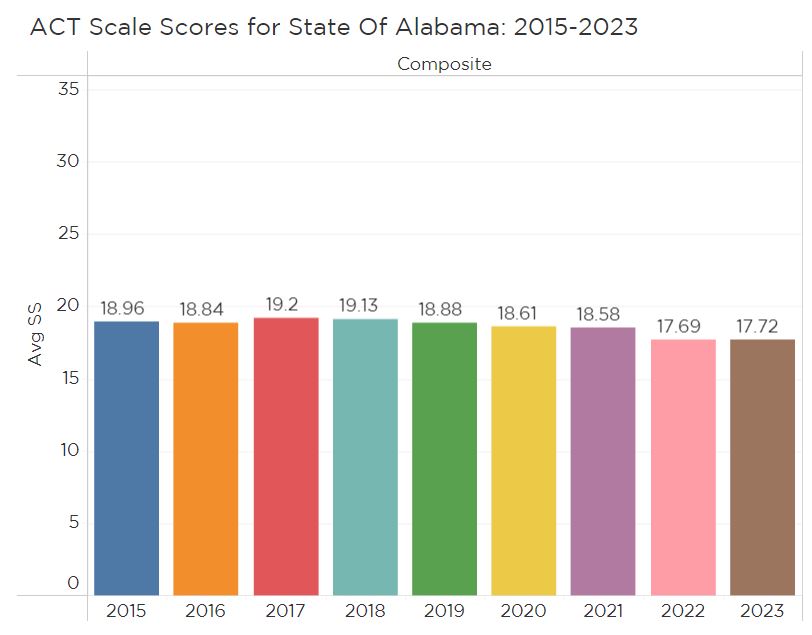
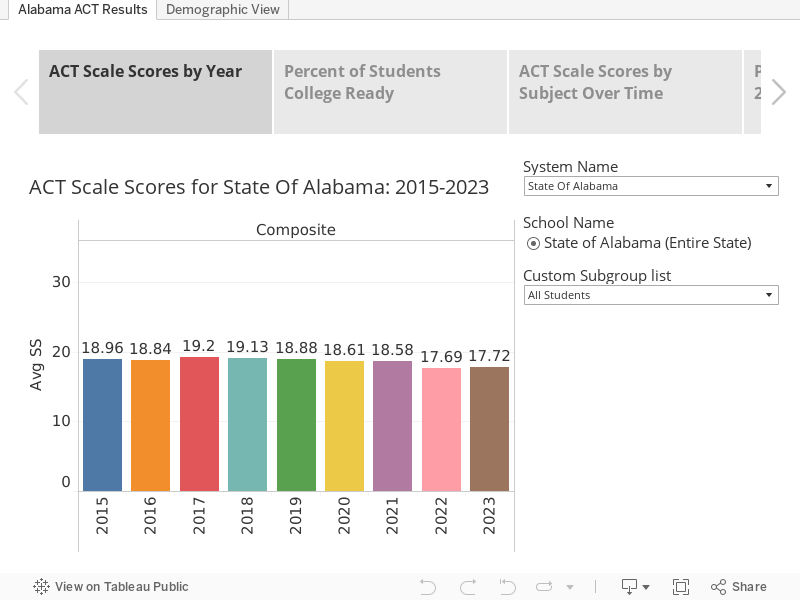
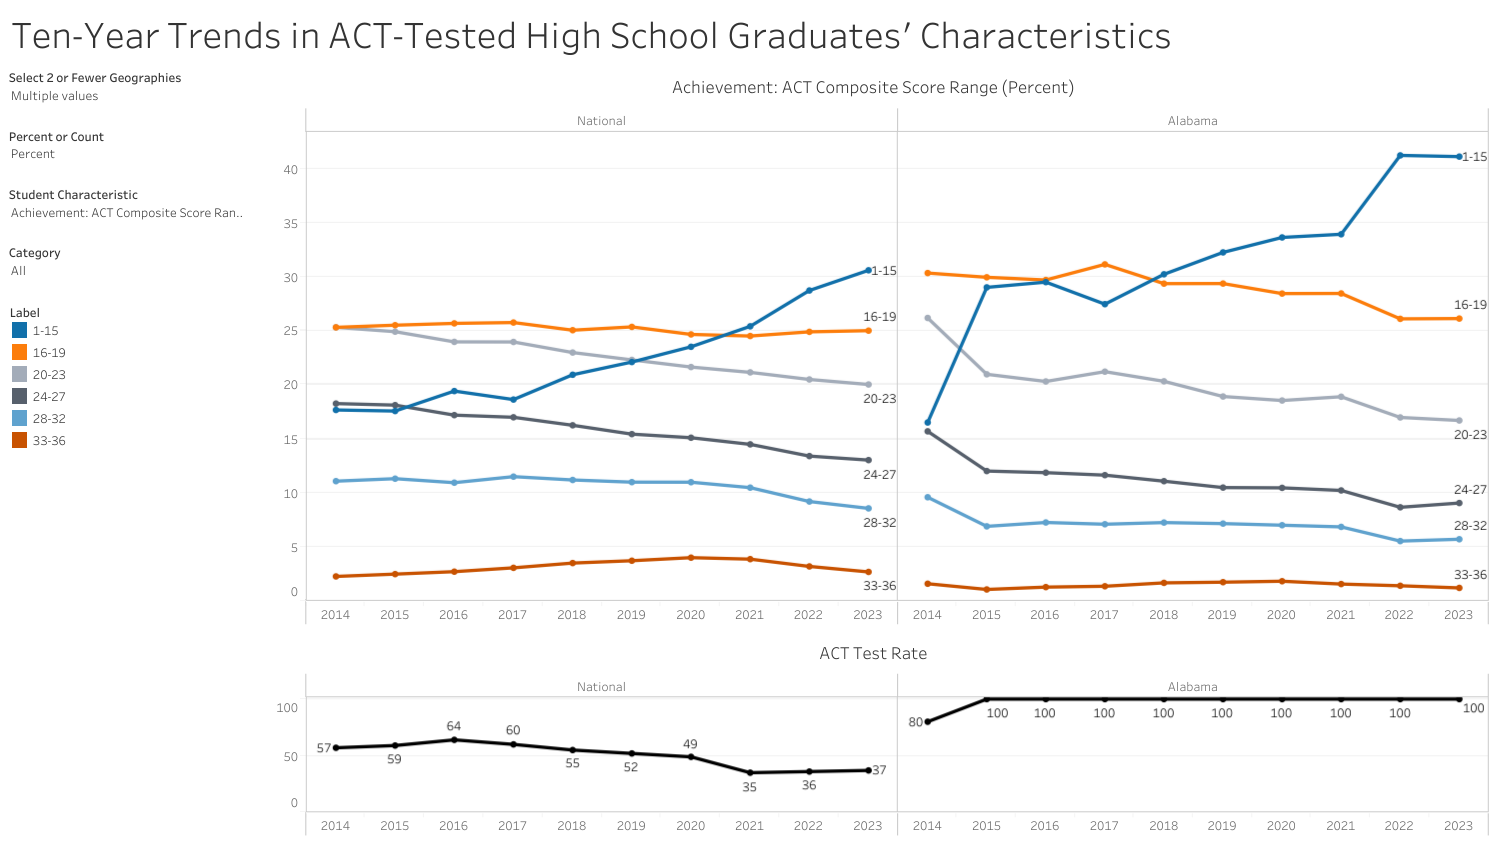
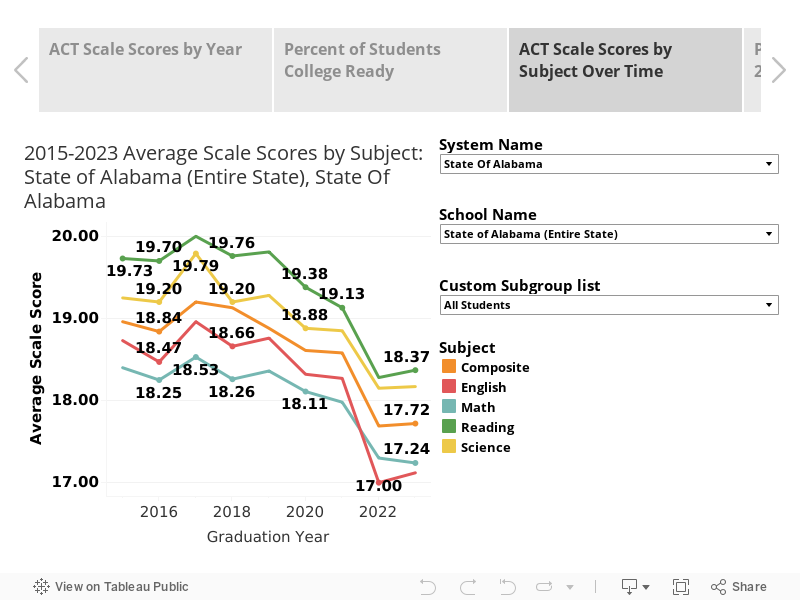
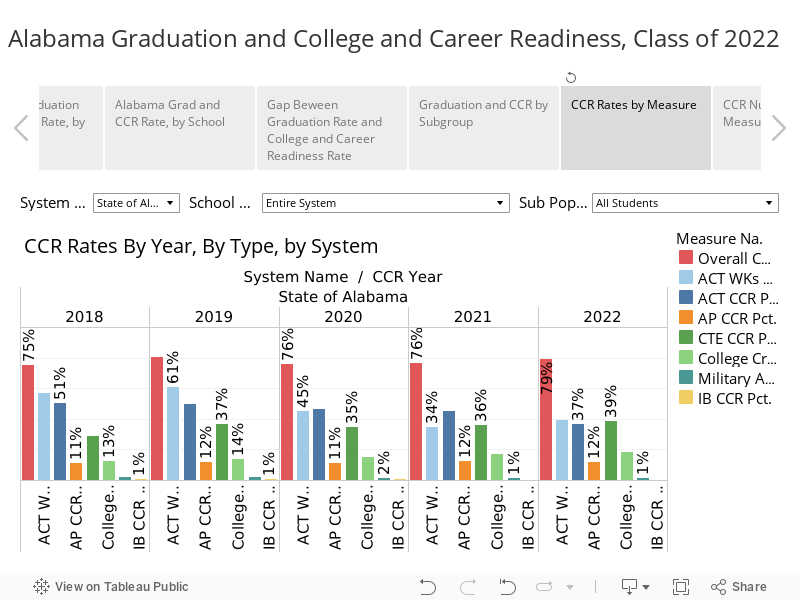
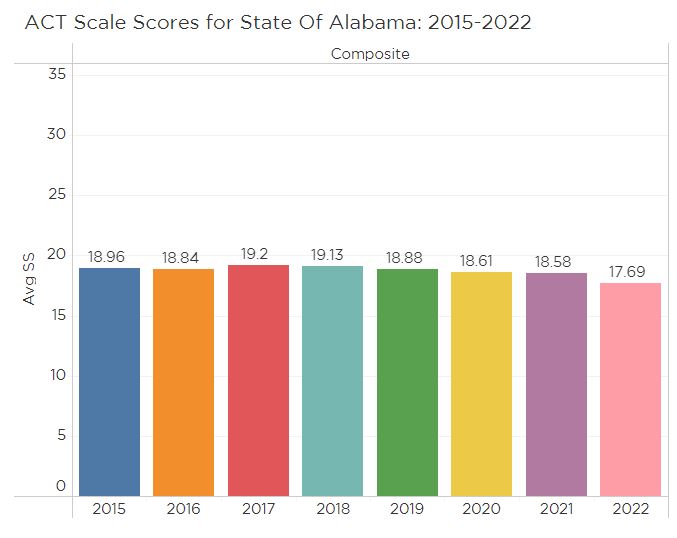
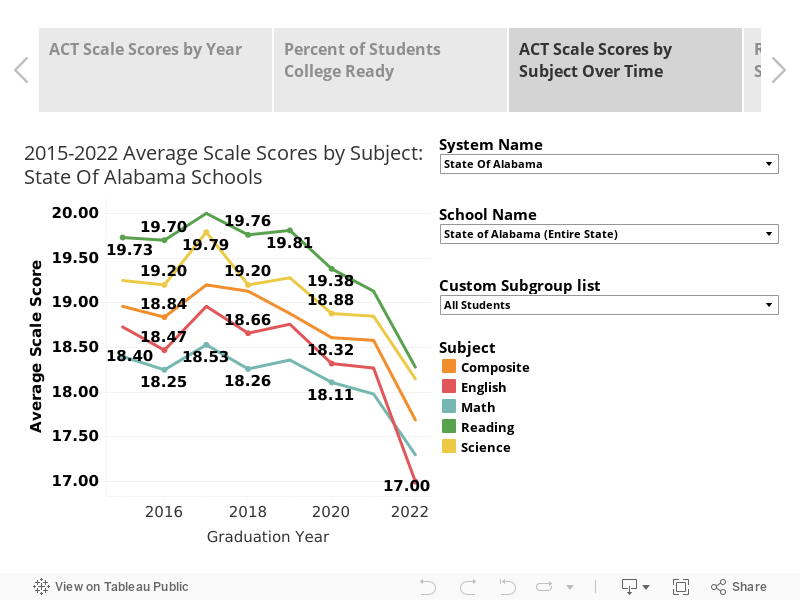
In percentage terms, student readiness increased on every measure. However, college readiness, as measured by scores on the ACT, is still lower for the Class of 2023 than it was for graduating classes before the pandemic.
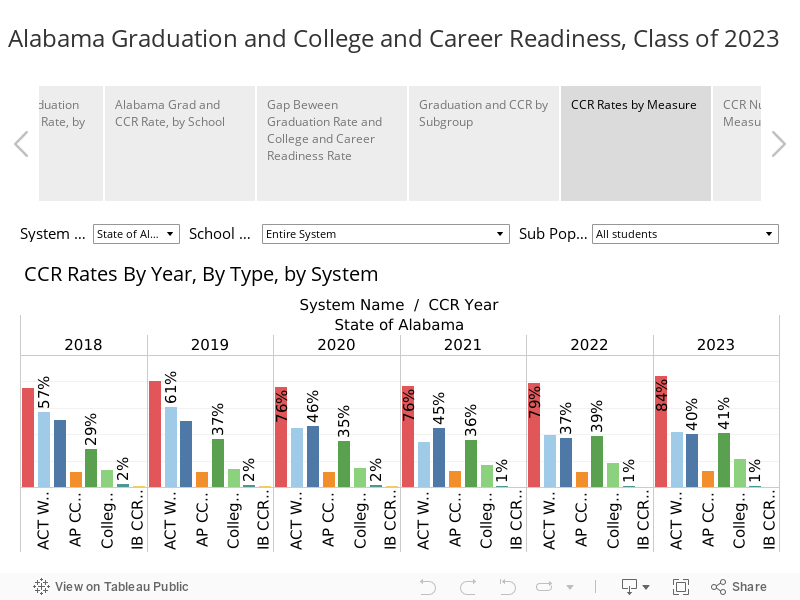
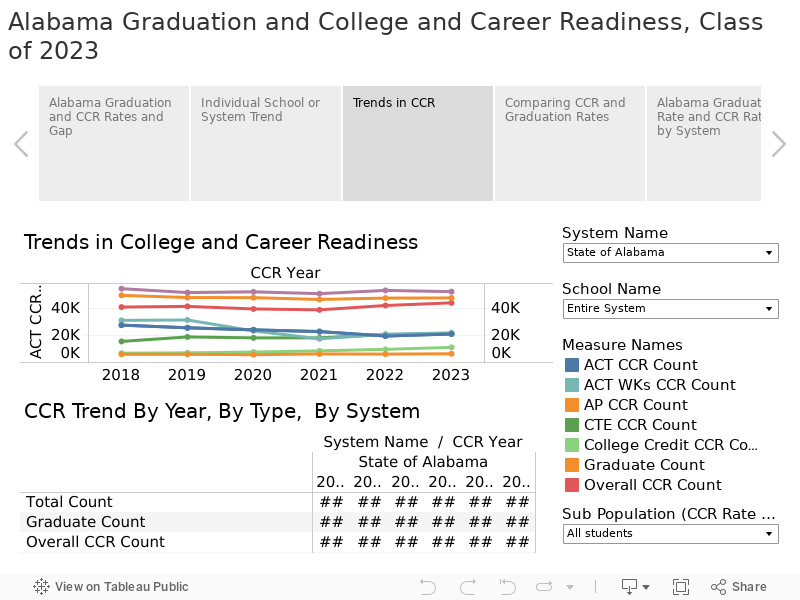
Still, improved performance on the ACT accounted for the biggest gains in the number of students reaching the CCR benchmark. Follow this link for PARCA’s analysis of ACT Scores for the Class of 2023.
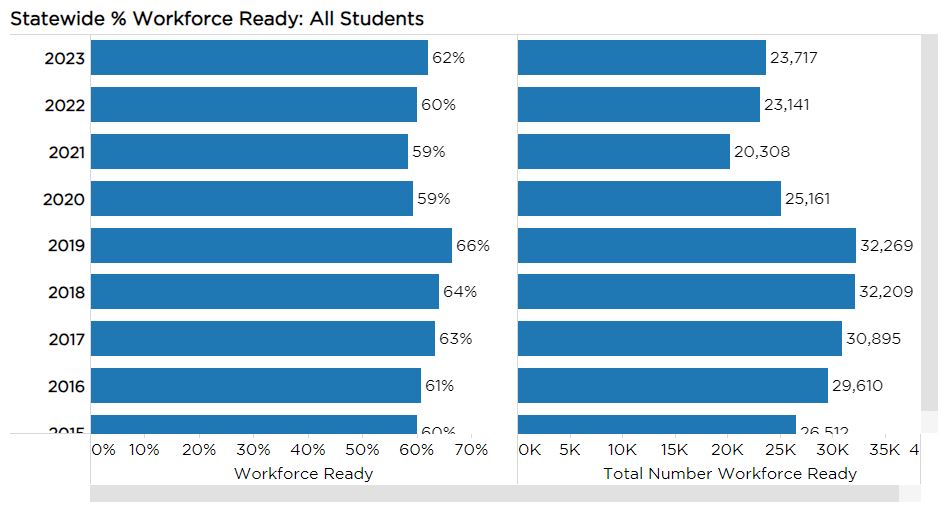
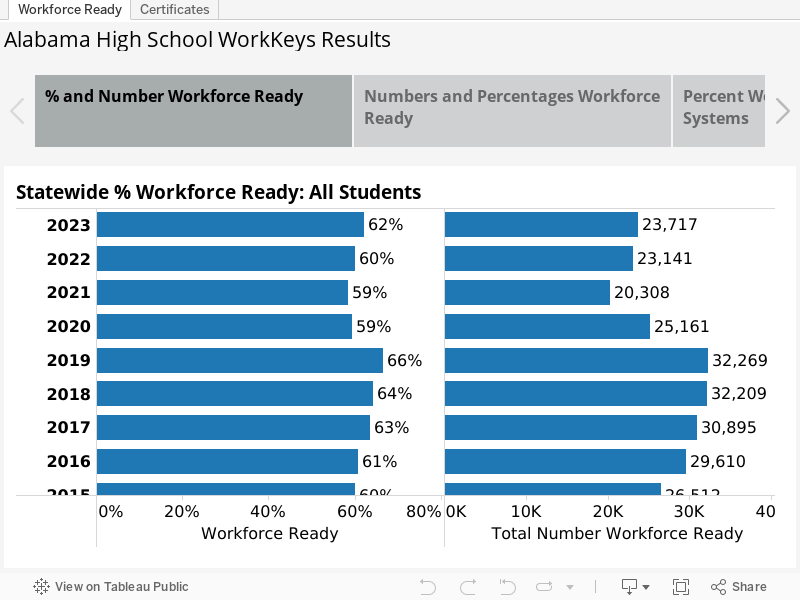
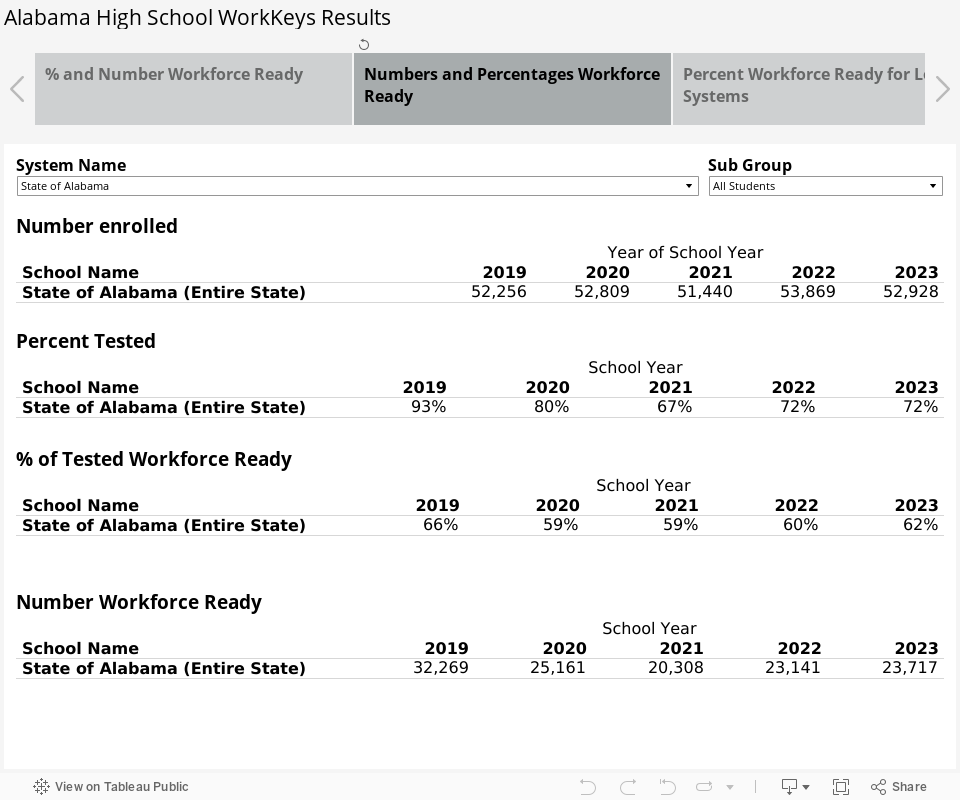
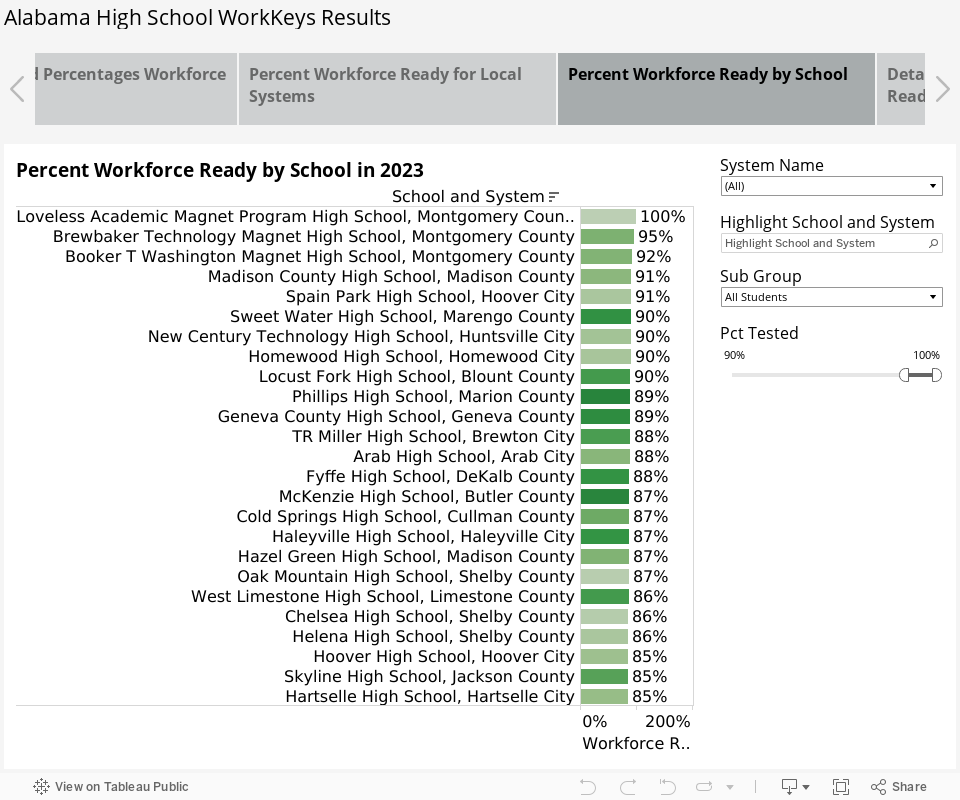
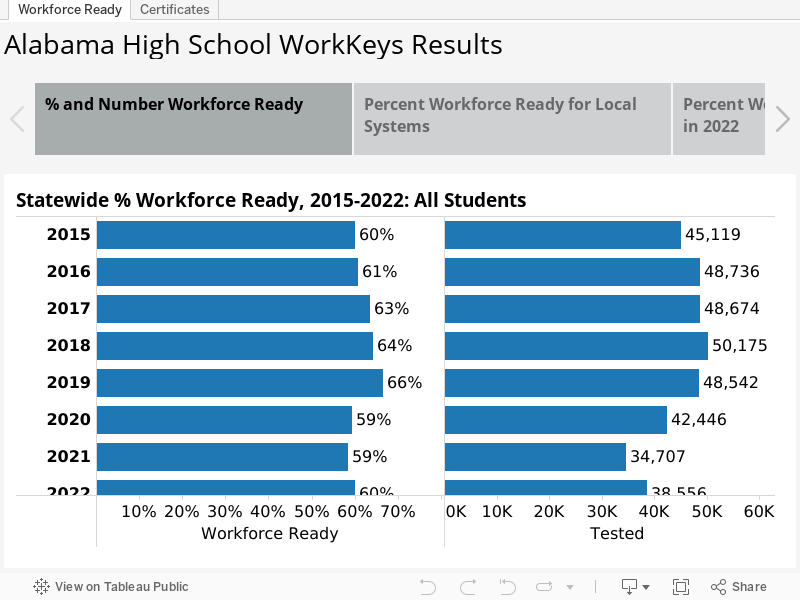
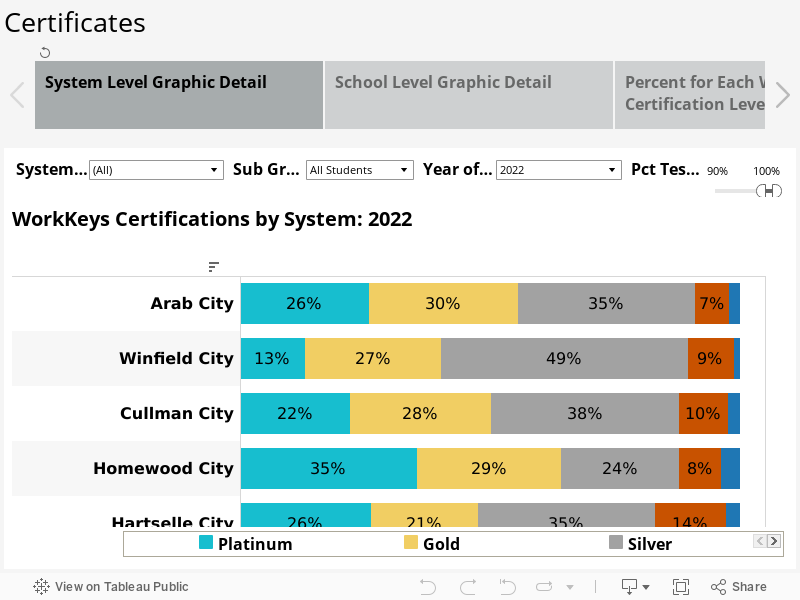
Close behind were big gains in the number of students earning the CCR by successfully completing career-oriented courses taught at high schools, vocational centers, or community colleges, courses known as career technical education. Also, the number and percentage of students earning a career-ready score on ACT’s WorkKeys test increased. A deeper dive into 2023 WorkKeys results is available here. The number of students earning credit through dual enrollment courses at community colleges or universities also increased.
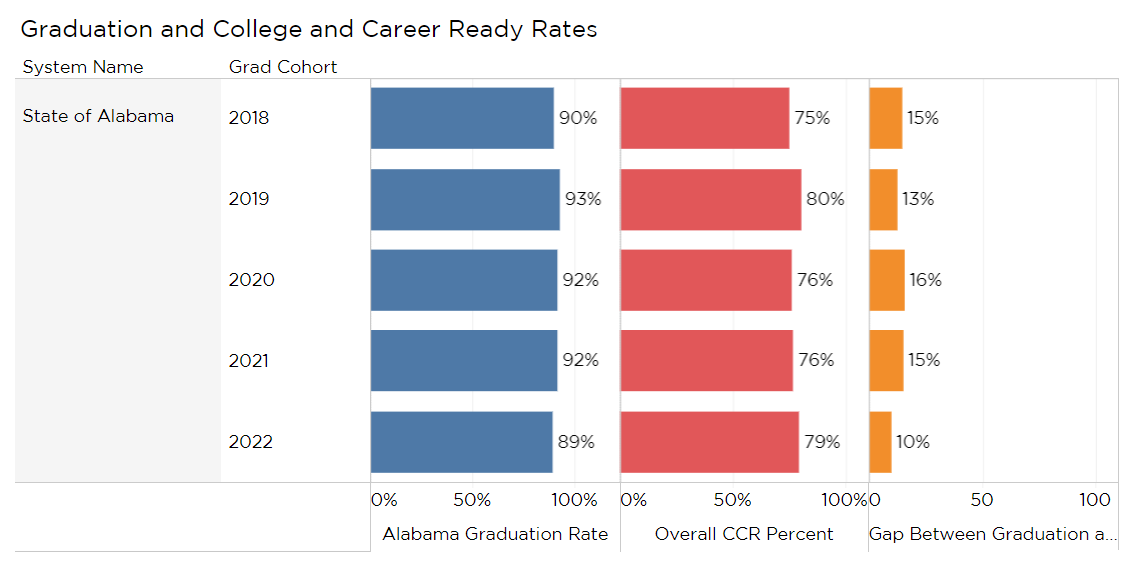
Alabama’s high school graduation rate is among the highest in the country, though that is a relatively recent phenomenon. In 2012, Alabama’s high school graduation rate was 75%, trailing the national average of 80%. By 2018, Alabama’s graduation rate had climbed to 90%, exceeding the U.S. rate of 85%. In 2022, the most recent available year for comparison, Alabama’s graduation rate was tied with the U.S. at 88%.
With the sharp rise in the graduation rate came concerns that some students were being awarded diplomas but weren’t prepared for the next step. In 2018, despite that 90% graduation rate, Alabama’s college and career readiness rate was still at 75%.
Pressure to close that gap between graduation and college and career readiness has been building. Last year, the Legislature passed a requirement that by 2026, all students, in order to graduate, must have met one of the Alabama Board of Education’s definitions of college and career readiness. The Legislature subsequently provided $25 million in FY 2024 to support schools in expanding opportunities for college and career readiness. Last year, Gov. Ivey’s Commission on Teaching and Learning recommended allocating $25 million in ongoing support for the grant program.
Students can demonstrate that they are ready for college or the workforce in several ways:
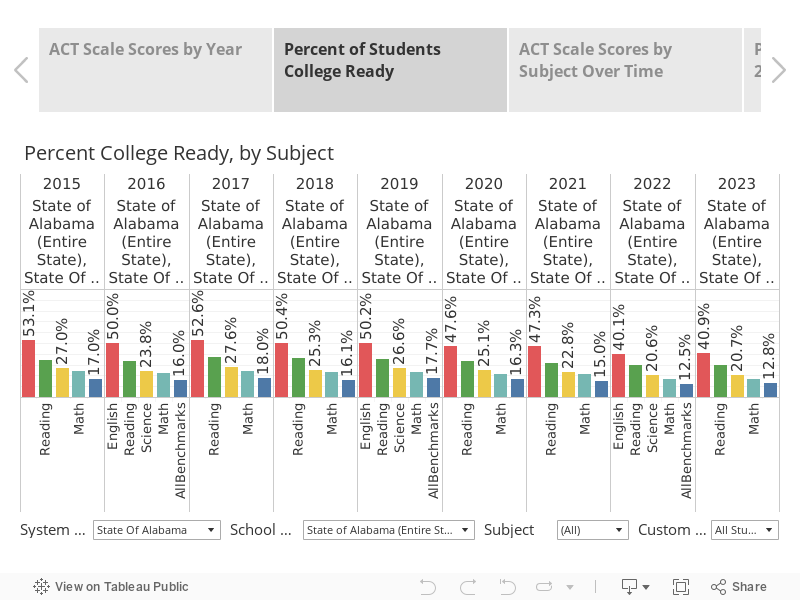
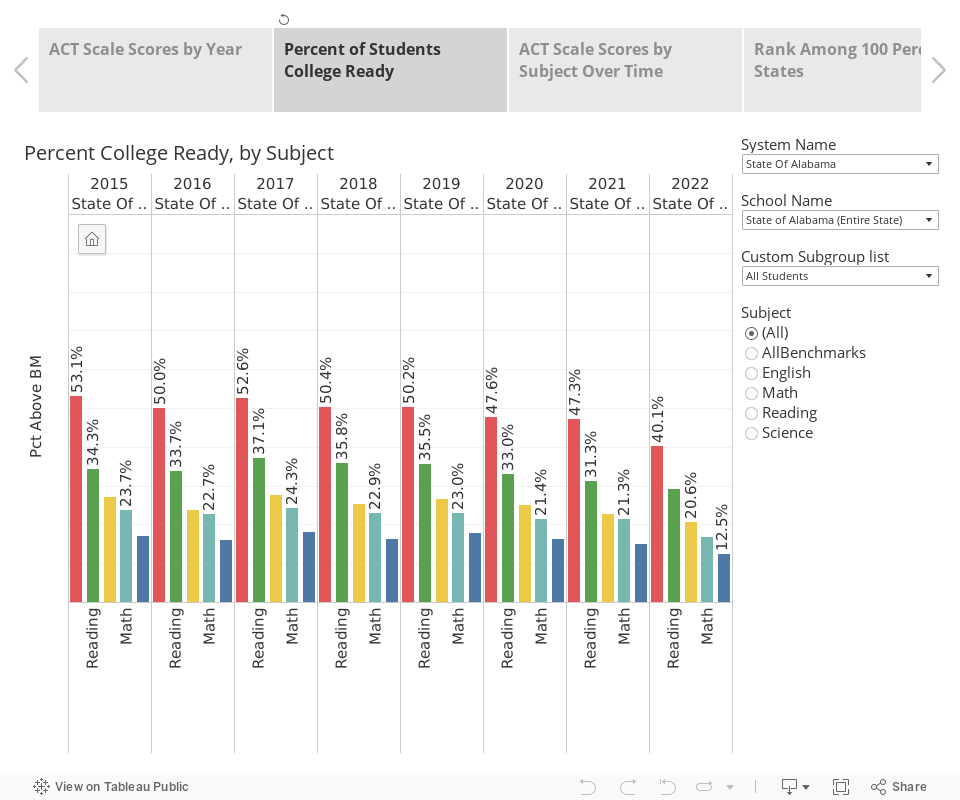
- Achieve a benchmark score in one subject on the ACT. Benchmarking on the ACT indicates that a student is likely to succeed in a college class in that subject.
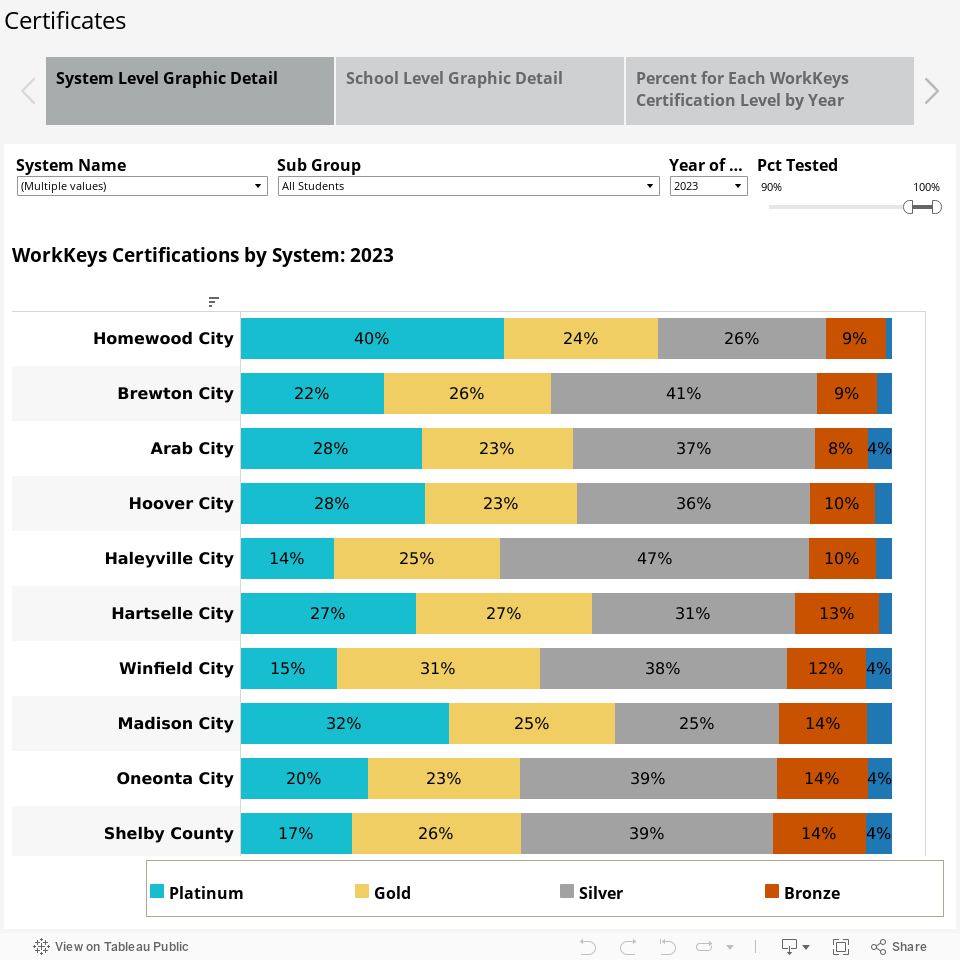
- Earn a Silver Certification or above on the ACT WorkKeys test. WorkKeys is a test of knowledge, communication, and comprehension as they are applied in the workplace. Scoring Silver or above indicates a student is ready to enter the workforce in most career fields.
- Earn college credit through Advanced Placement or International Baccalaureate courses taken in high school.
- Earn college credit through dual enrollment. A high school student can complete courses at a community college or university while in high school. These can be academic or career-related courses.
- Complete a progression of Career Technical Education courses in a field.
- Earn an Industry Recognized Credential as part of a career technical education course.
- Participate successfully in an In-School Youth Apprenticeship Program approved by the Alabama Office of Apprenticeship.
- Successfully enlist in the military.
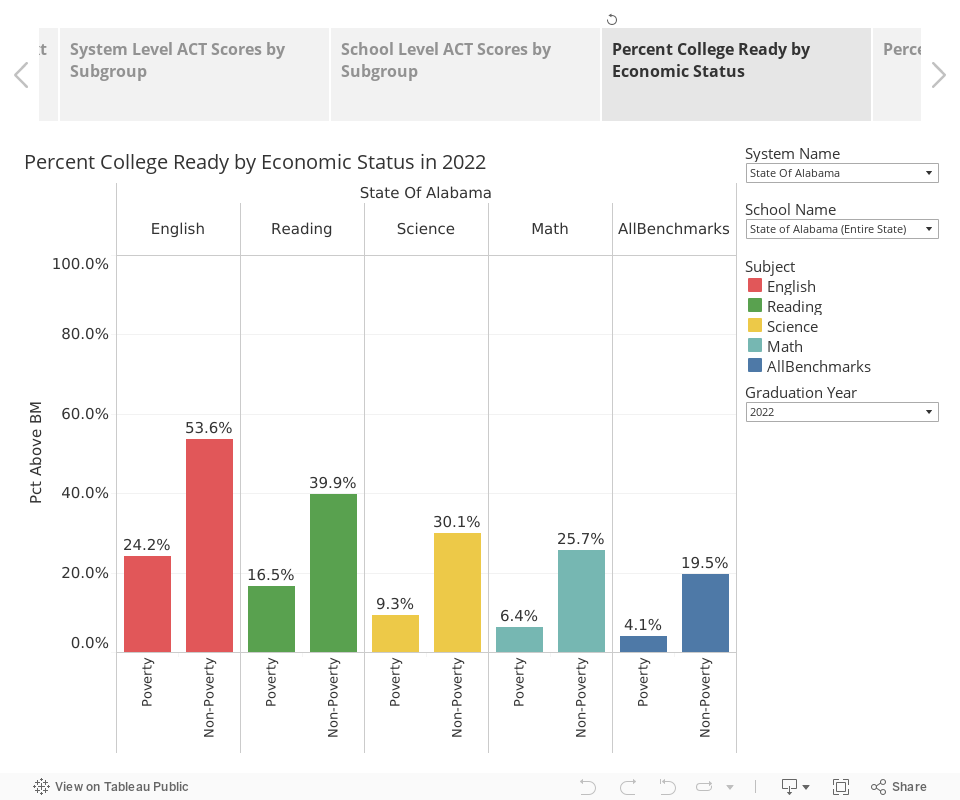
While progress is being made, gaps remain.
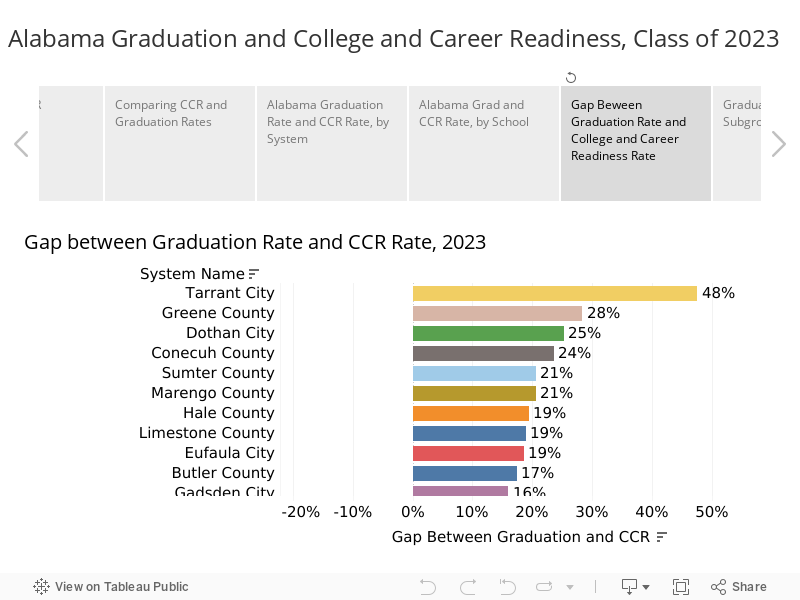
In 29 school systems, all graduates were college and/or career-ready. In 20 of those systems, more seniors were college and career-ready than graduated.
On the other hand, in six school systems, the CCR rate was 20 percentage points lower than the graduation rate, indicating that 20% or more of the students who received diplomas hadn’t demonstrated readiness for college or the workforce.
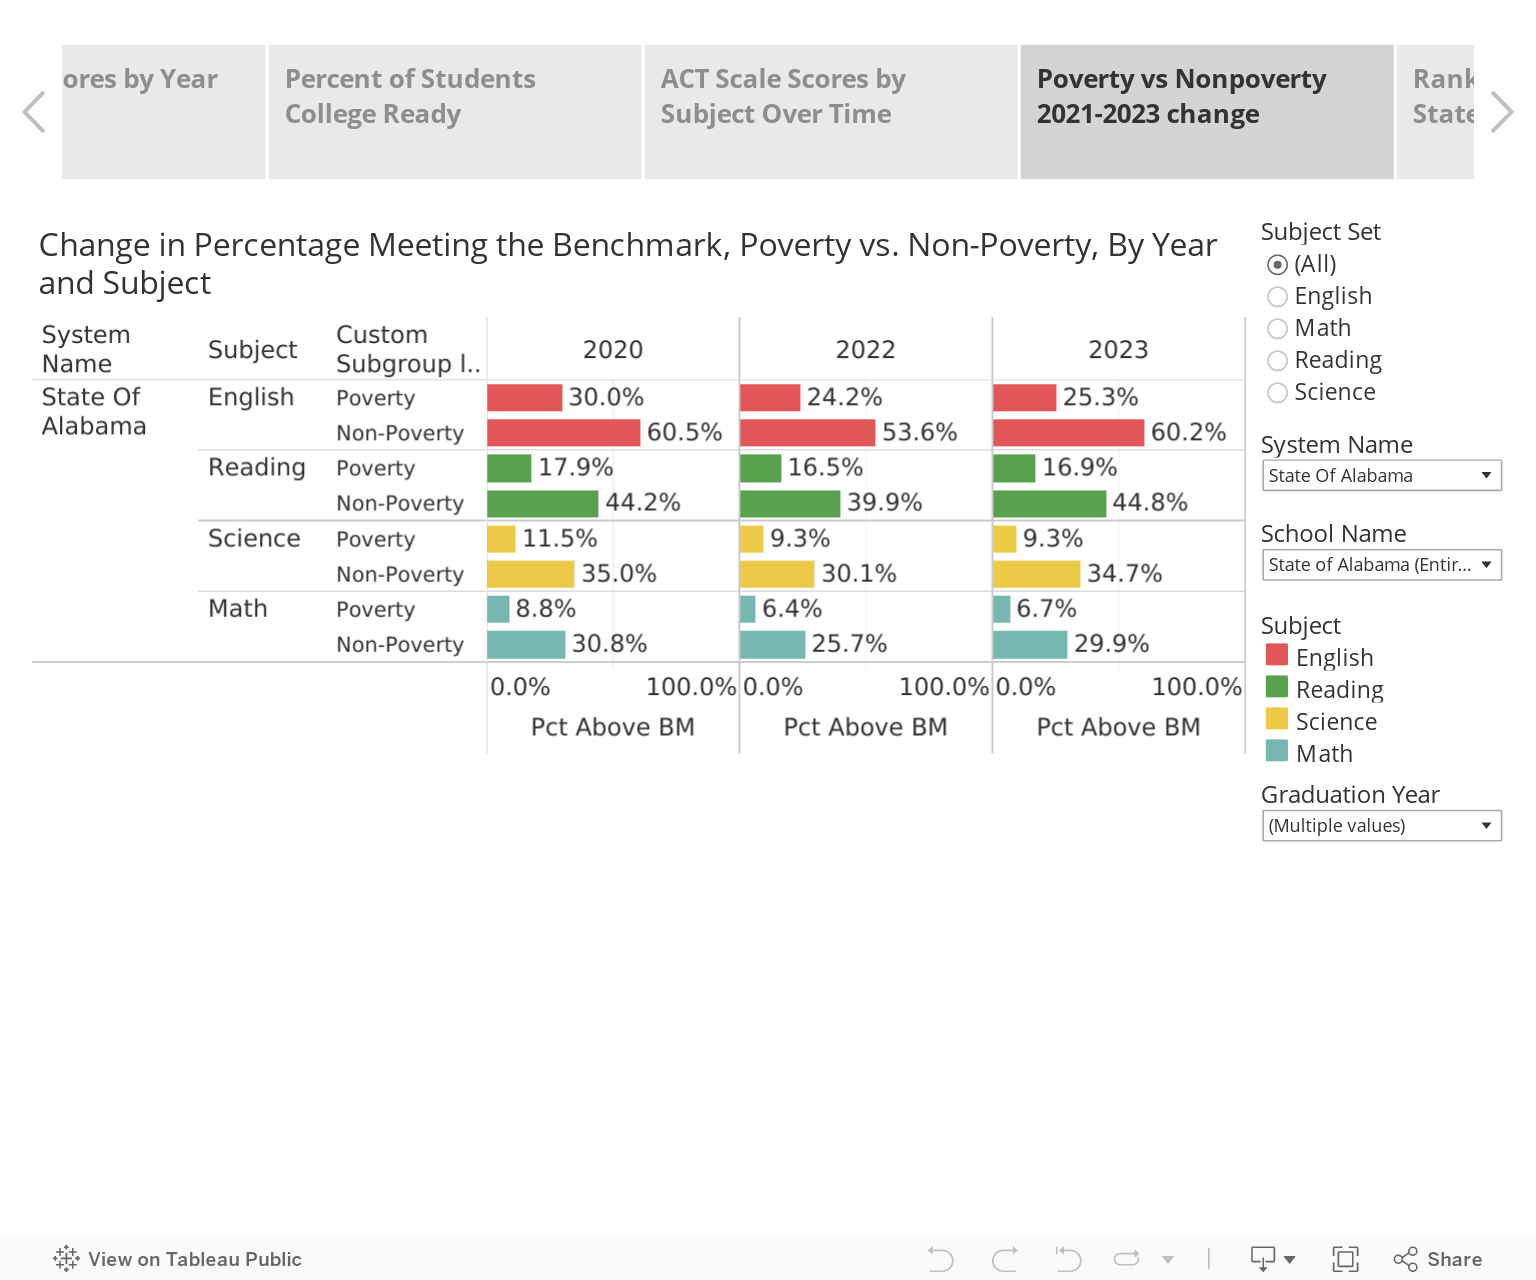
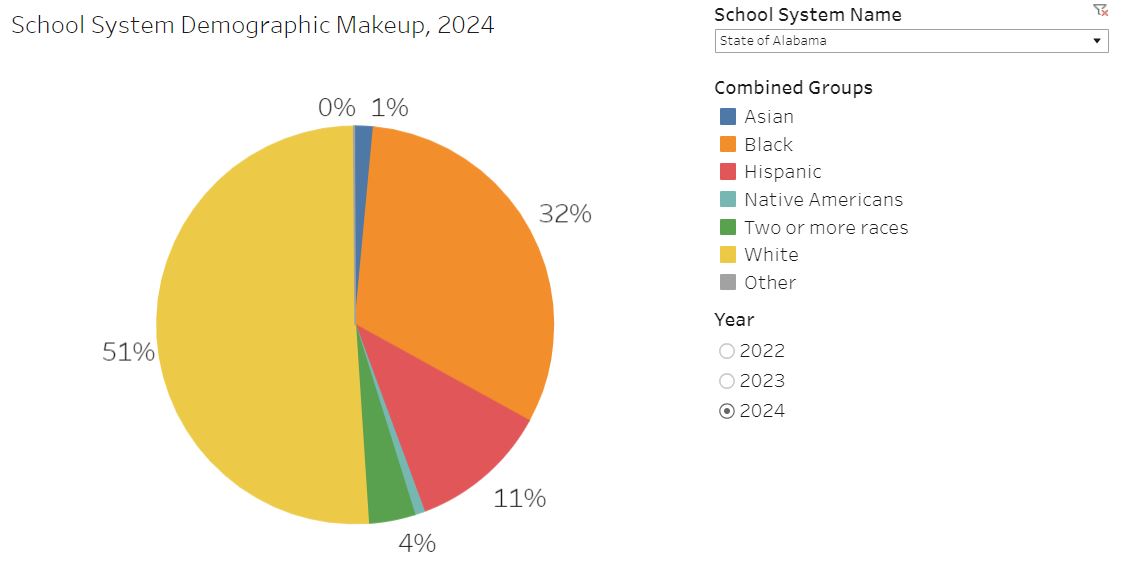
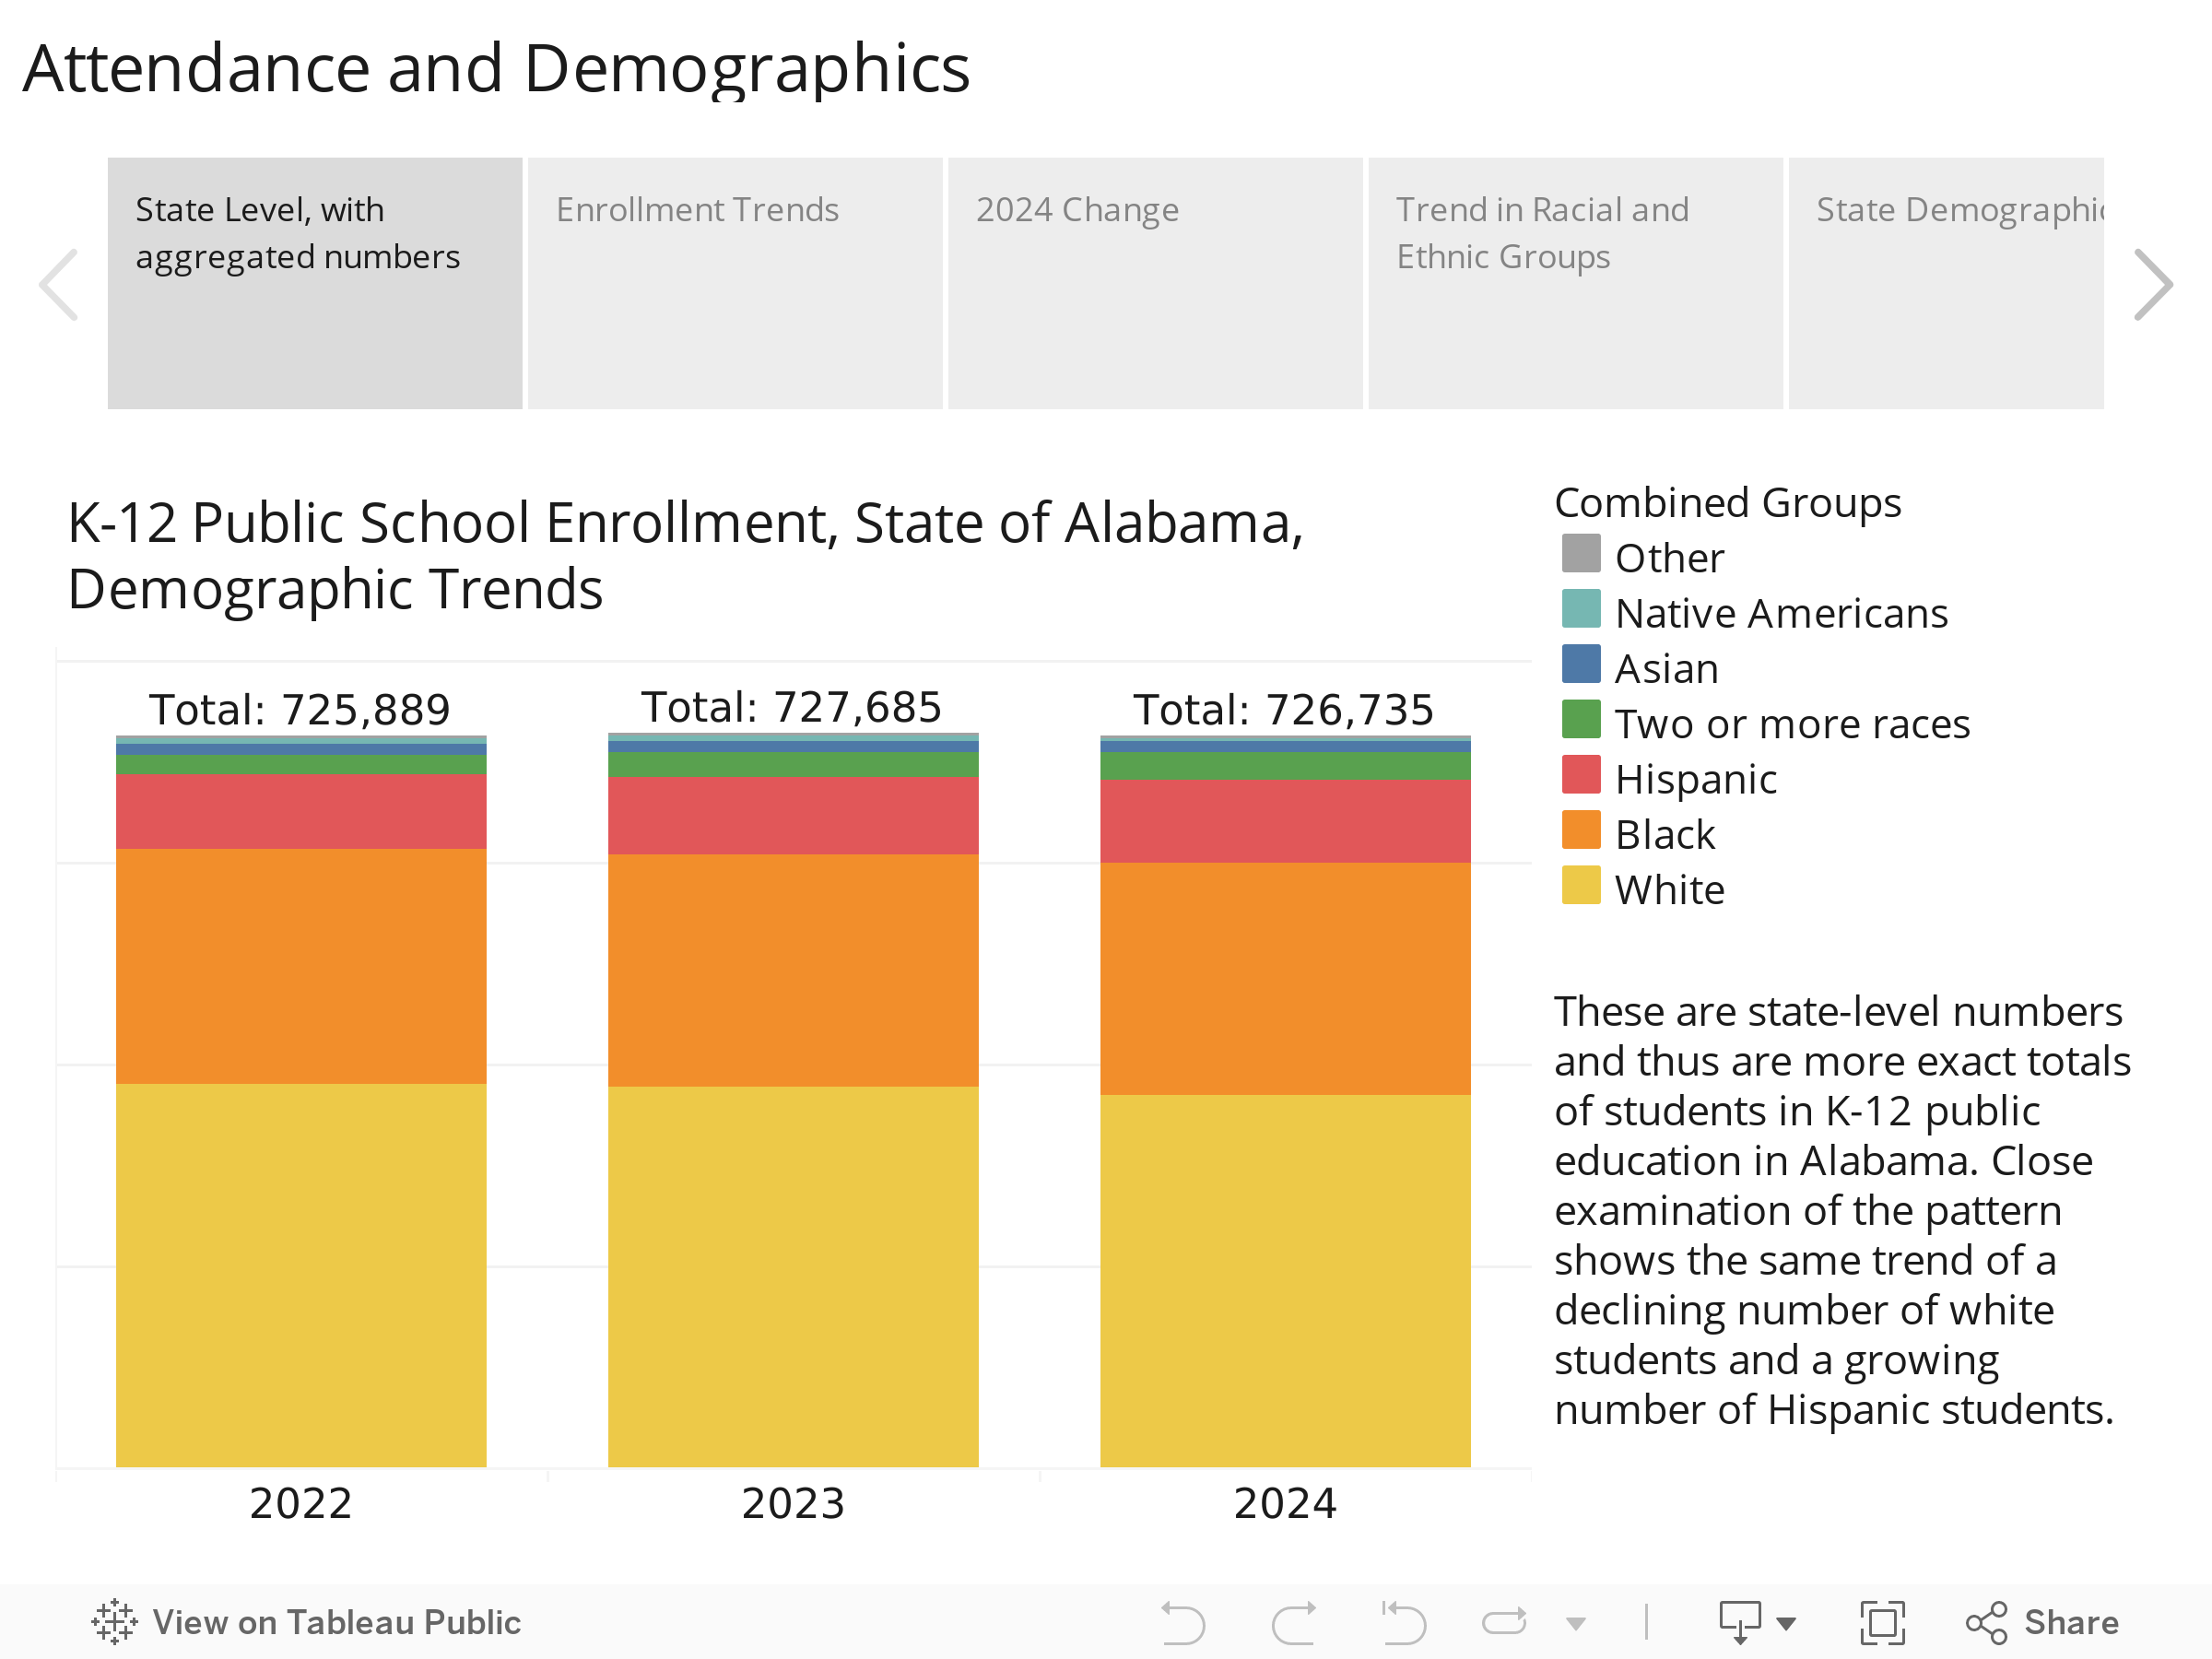
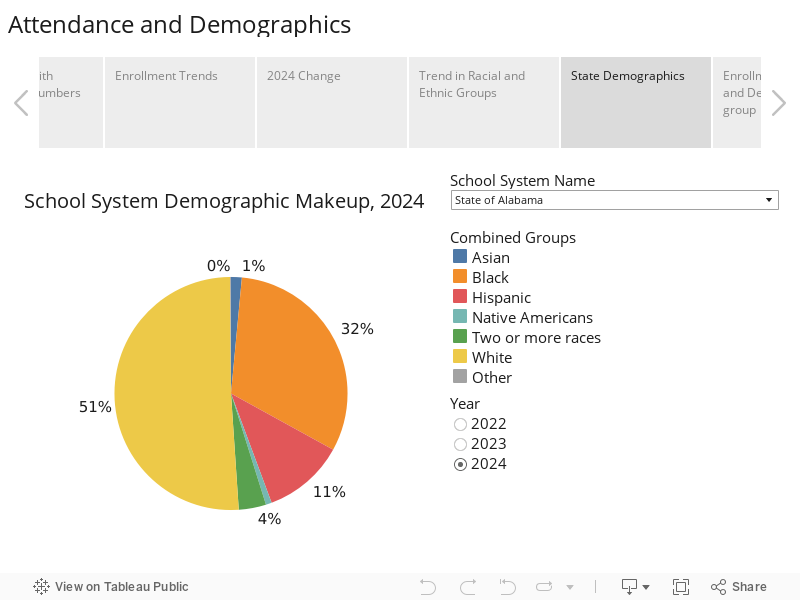
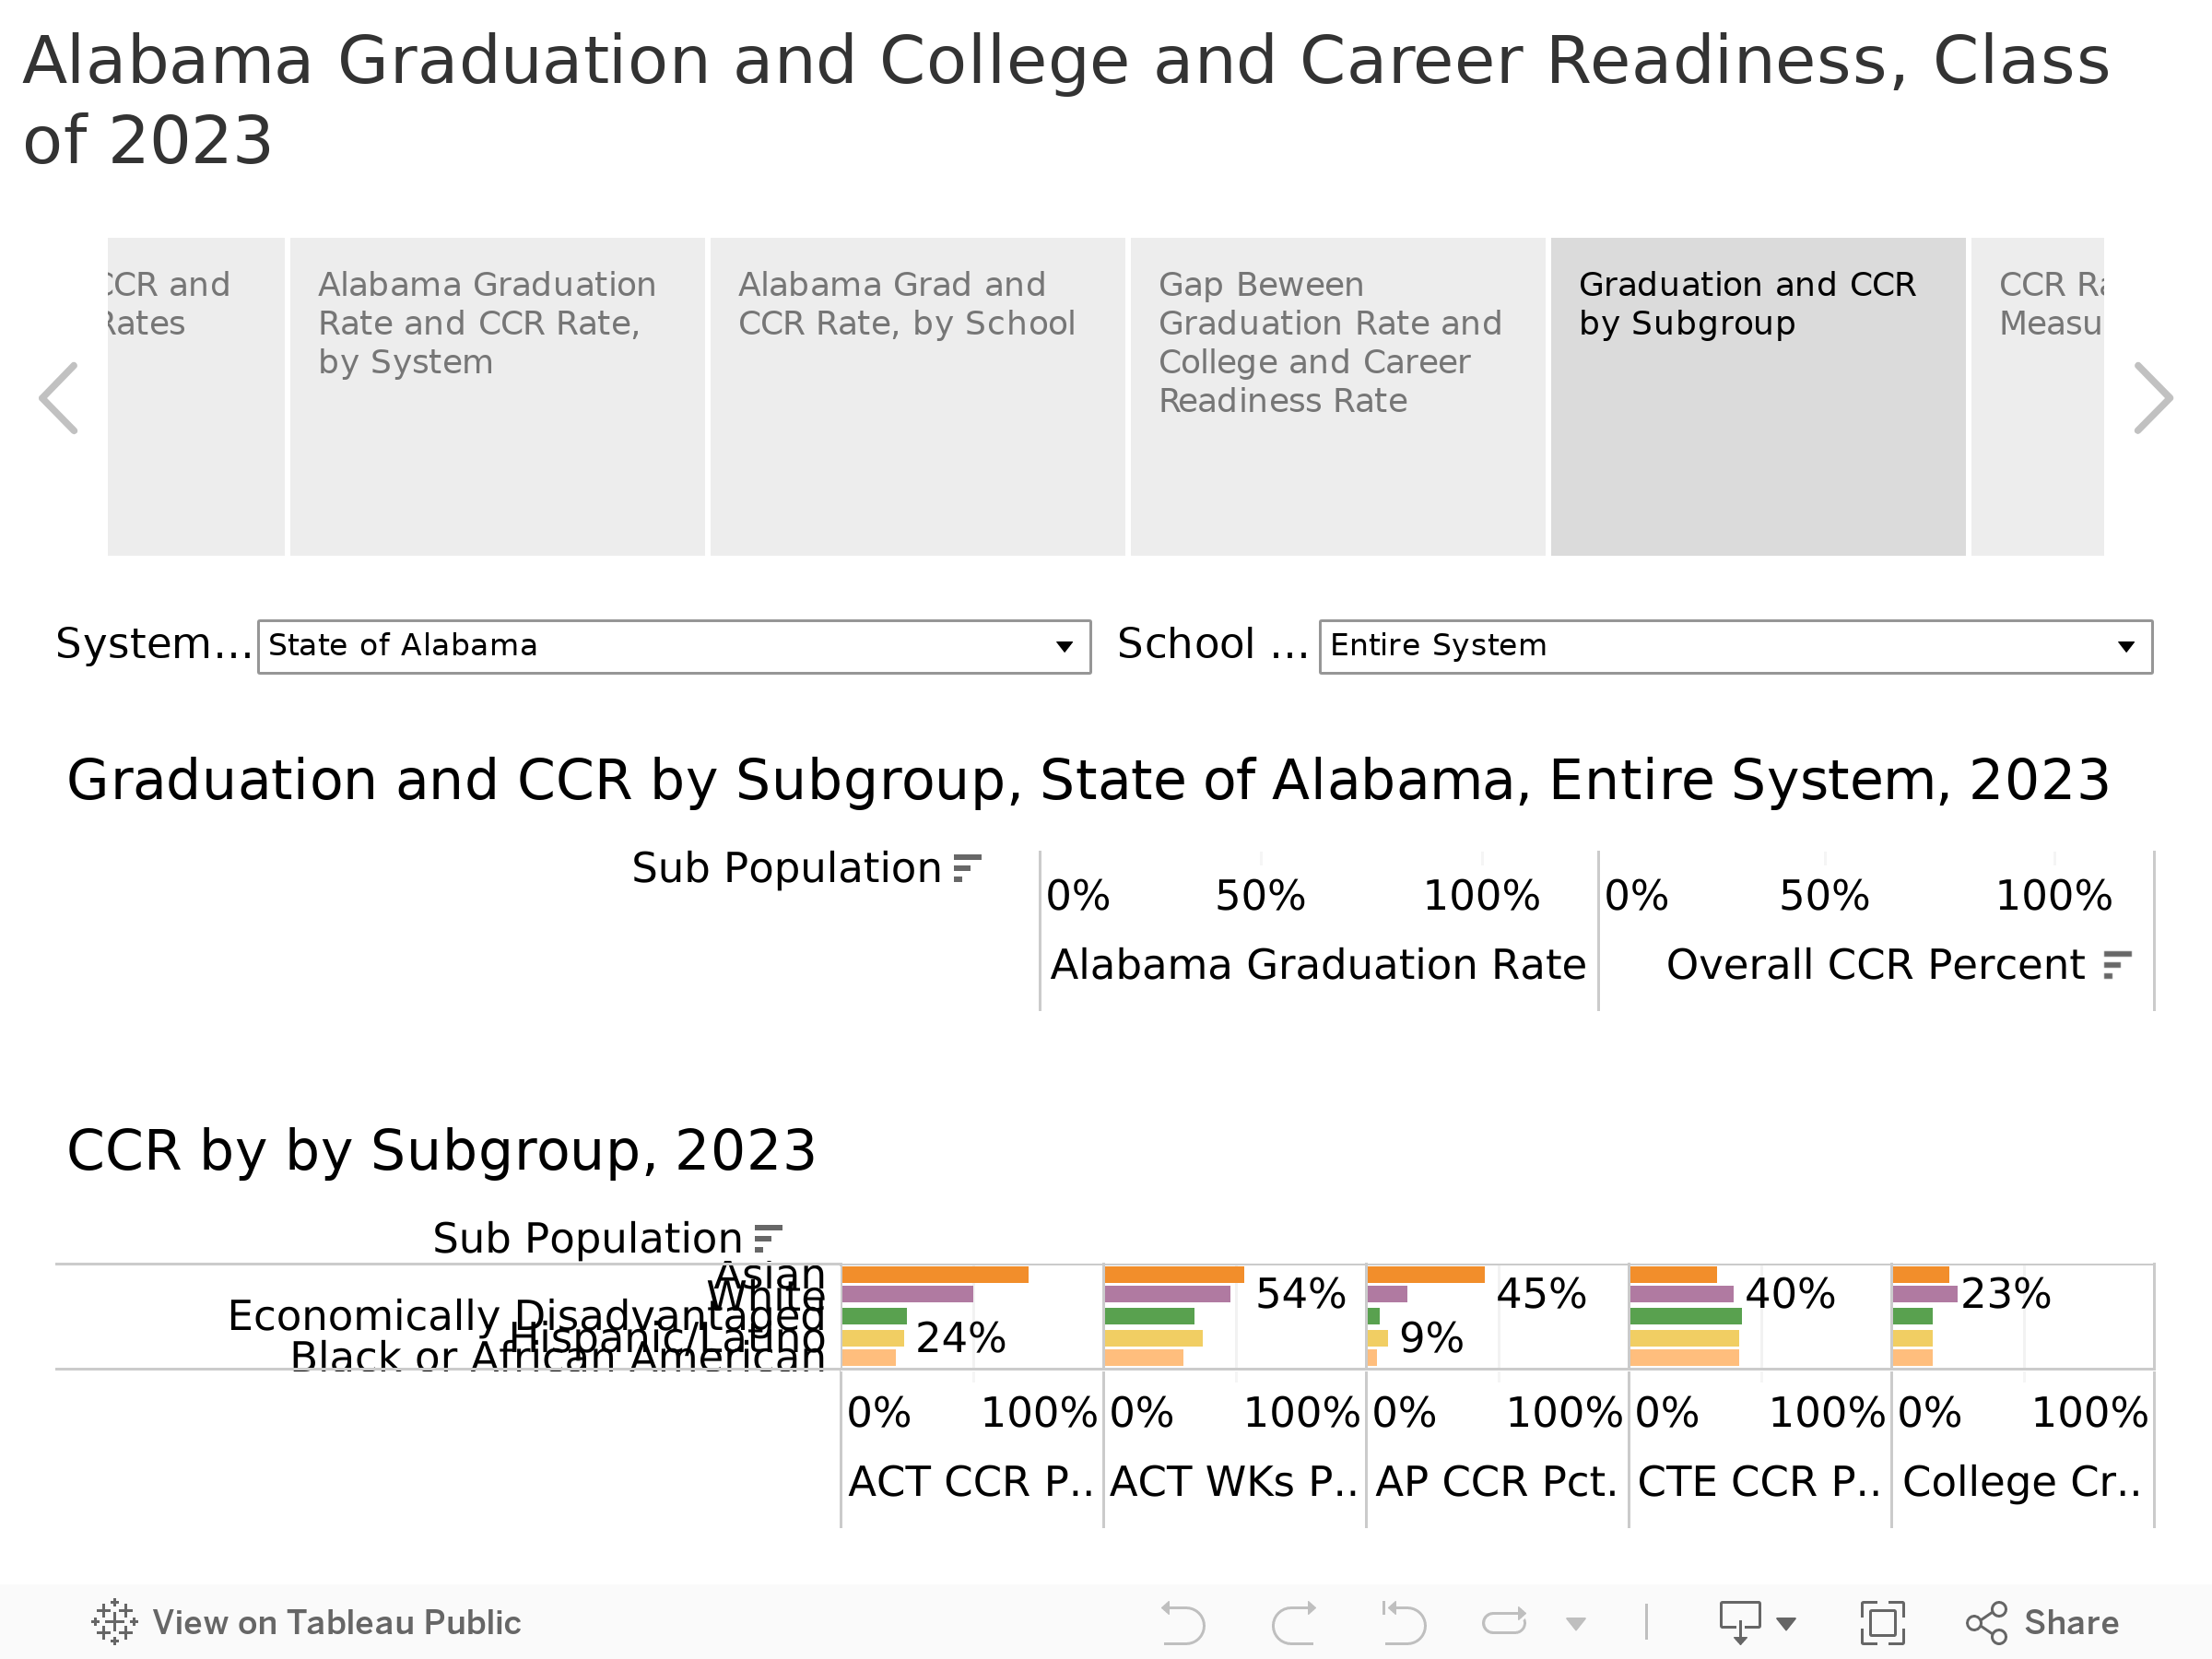
The gaps in graduation rates between subgroups within the school population are relatively narrow: 93% of White students graduate compared to 89% of Black Students and 87% of Hispanic students. Gaps are wider when it comes to college and career readiness: 89% of White students graduate college and career-ready, but only 76% of Blacks and 79% of Hispanics do. Looking at the individual CCR measures, the gap between Blacks and Whites is highest in the percentage of students benchmarking on the ACT. It’s narrowest in terms of the percentage of students earning credit through career technical education. In that category, Black and Hispanic students have a higher CCR rate than Whites.
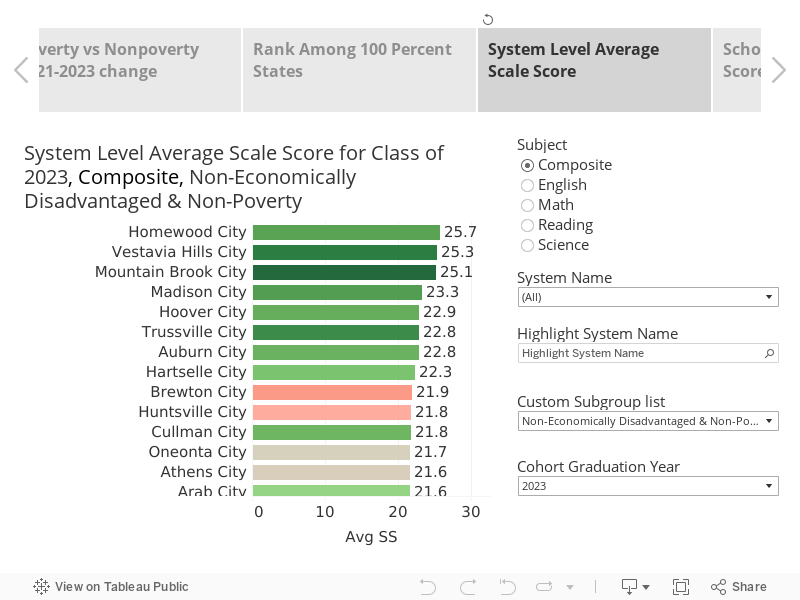
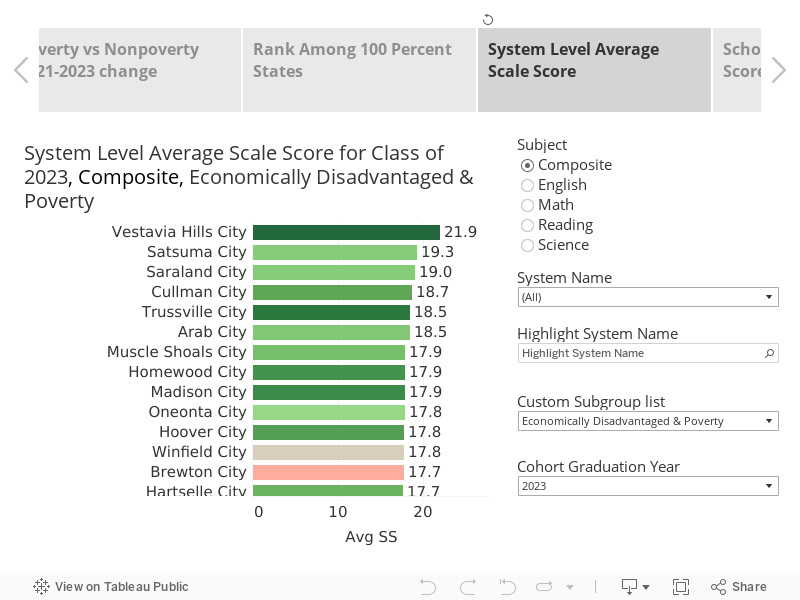
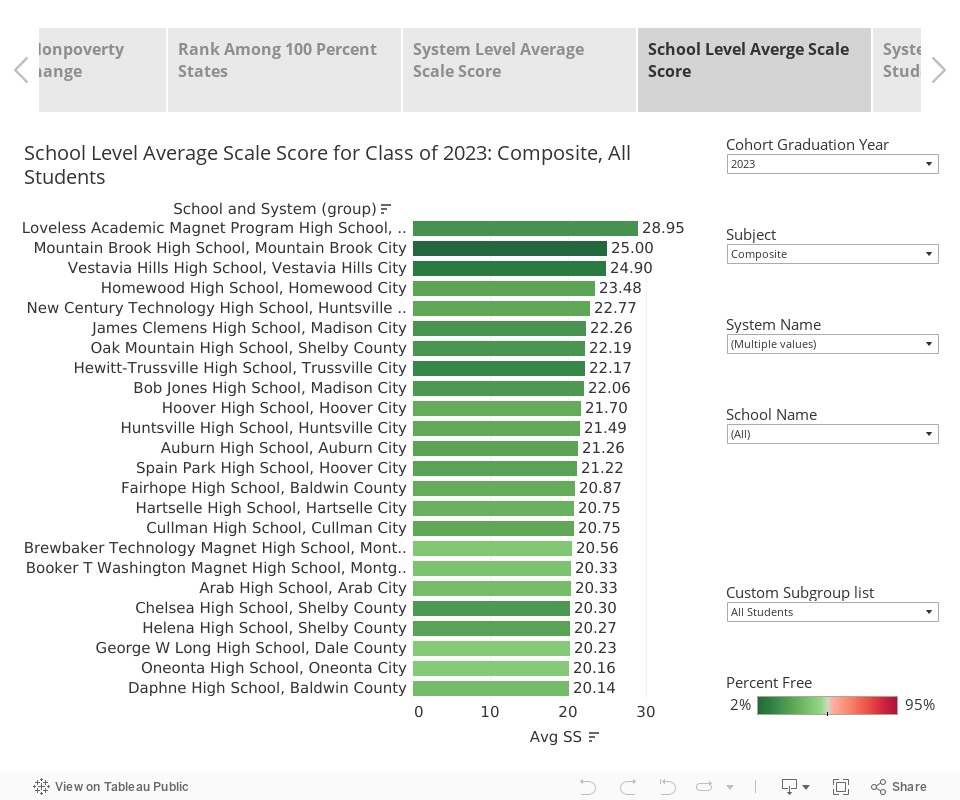
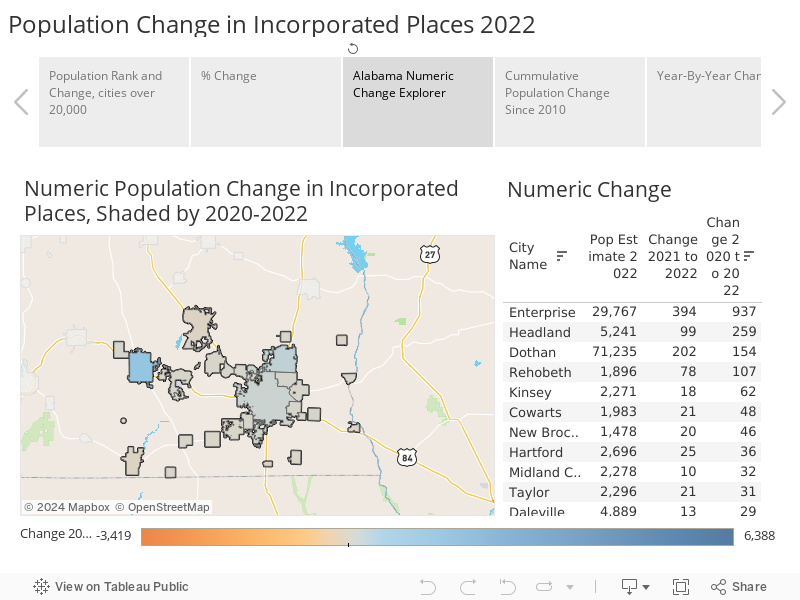
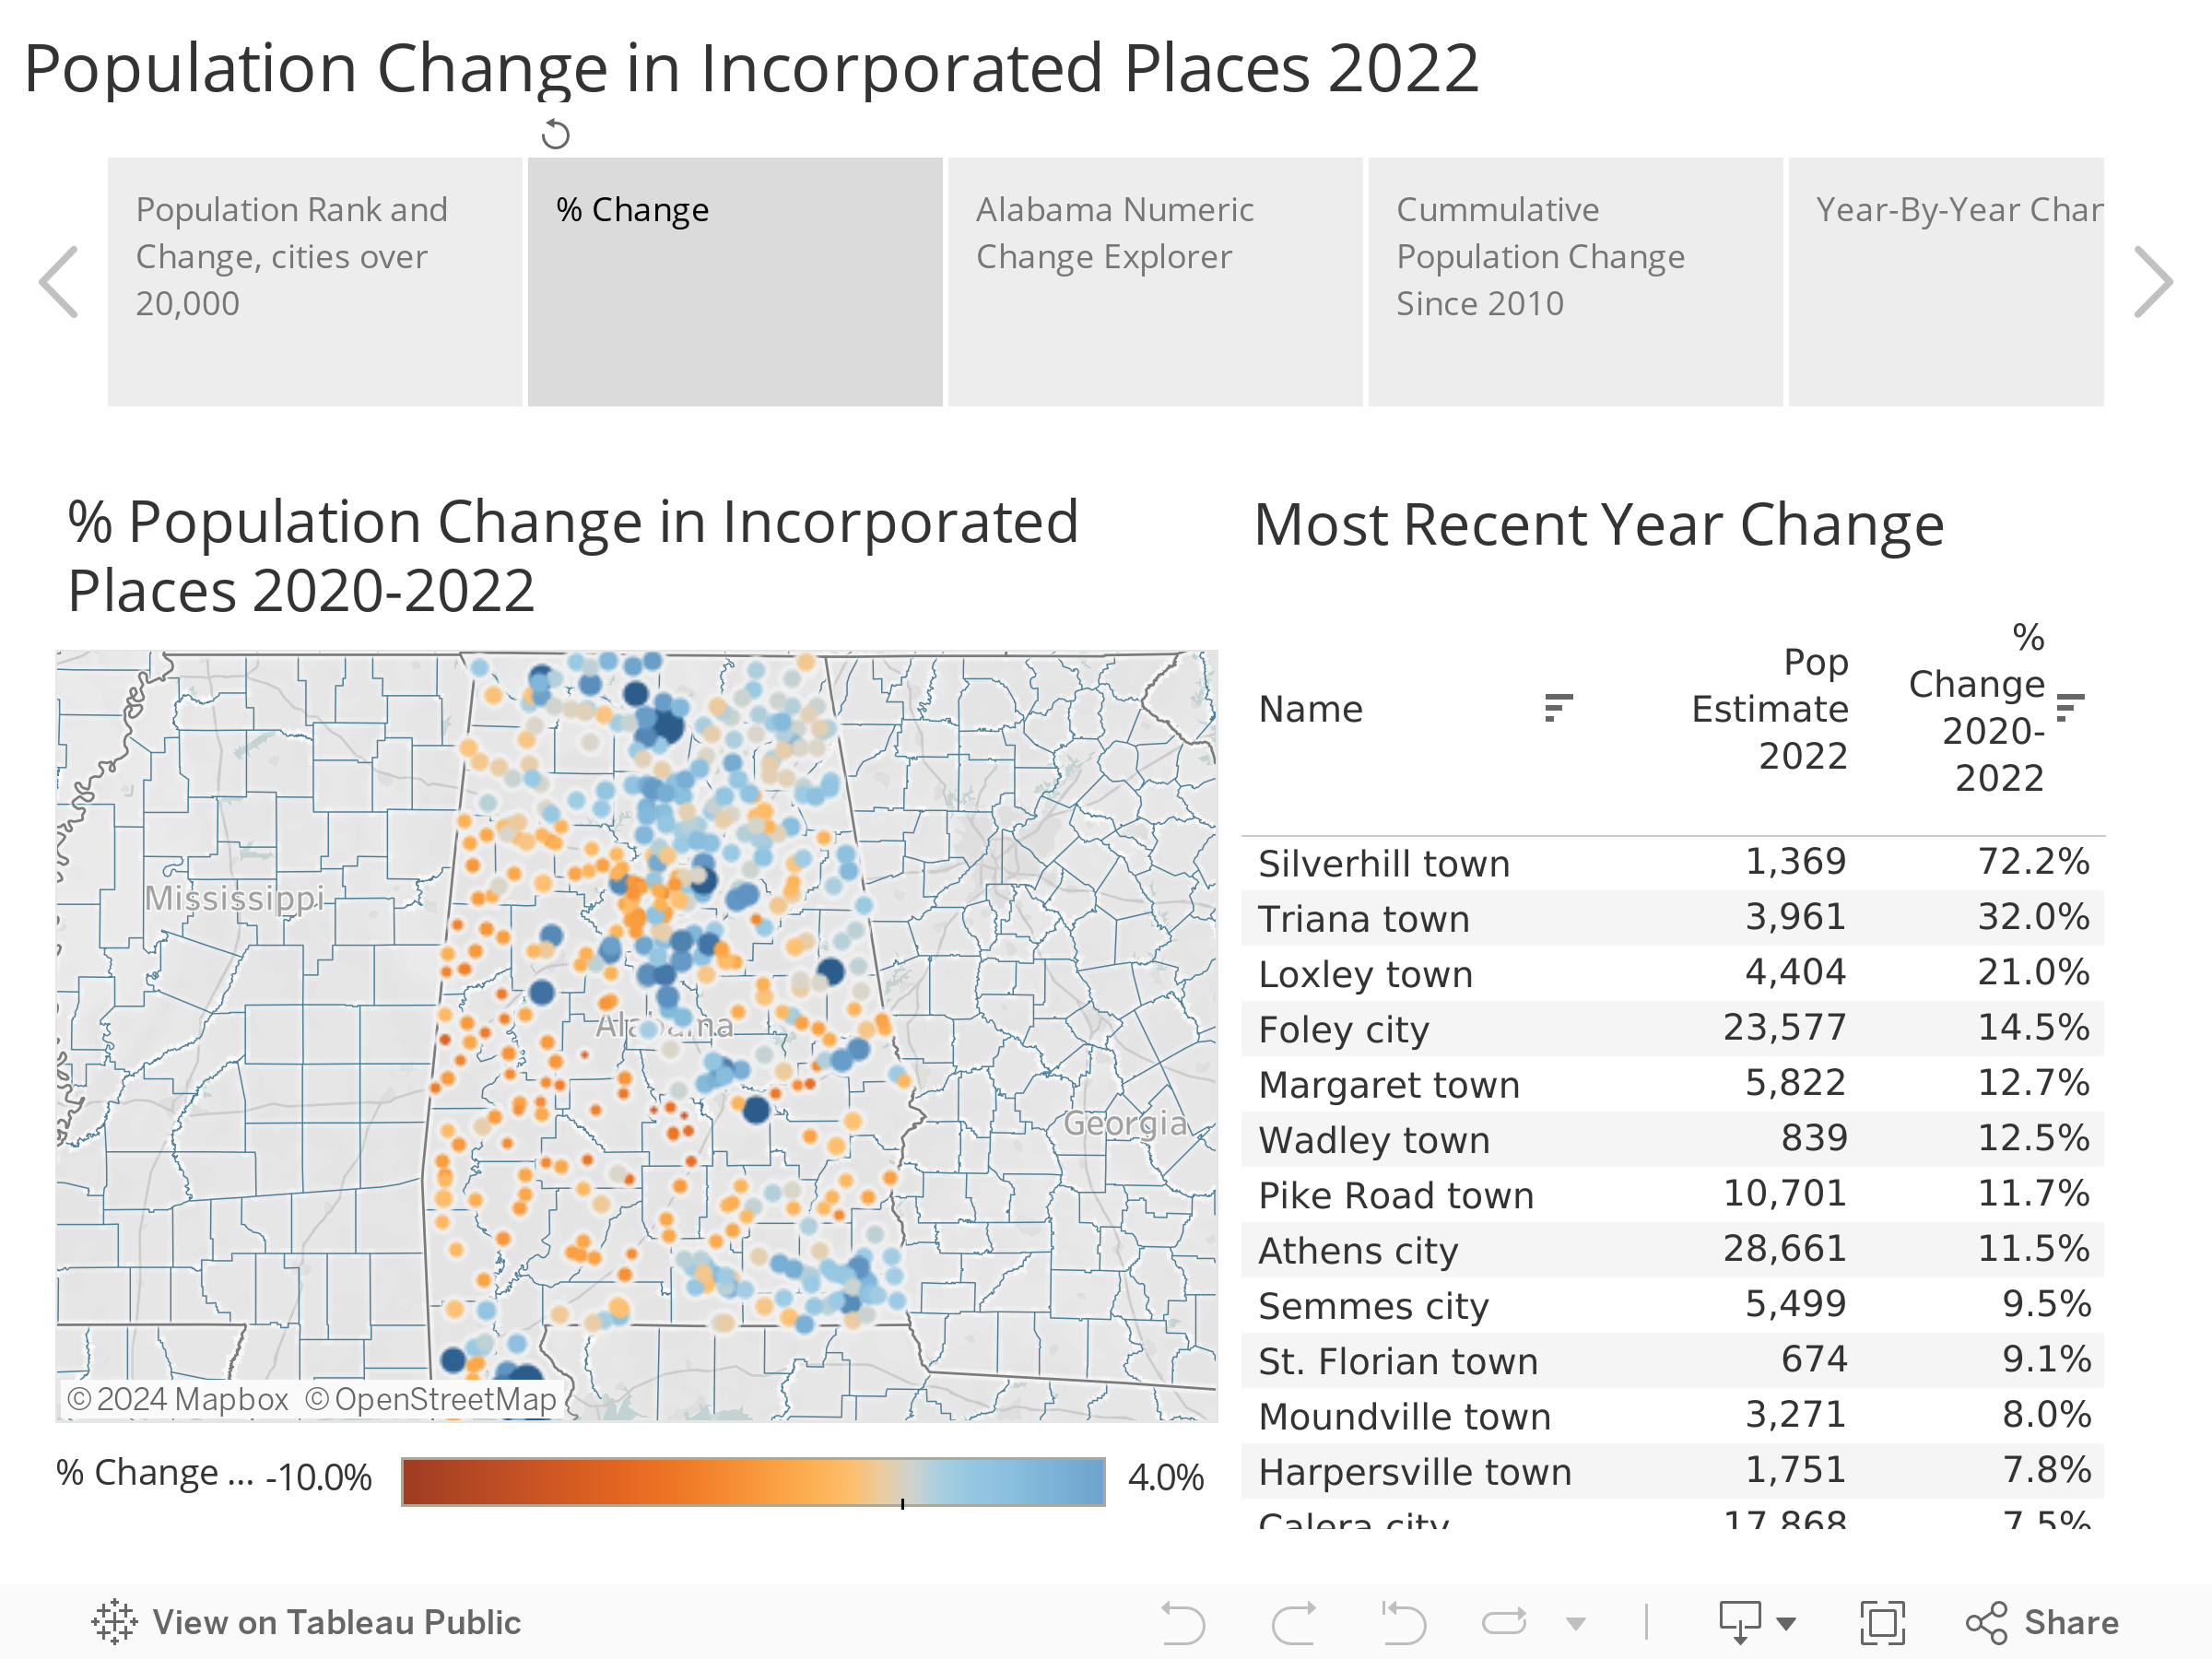
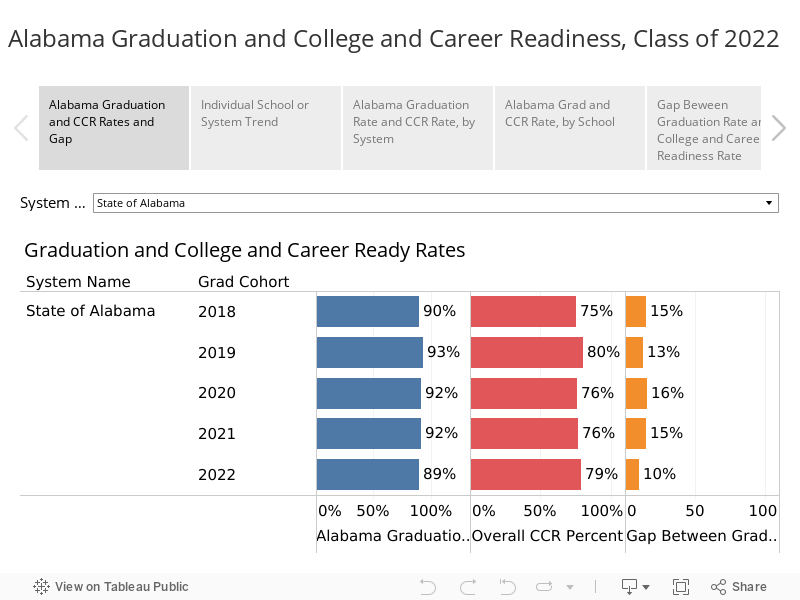
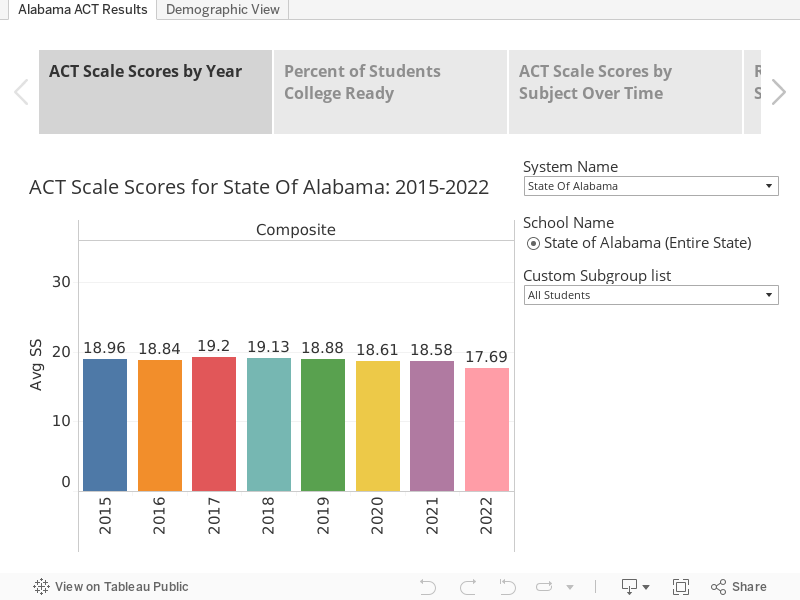
Using the tabs and menus in the visualization, you can explore the results for individual schools and school systems.
Please consider supporting PARCA. A contribution to PARCA is an investment in our state’s future. As a 501(c)3, charitable contributions allow PARCA to maintain its independence and ability to provide non-partisan support to communities throughout the state. All donations are tax deductible.