With graduation season now upon us, new data allows us to look back at statistics for last May’s public high school graduates, Alabama’s Class of 2021.
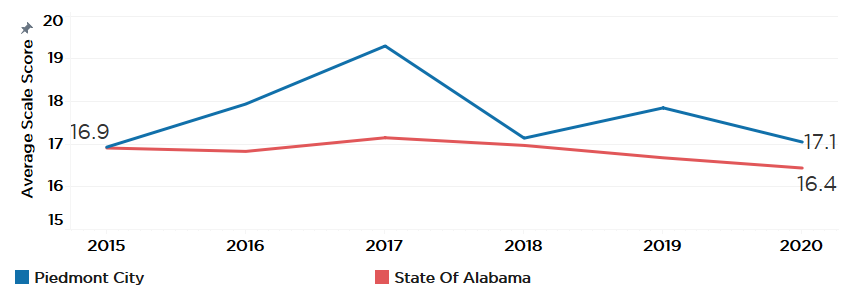
In 2021, 92% of seniors graduated on-time four years after starting in 9th grade, maintaining the high rates Alabama public schools have posted in recent years. However, only 76% of seniors were certified as college and career-ready (CCR), a gap that state leaders are calling on schools to close.
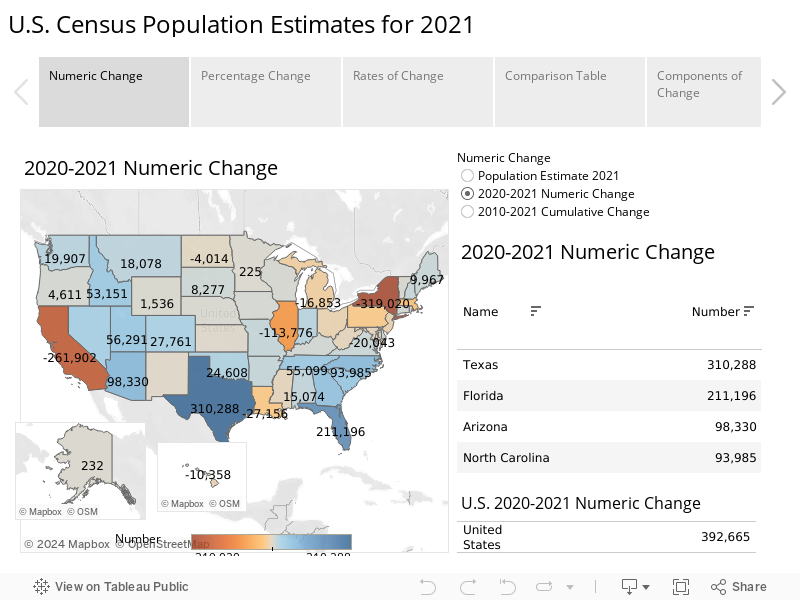
Percentage Change in the College and Career Readiness Measures
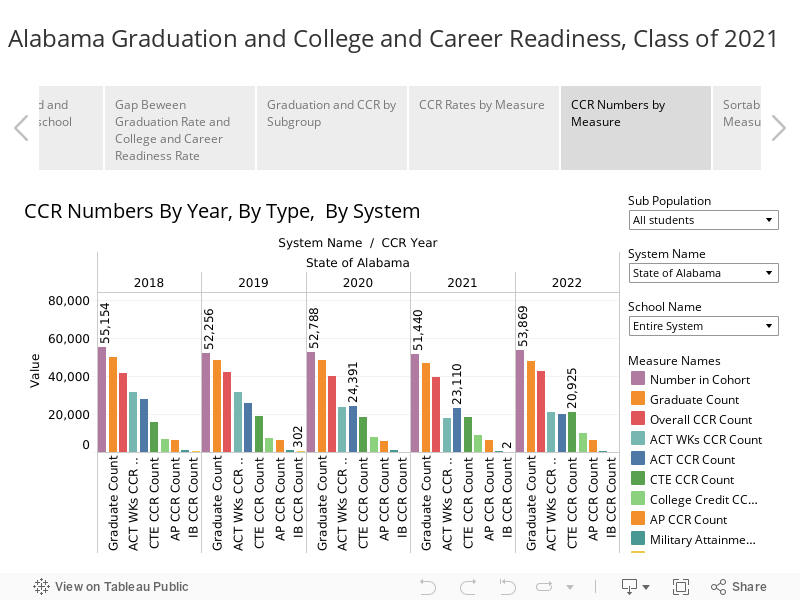
The results of 2021 should be considered in the context of the Covid-19 Pandemic. This graduating class saw in-person instruction end in March of their junior year. For their senior year, the 2020-2021 school year, the amount of time students spent in-person at school varied by district. While the graduation rate remains close to its historical high point, the college and career readiness rate remains below the level it reached in 2019. That’s not necessarily a bad thing. Measures of college and career readiness must be honest and meaningful measures. There are seven ways a student can demonstrate college and career readiness.
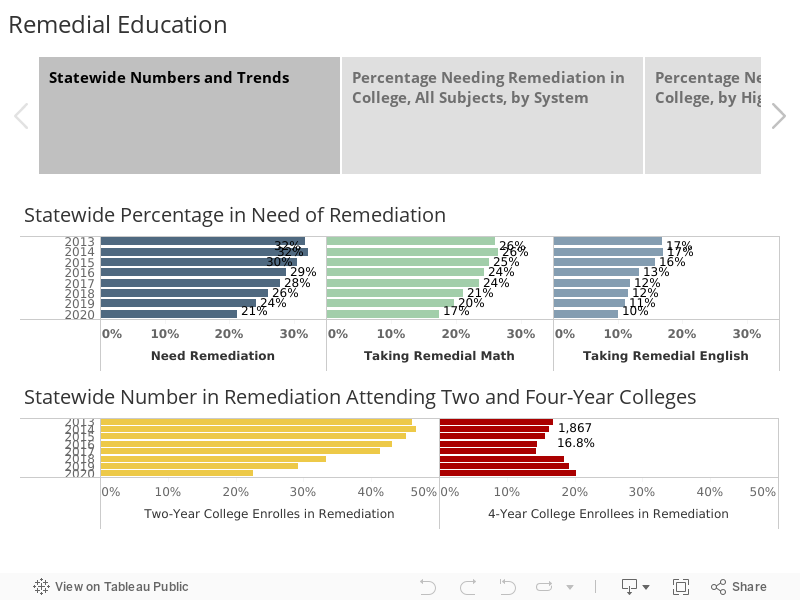
1. Earn Credit Through a College: a higher percentage of students earned college credit while in high school in 2021: 17%. That’s the highest percentage ever, up from 15% in 2020. These courses, also known as dual enrollment, tend to be taken through a local community college but can also be through a university. The student must successfully complete the course and earn credit to qualify as CCR.
2. Earn a Qualifying Score through Advanced Placement: AP courses are taught in a high school but have the rigor and approach of college courses. In 2021, 12% of students qualified as CCR through AP, which is tied for the highest percentage ever. To count as CCR, a student has to score three or higher (out of 5) on the national end-of-course test, a level at which a college might award college credit.
3. Earn an Industry Recognized Credential through Career Technical Education: 36% of students earned an industry-recognized credential through career technical education in 2021. These credentials result from taking work-oriented courses offered at high schools or K-12 career tech centers. At 36%, the Class of 2021 was only slightly behind the 37% of students recorded for the Class of 2019. After a rapid jump in CCR attainment in recent years, there has been an increased focus on the quality of the industry credentials that count toward career readiness. The credential has to be tied to a student’s course of study. Also, the credential should be valued in a career field that is in demand in the regional job market. This screening for the quality of the credential may hold down growth in numbers in the short term, but it should improve value for the student and the economy.

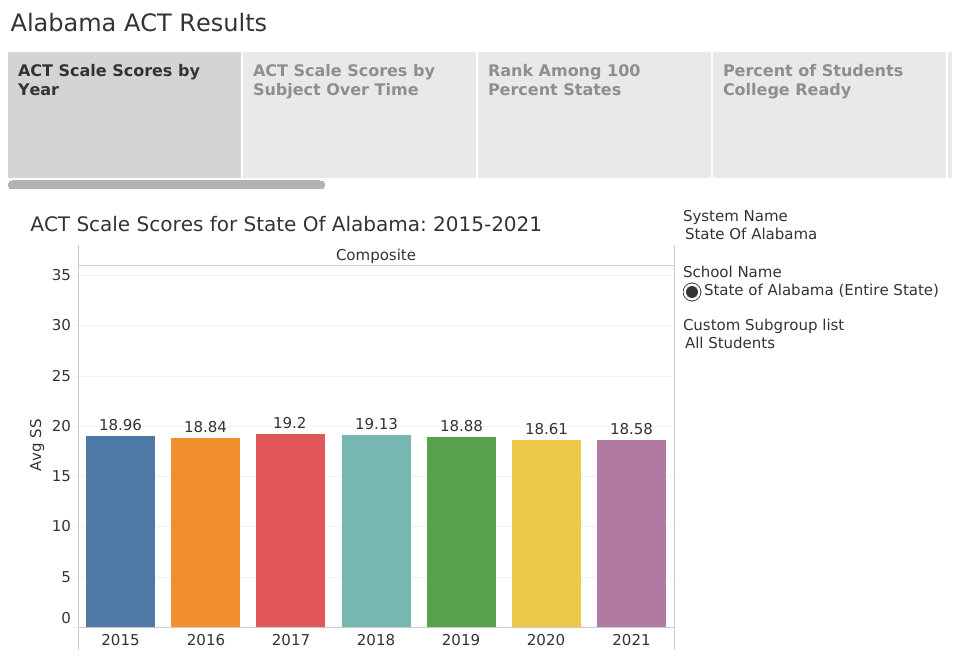
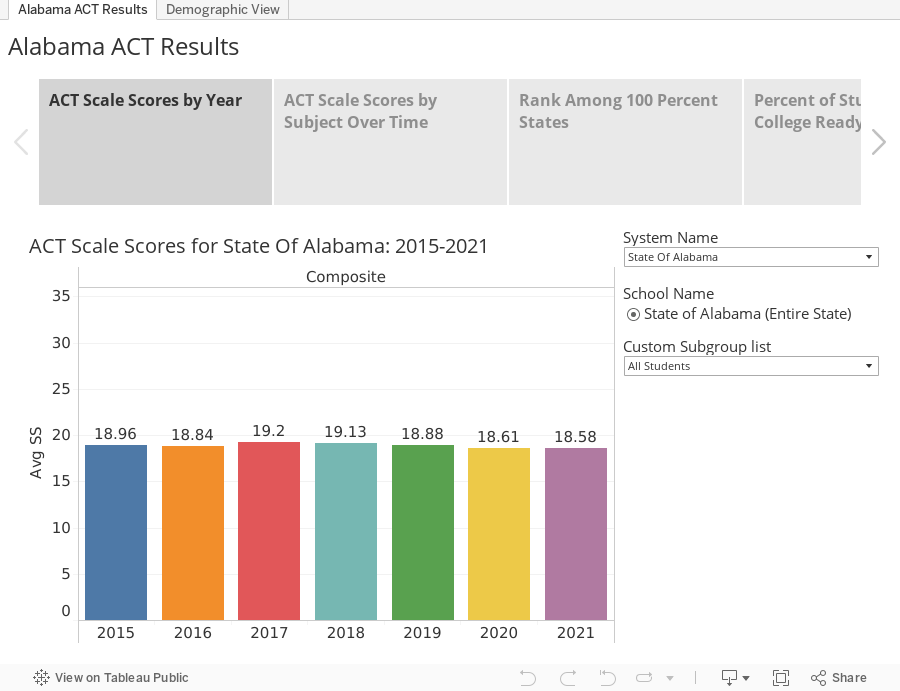
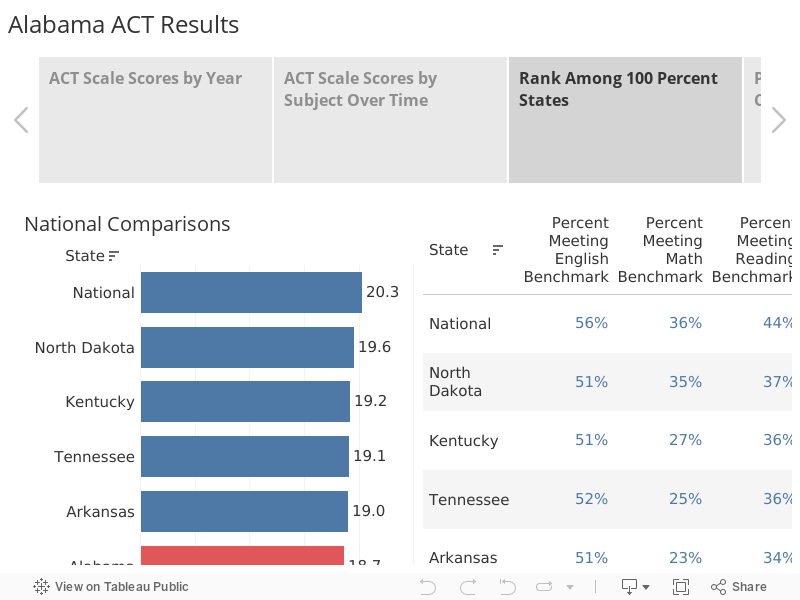
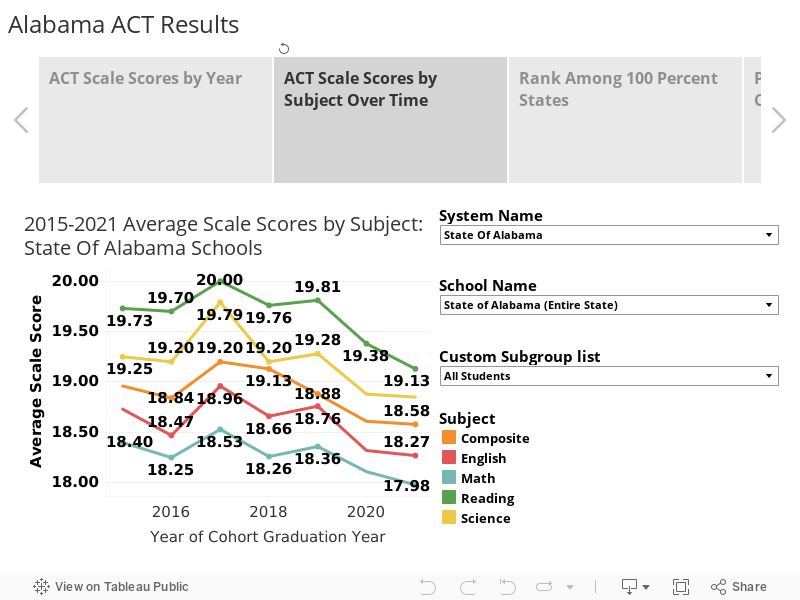
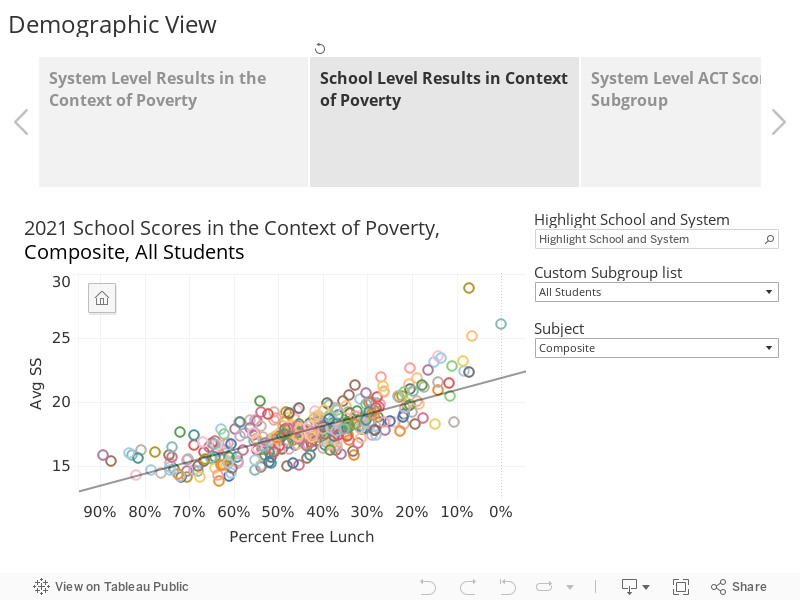
4. Earn a benchmark score in a subject test on the ACT: The percentage of students scoring at or above the college-ready benchmark on the ACT was down by 5% in 2021, to 45%. A student scoring above the benchmark has a 50% chance of earning a B or above and a 75% chance of making a C or above in that course in college. Covid disruptions may have had some bearing on students’ ability to prepare for and take the ACT, which tests readiness for success in college.
5. Earn a qualifying score on WorkKeys: Over the past two years, there has been a significant drop in the number and percentage of students earning CCR through ACT’s WorkKeys test, a standardized test designed to measure whether students have the math and communication skills expected in workplaces. WorkKeys is no longer required, and, in many systems, students who have already demonstrated college and career readiness by another means opt-out. (More on WorkKeys results below)
A lower percentage of students gained admission to the military or earned college credit through an International Baccalaureate course, options six and seven, in 2021 than in previous years.
Numerical Change
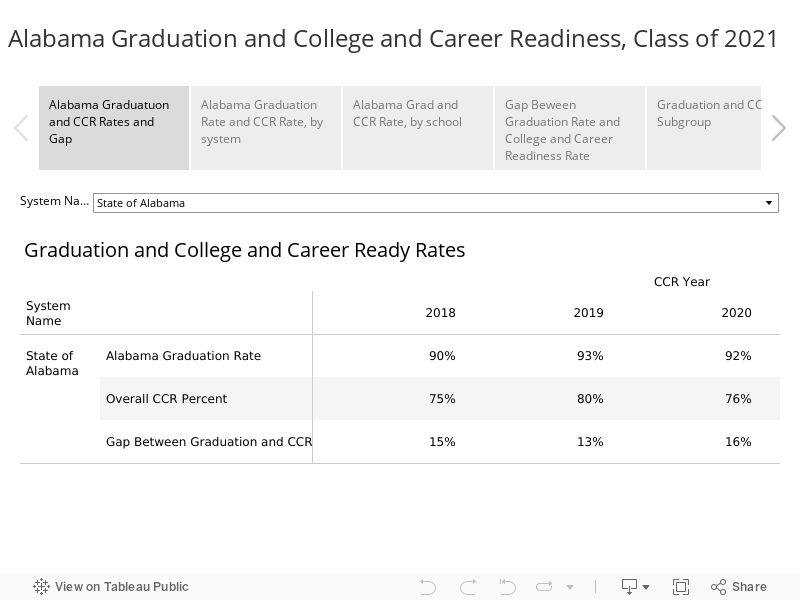
While the graduation and CCR rates are stable, fewer students are progressing through Alabama public schools. The rising generation, Generation Z, is smaller than the previous generation, The Millenials. Consequently, the number of college and career-ready high school graduates is declining. Despite little or no change in the graduation or CCR rate, 1,336 fewer students graduated from Alabama public schools and 646 fewer students graduated ready for college and career. In light of the ongoing elevated demand for skilled workers, Alabama must focus on graduating every student with the skills needed to succeed in higher education and/or the workplace.
School and System Results
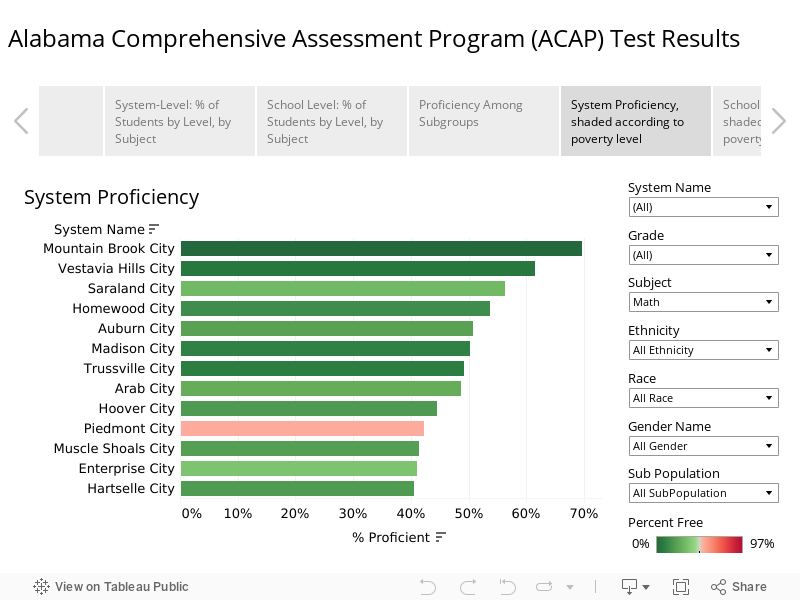
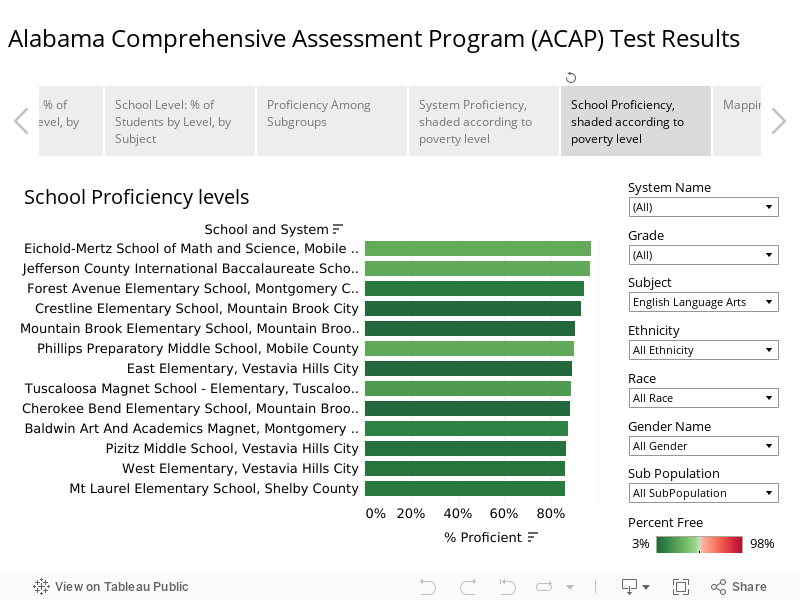
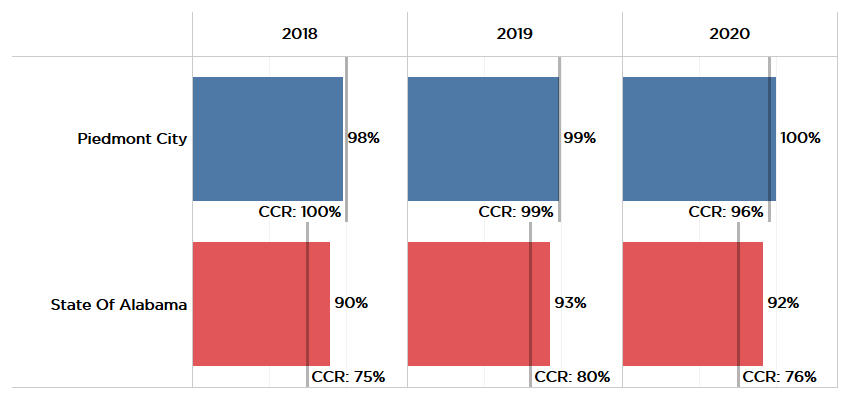
One system, Piedmont, and two dozen high schools reported a 100% on-time graduation rate for the Class of 2021. Eight high schools reported both 100% graduation and 100% CCR rate. In some schools, a higher percentage of seniors demonstrated college and career readiness than graduated.
On the other hand, nine schools had graduation rates below 75%. Thirty high schools had CCR rates below 50%. Twenty-six school systems had a gap greater than 25% between their graduation rate and the college and career readiness rate. In those systems, more than a quarter of students receiving diplomas hadn’t demonstrated their readiness for college or work, despite having met Alabama’s requirements for obtaining a high school diploma.
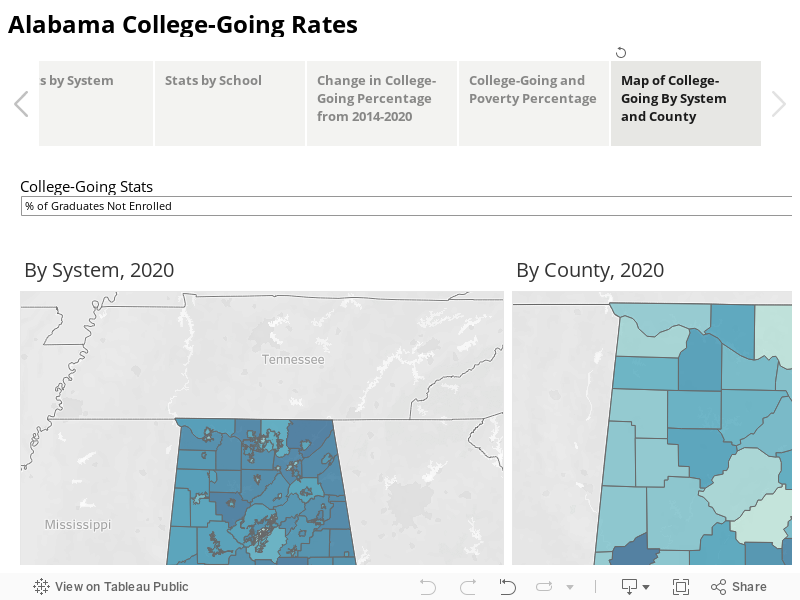
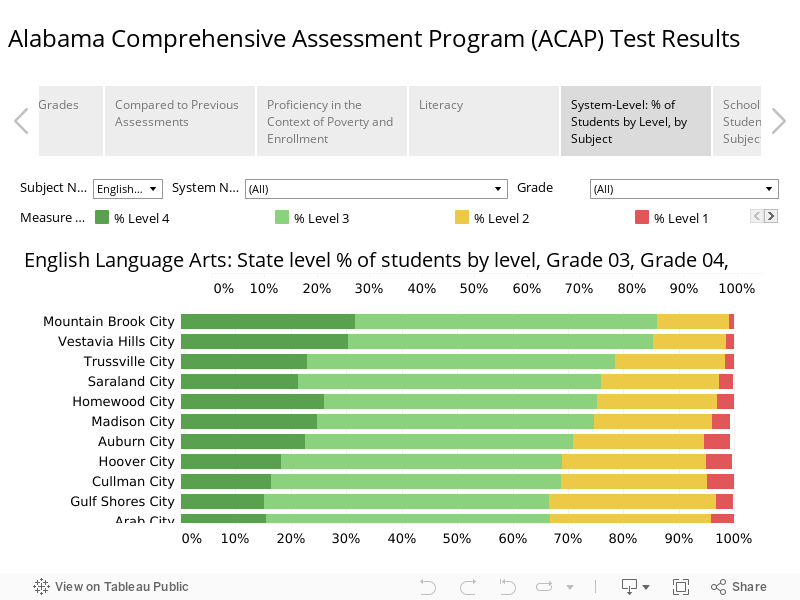
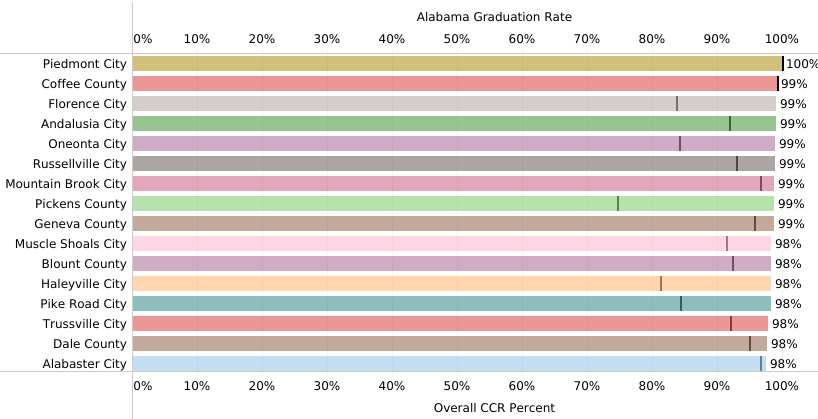
In the visualizations below, school systems and schools can be sorted by either graduation rate or college and career readiness rate. The solid colored horizontal bar represents the graduation rate; the short vertical bar represents the CCR rate. Through the tabs above the visualization, other data is accessible, including a graph of the gap between the graduation and CCR rate by system.

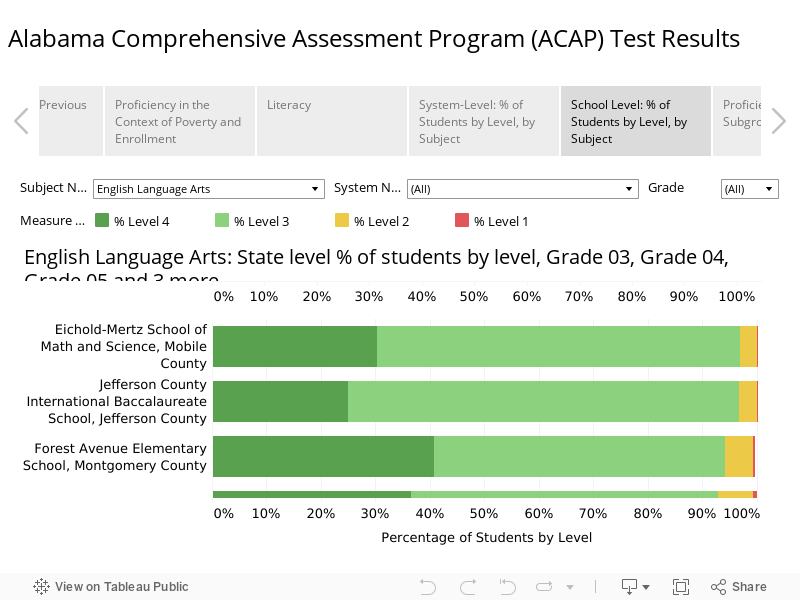
The same set of sortable data is available by school. In order to protect student privacy, results for small subpopulations of students are not presented.

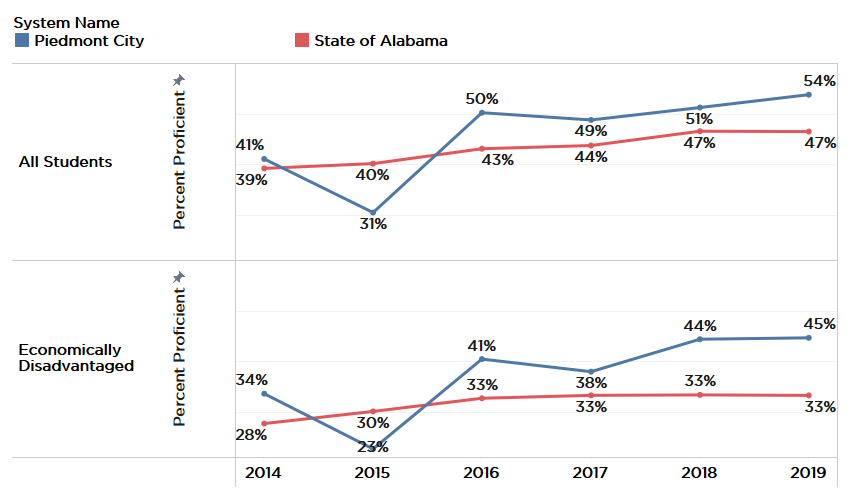
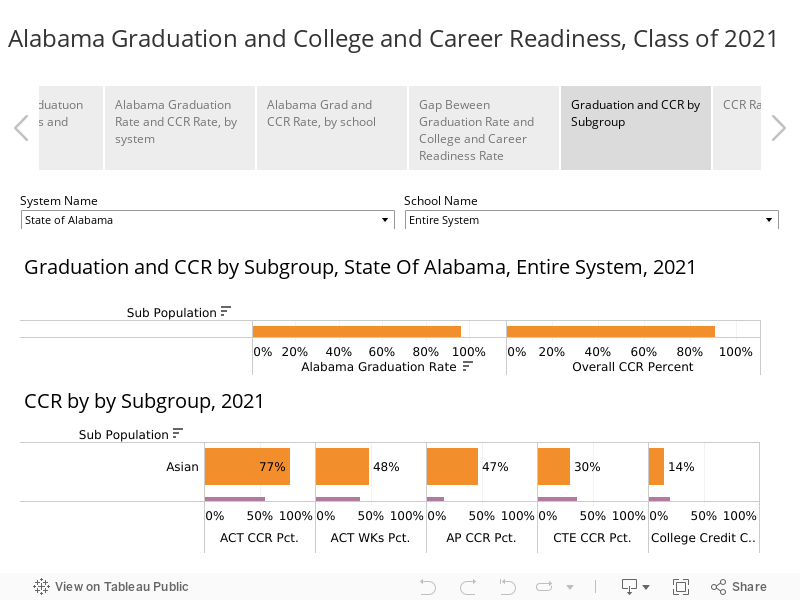
Gaps Between Subgroups
Historically, there have been gaps in the high school graduation rate between students of different races. In recent years, those gaps have been largely eliminated. However, the gaps persist in college and career readiness rates. Black and Hispanic CCR rates trail those of whites and Asians. CCR rates for economically disadvantaged students are well-behind those of non-economically disadvantaged students. Examining the subcomponents of CCR, the gap is widest on the ACT, with only 24% of Blacks and 30% of Hispanics benchmarking in a subject on the ACT, compared to 55% of whites. Asians are much further ahead, with 77% of Asian students earning a benchmark score. By contrast, there is almost no racial gap in college and career readiness rates in career technical education: 35% of Black students earned an industry-recognized credential through CTE compared to 36% of whites and 38% of Hispanics.
WorkKeys
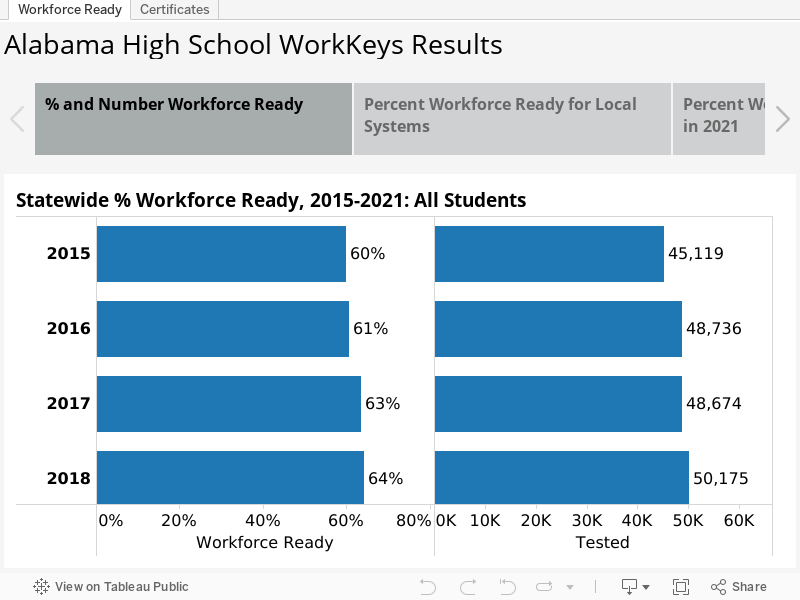
While still valued by many school systems, students, and employers, ACT’s WorkKeys test is no longer a universal comparative tool. After 2018, the Alabama Department of Education stopped requiring the test to be given to all students. That has led to significant drops in the number and percentage of students taking WorkKeys. In 2018, over 50,000 students took the test; in 2021, fewer than 35,000.
WorkKeys tests math, reading, and graphical literacy skills as they are employed in the workplace, in contrast to ACT, which tests for knowledge and skills needed in a college classroom. Businesses who build WorkKeys into their hiring practices know what a WorkKeys score means. They have determined what level of proficiency, as measured by WorkKeys, is needed in particular jobs. Students earn either a platinum, gold, silver, or bronze National Career Readiness Certificate, depending on their test performance. A student scoring Silver or above is considered college and career ready. In a normal job market, employers, particularly industrial employers, use WorkKeys in the applicant screening process.

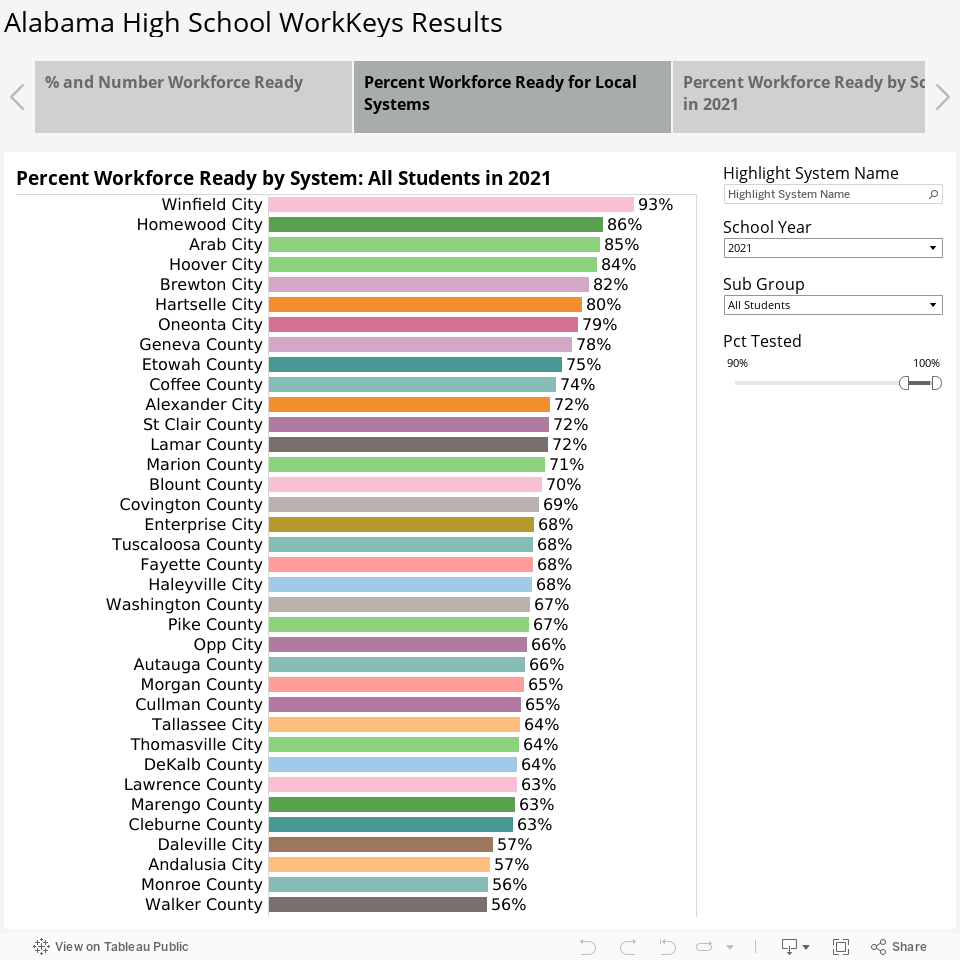
In 2021, 59% of Alabama high school students who took WorkKeys scored Silver or above, indicating they had the foundational math and communication skills needed in most workplaces. That’s down from 66% when all students were required to take the test. Many school systems now make WorkKeys available to students who haven’t qualified as CCR on another measure.
The visualizations that follow present WorkKeys results statewide and in systems where more than 90% of seniors took the test. The percentage of students scoring Workforce ready are those that score Silver or above.
The visualization below presents the results in a more detailed fashion. Each color represents the percentage of tested students scoring at each level: platinum, gold, silver, bronze, and no certificate earned.