Due to a new higher standard, the number and percentage of third graders who failed to meet the grade-level reading benchmark rose in 2025. However, taking the higher standard into account, this year’s third graders showed continued improvement, indicating that the state’s focus on improving early grades literacy is continuing to pay dividends.

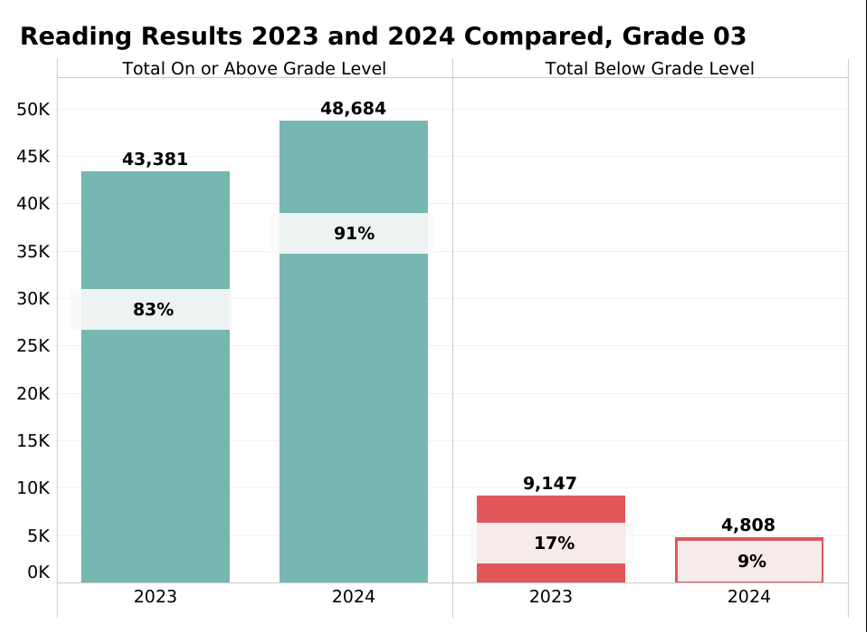
This spring, 11.6% of students failed to reach the benchmark on the Reading portion of the state’s standardized test, the Alabama Comprehensive Assessment Program (ACAP). Had the higher bar been in place in 2024, 13.7% of 3rd graders would have scored below the cut. In 2023, 20.8% of 3rd Graders would have scored below the cut.
In 2025, more students, 49,460, cleared the bar despite the higher standard. At the same time, more students, 6,470, fell below the reading sufficiency benchmark. The 2025 cohort of third graders is larger than previous years. That could mean more students will be required to repeat third grade. However, students who scored below the benchmark are offered intensive summer instruction, retesting, and alternative ways to qualify for promotion.
Improved performance
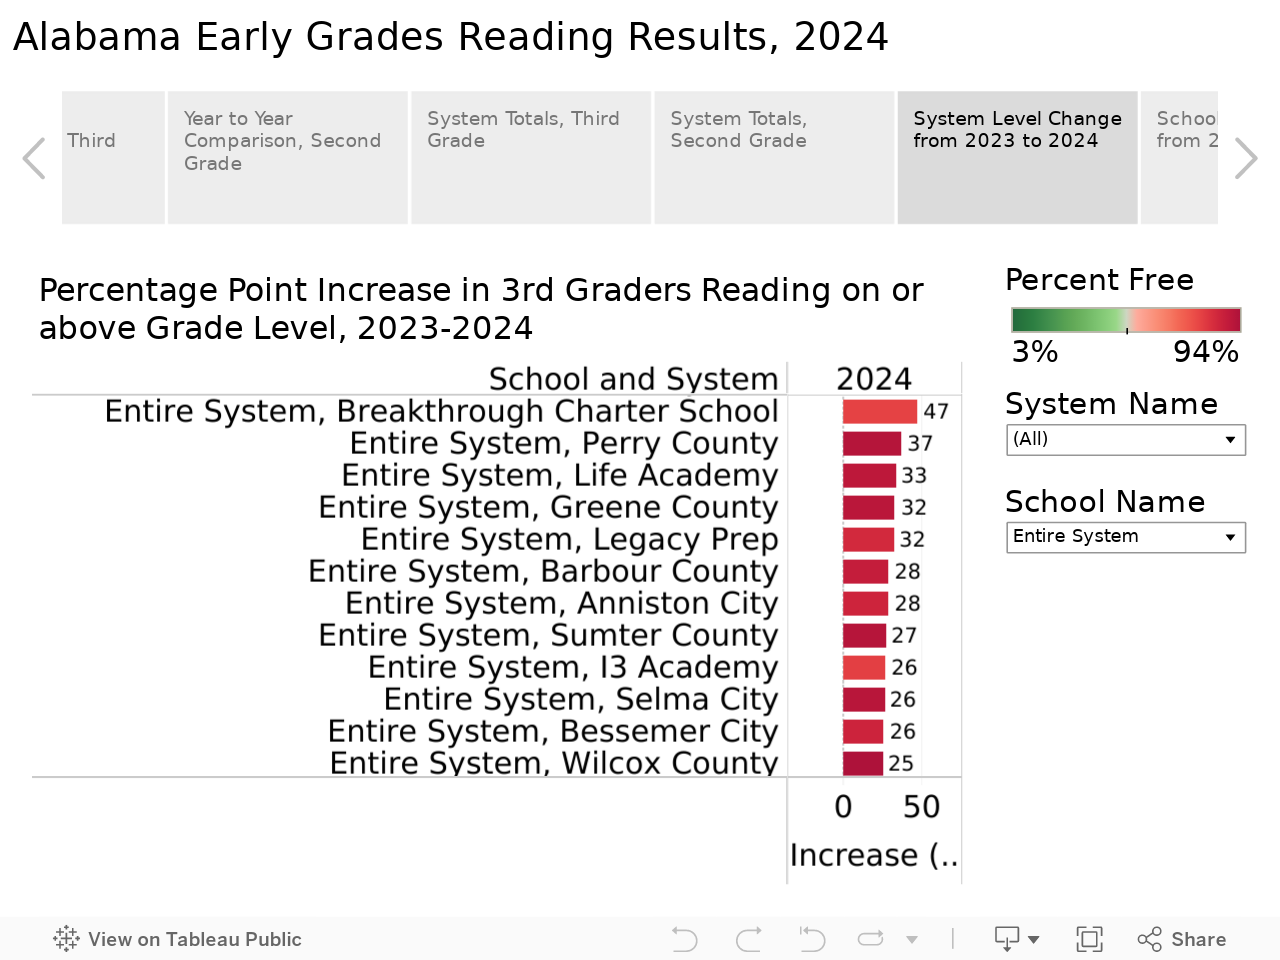
For the second year, the biggest gains in the percentage of third graders clearing the reading benchmark have occurred predominantly in rural school systems in the Black Belt. Those systems have high rates of economic disadvantage among students and have traditionally trailed other systems on various academic measures, but they have been making gains in reading.

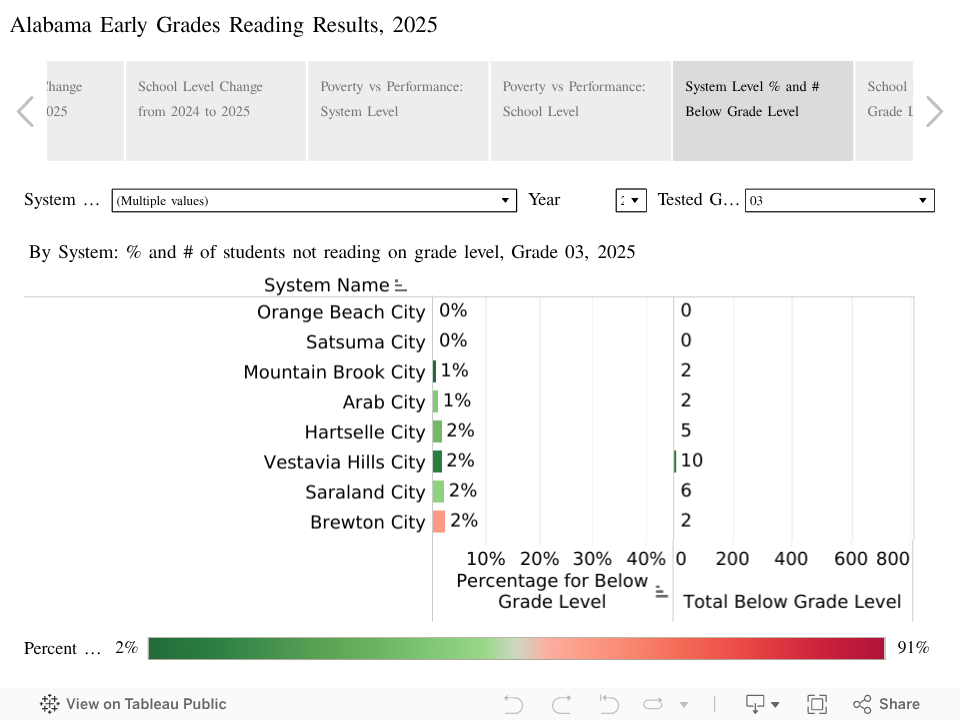
This year, only 4% of Wilcox County students scored below grade level. That puts the system in the top 20 for performance, even though 91% of students in Wilcox County are economically disadvantaged.
Two systems, Orange Beach and Satsuma, had all their tested third graders reading on grade.
Breaking the Connection Between Poverty and Poor Reading Performance
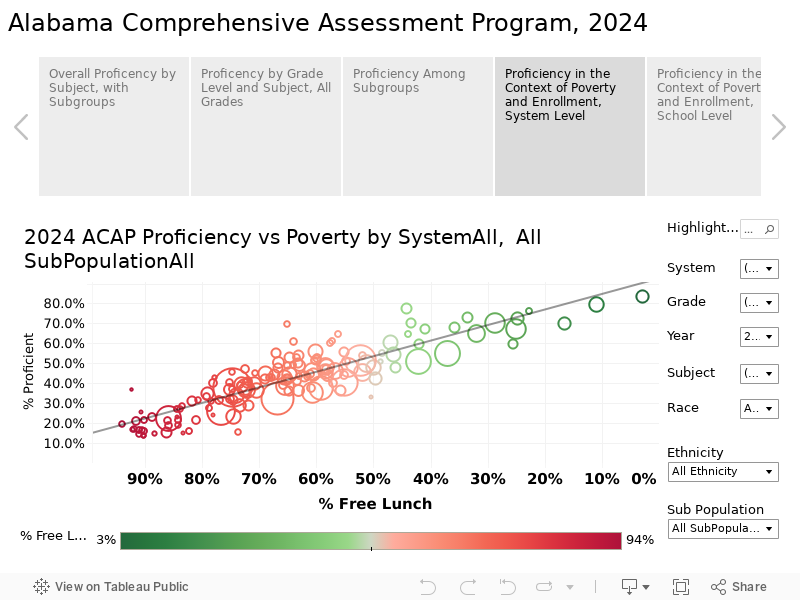
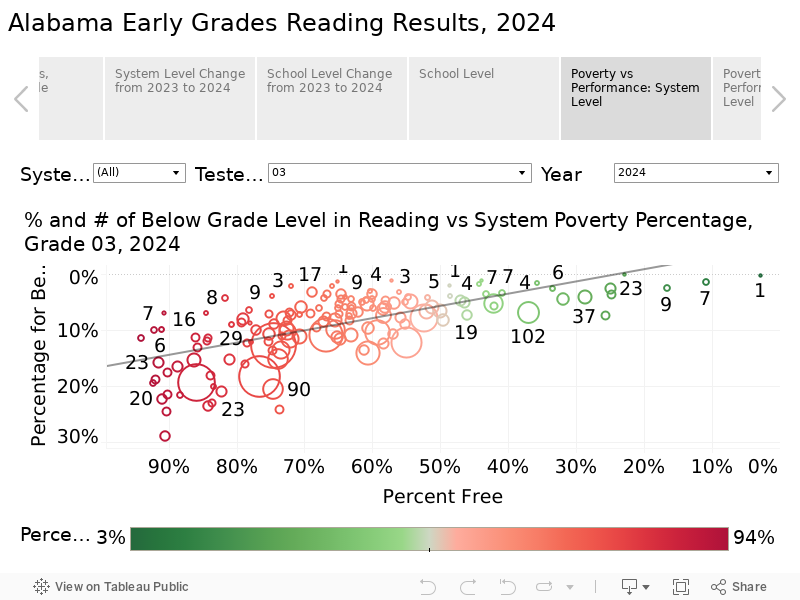
While there is still a correlation between higher levels of economic disadvantage and high rates of reading struggles, the relationship has gotten weaker over time, with more high-poverty systems, particularly in rural areas, improving performance.
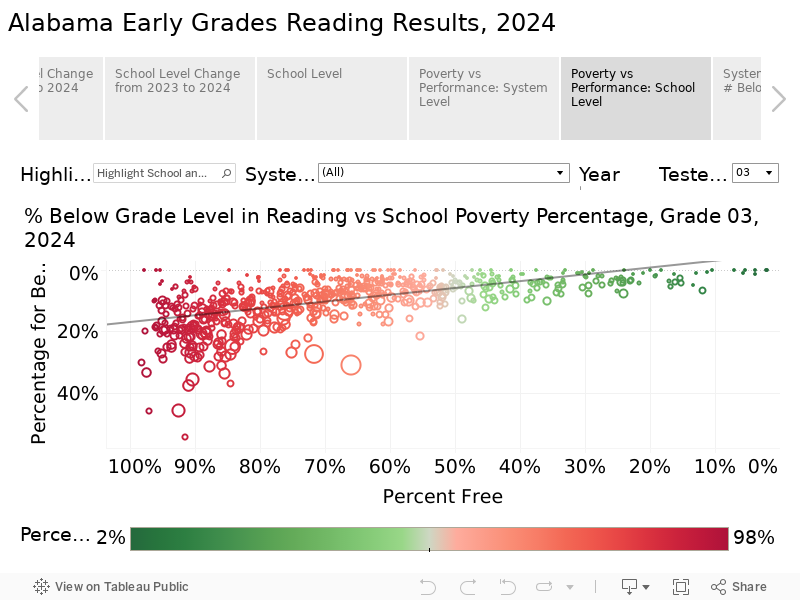
Other high-poverty systems, often in urban areas, are still struggling to close the gap. Large urban systems like Montgomery County and Birmingham City have higher concentrations and larger numbers of students testing below grade level. However, those systems also have magnet schools where all students achieved the reading benchmark. Within larger school systems, schools with similar demographics vary significantly when it comes to reading results.
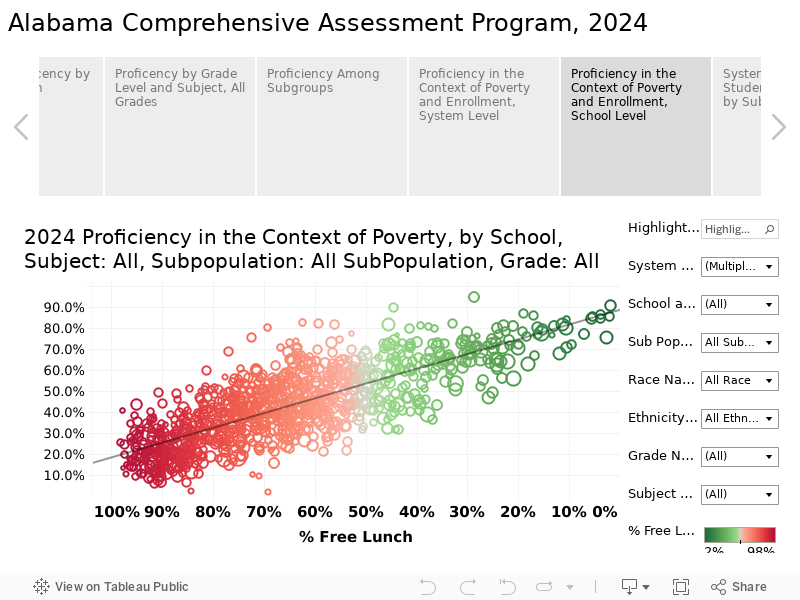
The scatterplot chart below compares the percentage of students in the school who are below grade level on reading to the percentage of students from economically disadvantaged households. The higher on the chart a system is, the better its reading performance. The systems shaded green and lying to the right are schools with lower economic disadvantage. The size of the system’s circle corresponds to the number of third graders who failed to achieve the reading benchmark.

Schools
Despite the higher bar, in 42 schools, all third graders who were tested passed the reading benchmark. That included Princeton Elementary in the Birmingham system and three schools in the Montgomery County System: Bear Exploration Center, Macmillan International at McKee, and Forest Avenue Elementary School. The schools where all third graders met the benchmark ranged from Georgiana, where 86% of students are from economically disadvantaged households, to Mountain Brook and Crestline elementary schools, where only 2% of students are economically disadvantaged.

The two schools with the largest number of third graders who are below grade level in reading are virtual schools: the Alabama Virtual Academy at Eufaula City Schools, where 421 students, or 37%, failed to make the benchmark, and the Alabama Connections Academy of Limestone County, where 290 students, or 32% scored under the benchmark.

For Students Who Failed to Score At or Above the Benchmark
The 6,480 students who failed to reach the benchmark are in jeopardy of being required to repeat 3rd grade, under the terms of the Alabama Literacy Act. However, there are several routes for promotion to the fourth grade.
Students who failed to clear the new reading sufficiency benchmark have access to intensive summer literacy camps sponsored by local school systems. After the intervention, they will be able to retest.
If they still fail to clear the bar, teachers and school officials have alternative means for evaluating the students’ reading skills. Other good-faith exemptions exist. In 2024, 4,808 students failed to pass the reading sufficiency benchmark. After retesting and applying exemptions, only 452 students were retained due to the Literacy Act, according to the Alabama Daily News reporting.
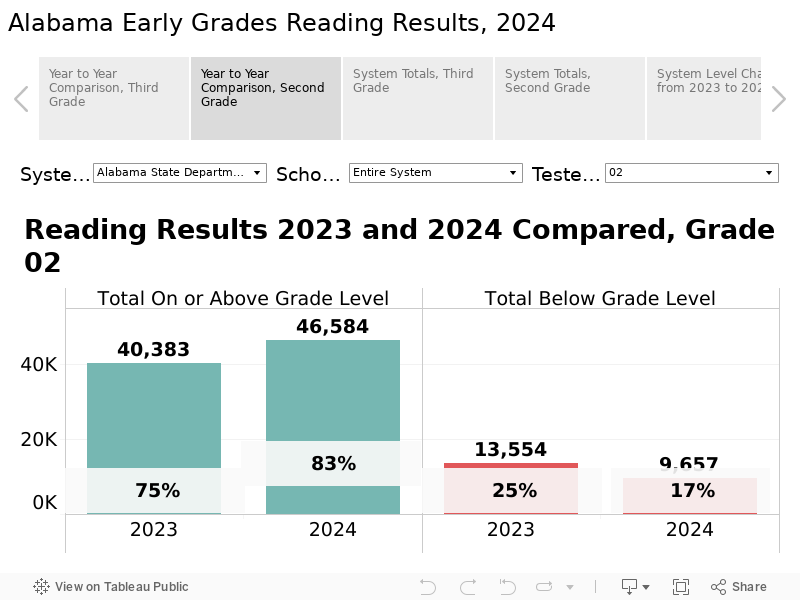
Second Grade Results
Also included in the data release were second-grade results. The cut score also went up for second grade. The second-grade score is intentionally set at a higher threshold so that more students who might be encountering reading struggles can be identified and receive intervention. Due to the higher bar, more students failed to meet the grade level sufficiency benchmark, 19% in 2025 compared to 17% in 2024. The 10,423 second-grade students who scored below the benchmark were encouraged to attend summer literacy camps and should receive special attention throughout their third-grade year.
Background
The intense interest in 3rd-grade reading is the result of the 2019 Literacy Act. The Act was modeled on similar legislation enacted in Florida and Mississippi. Both of those states saw large gains in reading performance on national standardized tests. The laws are based on the premise that students have to be reading on grade level by fourth grade. Students are taught to read from Kindergarten through third grade. In fourth grade, students are expected to read material to learn.
Numerous studies have found that students who aren’t reading on grade level by fourth grade are more likely to struggle academically and fail to complete high school. Low literacy skills are associated with difficulties in the job market and poor health outcomes.
While the Literacy Act’s grade retention provision received attention, the more consequential portions of the bill were its increased investment in improving literacy instruction, early screening for reading difficulties, and requirements for interventions and communication with parents. The Act re-energized the Alabama Reading Initiative and led to statewide training of teachers in techniques grounded in the science of reading.
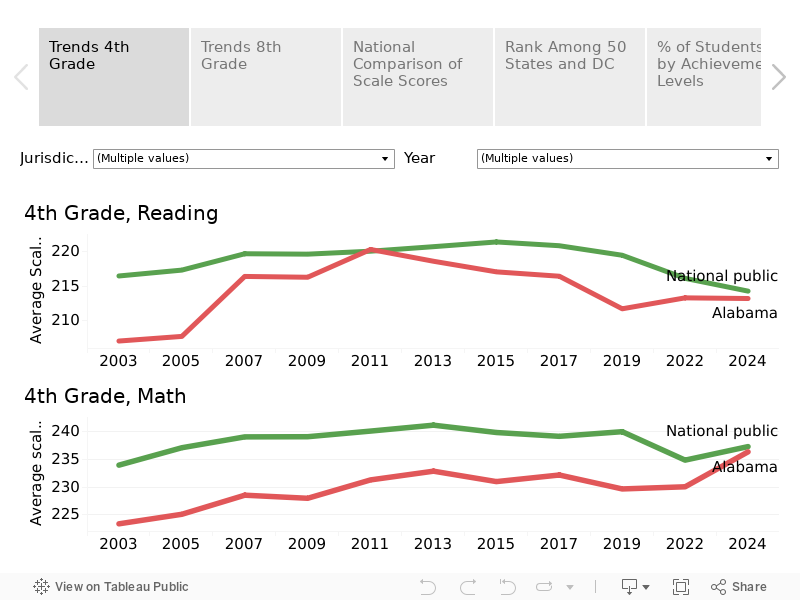
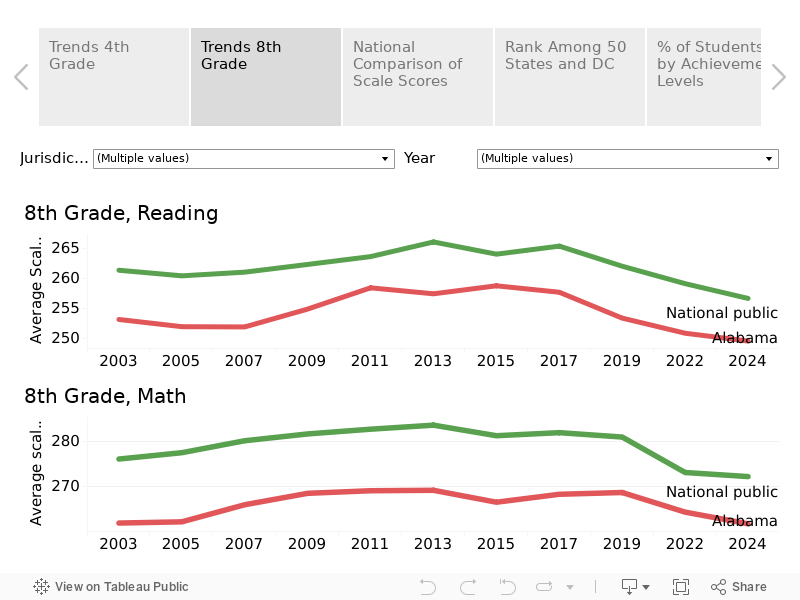
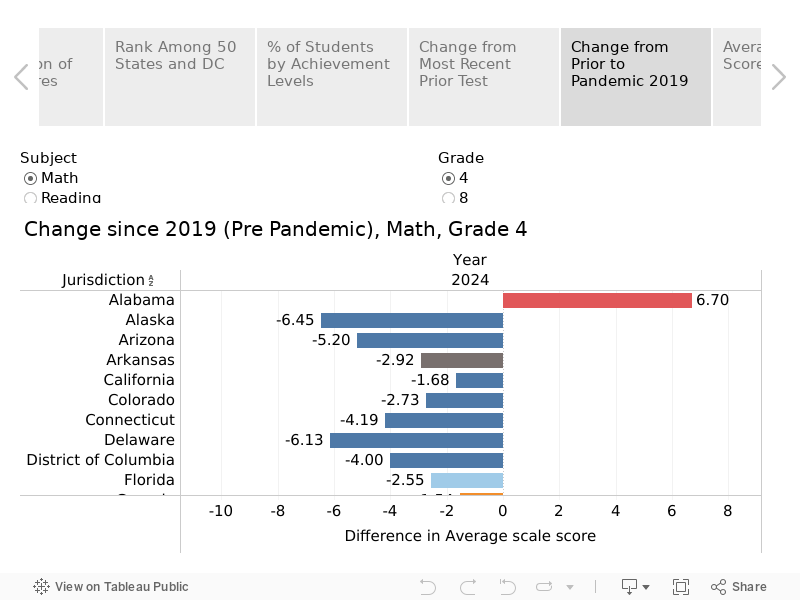
Since implementation, Alabama has seen various measures of reading performance rise. Alabama is one of only two states (Louisiana is the other) in which 4th-grade students are performing better in reading than before the COVID-19 pandemic, according to the 2024 National Assessment of Education Progress (NAEP).