According to the 2020 Census, Alabama’s Hispanic and Latino community represented just 5% of Alabama’s population, but between 2010 and 2020, the growth in that demographic accounted for 32% of the state’s total population growth. That’s according to a new analysis prepared by PARCA for the Hispanic Interest Coalition of Alabama (HICA).
With or without immigration, Alabama’s Hispanic population is poised to become an increasingly important part of the state’s tapestry: 10% of students enrolled in Alabama public schools are of Hispanic descent, as is almost 10% of the population under 25. According to the Census Bureau’s 2021 estimates, 65% of Alabama Hispanics were born in the U.S., an increase from the 50% native-born percentage in 2010.
HICA is a non-profit organization that was founded in 1999 to serve Latino immigrant communities across Alabama. HICA works for Hispanic and Latino families in a myriad of ways: family services, legal advice about citizenship and immigration, financial literacy programs, workforce development, small business lending, civic engagement, and more.
HICA, having long understood the importance of data in advocacy and planning, reached out to PARCA to do a wide-net study on Hispanic and Latino Alabamians. The goal was to generate a collection of data that would inform not just their organization’s strategy but inform policy and encourage further research into ethnicity and outcomes. This data collection includes metrics relating to finances, education, demographics, and more. PARCA used a wide variety of trusted sources with the most relevant authority and recency.
The data tells many interesting stories, not all of which are extenuated in our presentation of it. With the help of HICA, we have outlined what we think are the most relevant and interesting trends. The data is broken into three major categories: Education, Finance, and Population Characteristics.
Education
It is critical to understand educational outcomes and their correlation to ethnicity. To understand education and how demographic groups experience and succeed differently, we must look at a variety of ages and lenses. Our data includes four focuses: ACT, Education Attainment, Graduation Rate and Career Readiness, and School Enrollment.
Alabama Comprehensive Assessment Program
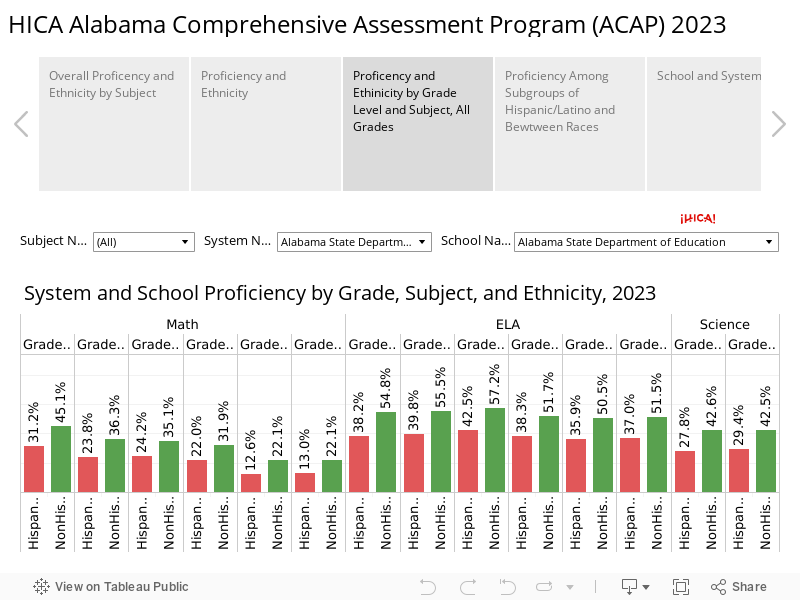
Source: Alabama Department of Education
ACT
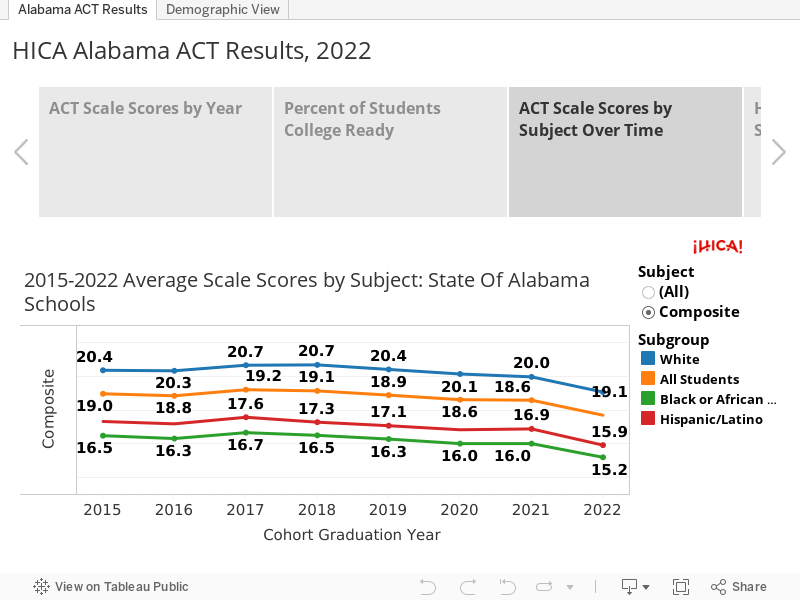
Source: ACT for years 2015-2022.
Education Attainment

Source: Census Bureau’s 2021 American Community Survey 5-Year Detailed Tables.
Graduation Rate and Career Readiness
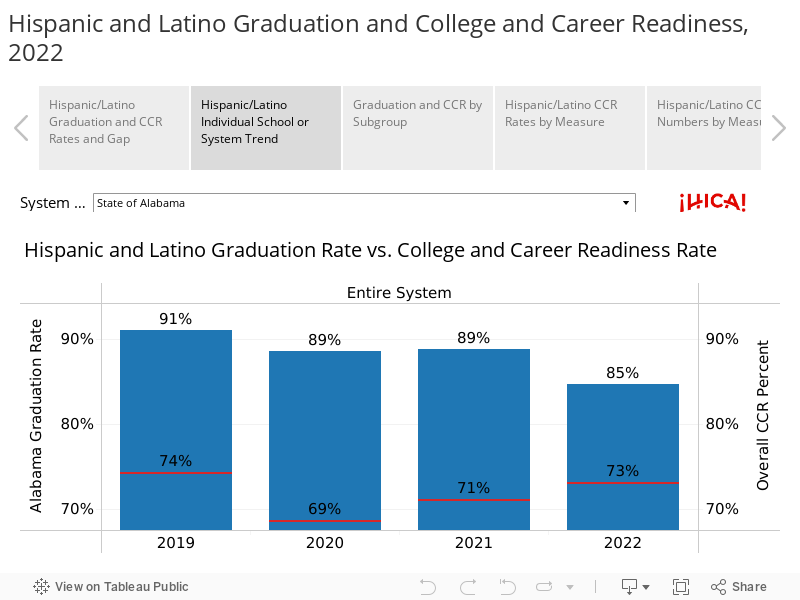
Source: Alabama Department of Education.
School Enrollment
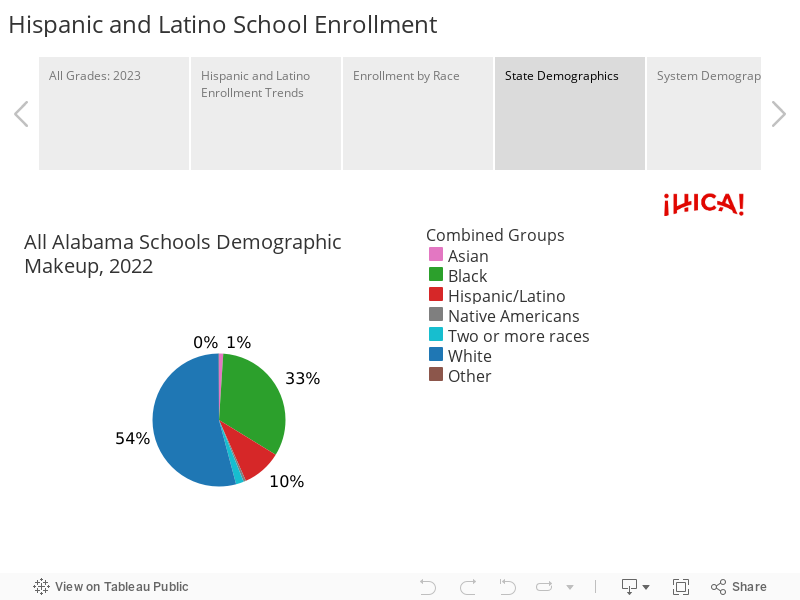
Source: Alabama Department of Education
Finance
The financial situation of Hispanics and Latinos can only be gleaned by combining many metrics. It requires both personal measures like poverty and income, but also instances of interaction with financial institutions.
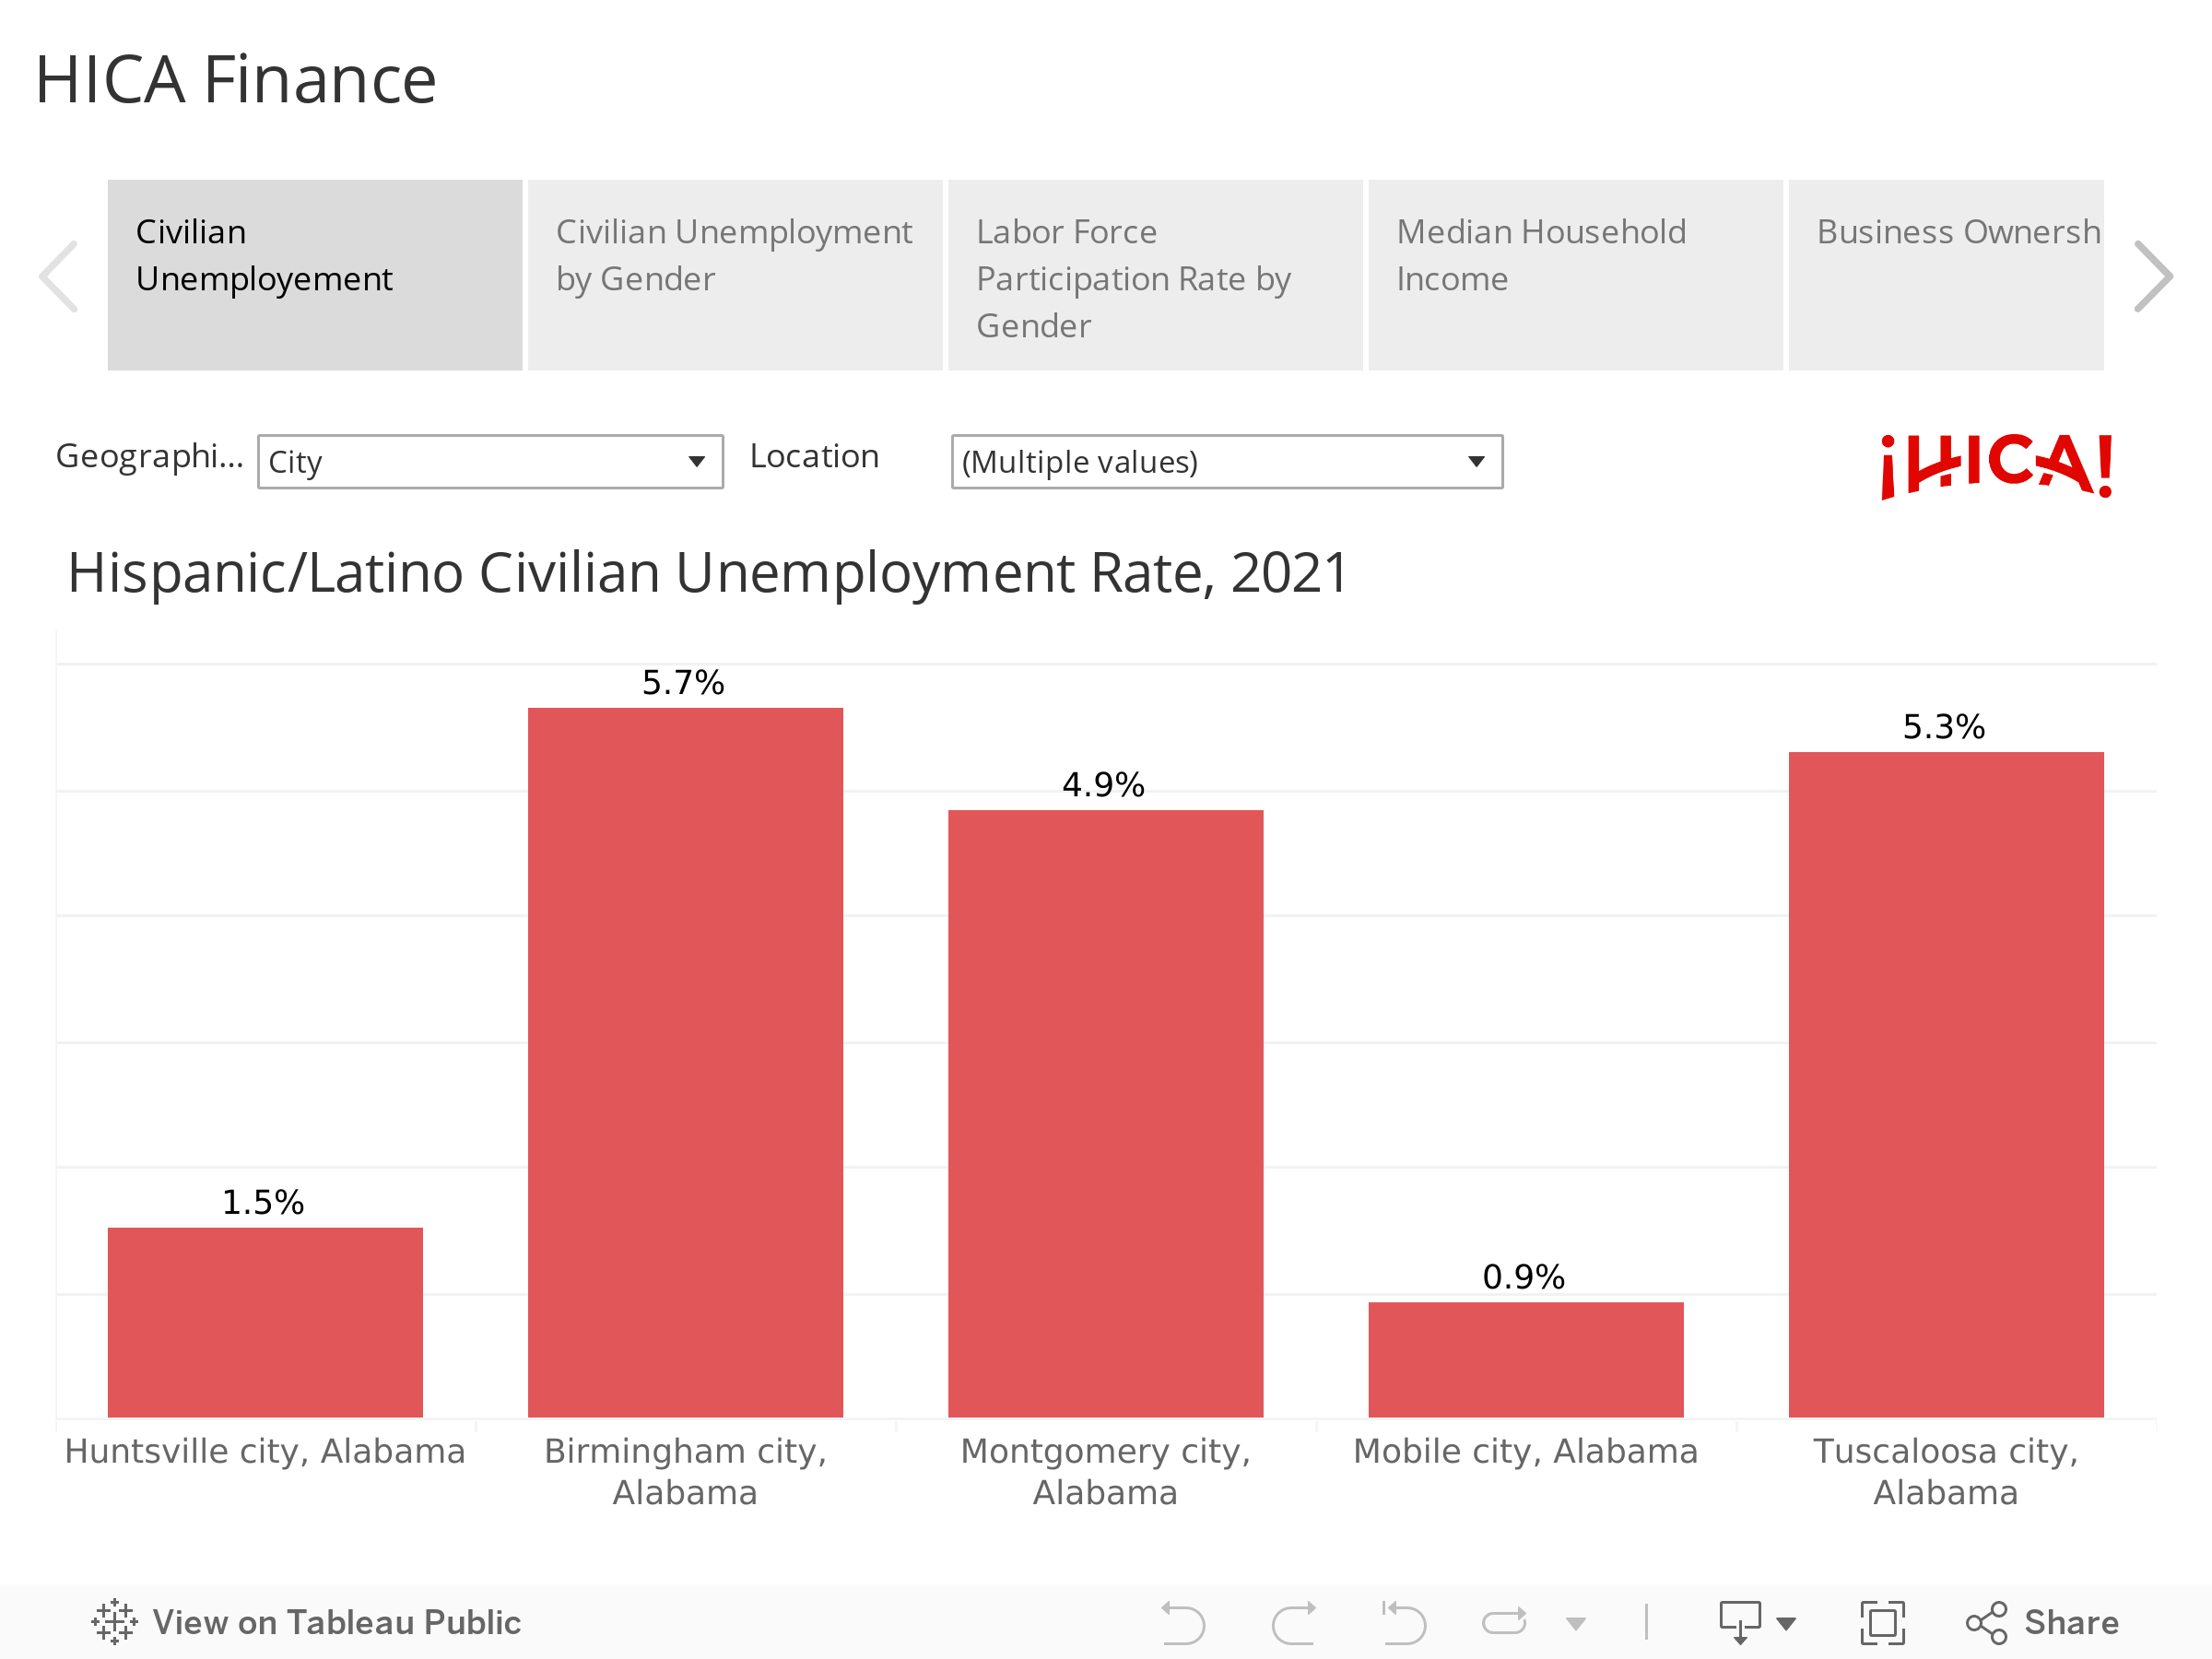
Sources: Metrics on unemployment, labor force participation rate, poverty, and median household income are from the Census Bureau’s 2021 American Community Survey 5-Year Detailed Tables. Data on business ownership are from the Census Bureau’s Annual Business Survey 2020. Data on unbanked is from the Federal Deposit Insurance Corporation. Data on home loan denial is from the Federal Financial Institutions Examination Council.
Population Characteristics
The Census Bureau collects an abundant amount of demographic data through multiple surveys on different geographic levels. This data set uses three of them to maximize recency and locality. Through this data, we can glean much about Hispanic and Latino communities. Where they are, how the group is aging, access to health care, etc. There are three dashboards with different aims to display the data: decennial census by age, decennial census’s change over the years, and a broader dashboard of characteristics.
2020 Census by Age
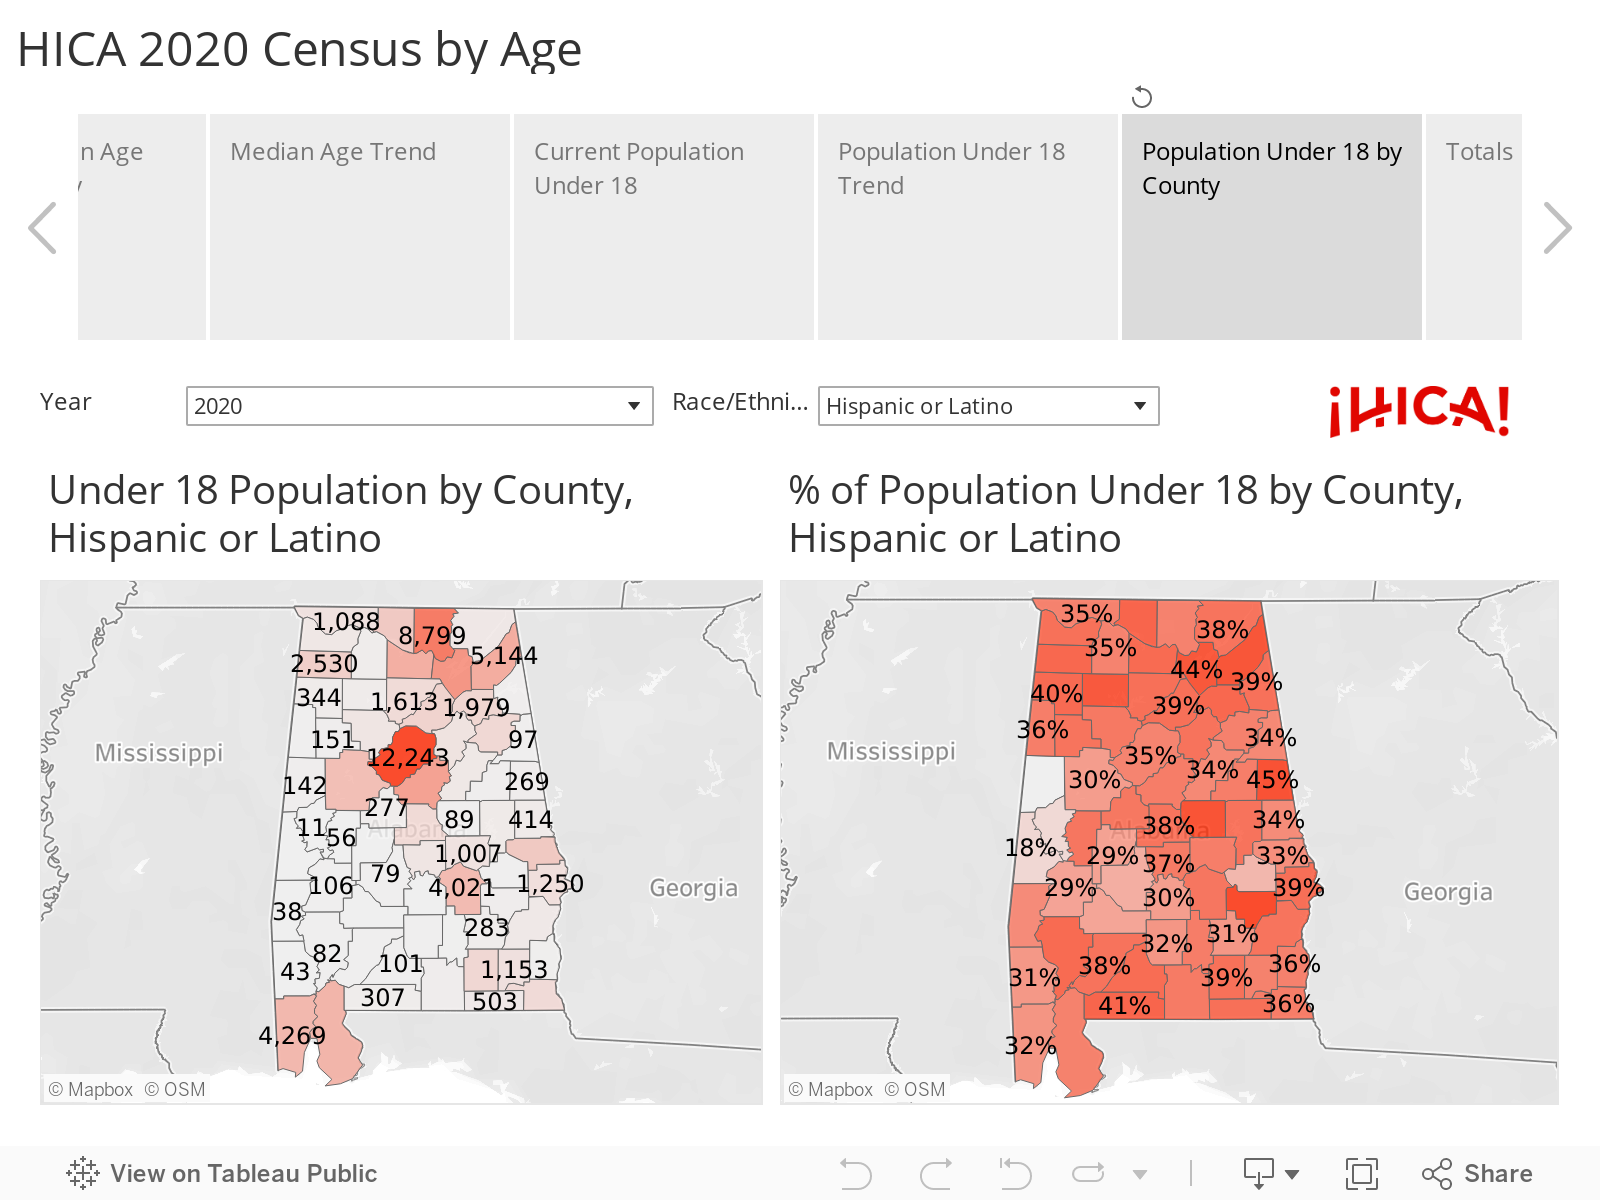
Source: 2020 Decennial Census
2020 Census by Change
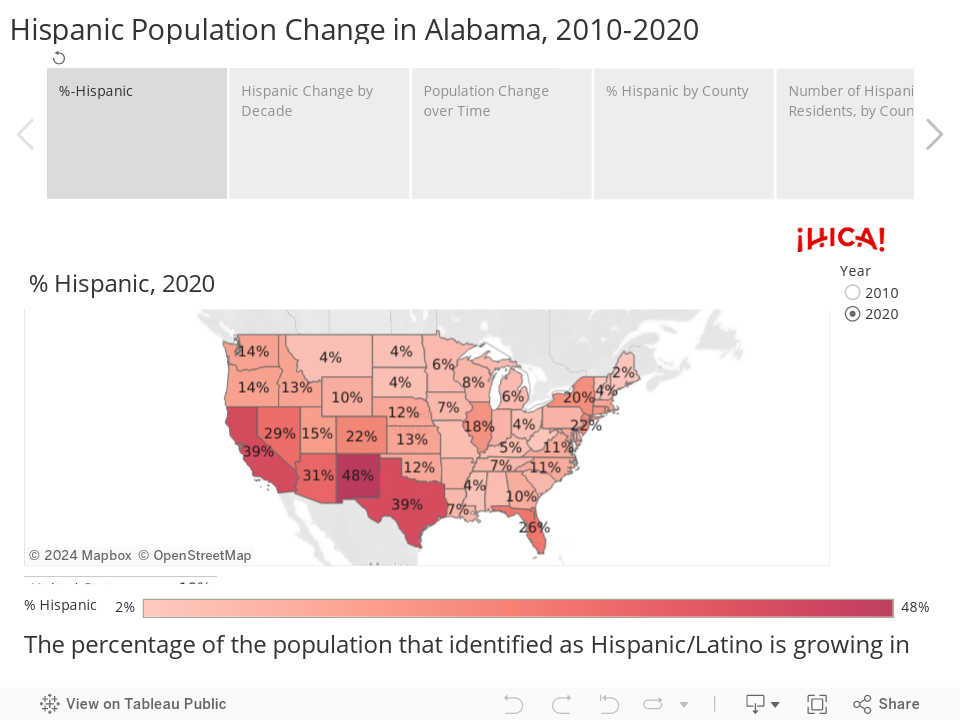
Source: 2020 Decennial Census
Population Characteristics
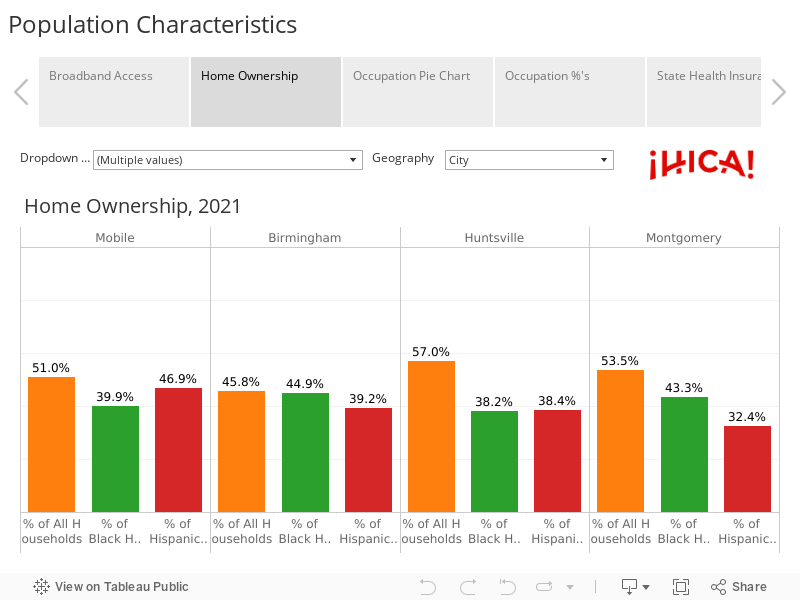
Sources: Data on broadband access, home ownership, occupation, and health insurance come from 2021 ACS 5 Years Detailed Tables. Data on occupation comes from 2021 ACS 1-Year Detailed Tables.