Joint Interim Court Cost Study Commission Recommends Standardization, Transparency, and Reform to “Patchwork” System of Fees
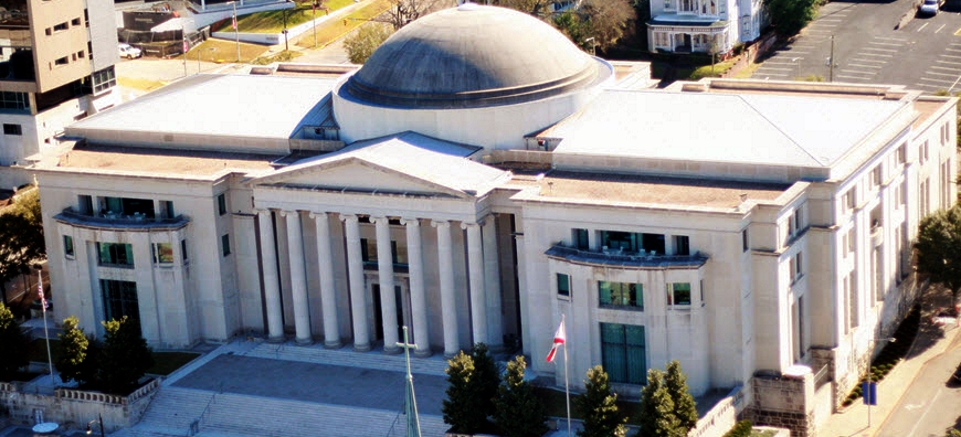
For over a decade, PARCA has documented the role of court costs as they exist at the intersection of public finance and public safety, sometimes providing the only analysis of this important source of revenue. In a report sent to lawmakers earlier this week, Chief Justice Sarah Stewart writes that Alabama lawmakers should standardize court costs statewide, revise old rules to create flexibility as to how court cost revenue can be spent, and identify more sustainable ways to fund local services that is “separate from the courthouse filing counter.”
The report is a product of the Joint Interim Study Commission on Court Costs, which was created in 2025 by an Act of the Alabama State Legislature and met several times in 2025. As defined by the Interim Study Commission, court costs are “money a person pays when they file a case in court or, in criminal cases, when they are convicted.” Every case type comes with standardized statewide costs. Most counties have layered one or more additional costs on top of those, often to pay for expenses like jails.
Lawmakers tasked Commission, created by Act 2025-244, with evaluating court costs and making recommendations to improve the system. Its key findings include:
There are more than 250 local “add-on” court costs created by statute or local constitutional amendment.
Over a dozen local court costs contain “sunset” language (meaning lawmakers intended them to expire at some point), but may still be assessed today.
Local add-ons for civil filing fees range from $0 in some counties to $182 in the most expensive (Madison County), with a statewide average of $30.
While civil filing fees are collected at nearly 100% of what is assessed, criminal court costs, fines, and fees are collected at 15%-20%,“because most people convicted of crimes have very limited ability to pay, especially while incarcerated.”
Practices around court costs vary in Alabama’s neighboring states, with some having uniform costs across counties and others having an even more patchwork system than Alabama.
The Commission’s recommendations were extensive. The included simplifying and standardizing court costs, creating processes for periodic reviews, adding measures for increased transparency and public accountability, finding other ways to fund non-court functions, and reconsidering the “economic feasibility of relying on often-uncollectible criminal court costs and fees.”
To learn more about Alabama’s patchwork system of local court costs and their association with local jail rates, click here.
For a deep dive into how criminal court costs, fines, and fees operate in one Alabama county, examining both public finance and equity implications, click here.
For PARCA’s 2014 Court Cost Study, which remains the only comprehensive existing public analysis of court costs in Alabama, click here.
The Supplemental Nutrition Assistance Program (SNAP), formerly known as the Food Stamp Program, helps people with low incomes buy food.
In FY2025, approximately 740,300 Alabamians, or about 14.3% of the population, received SNAP benefits. These figures include 300,000 children. Recipients receive an average of $6.31 per day. The U.S. Department of Agriculture’s latest report indicates that there has been a 9.5% reduction in the number of people receiving benefits in Alabama, or approximately 70,000 fewer recipients as of April 2026, compared to April 2025. Nationwide, approximately 5.3 million fewer people receive SNAP over that same period.
States run SNAP, sharing administrative costs with the federal government. All benefits are funded by the federal government. H.R. 1, the One Big Beautiful Bill Act, makes two major changes to that structure.
First, states will be required to cover 75% of administrative costs, up from 50%, beginning in FY2027, at a cost of approximately $39 million to Alabama.
Second, beginning in FY2028, states with payment error rates at or above 6% will be required to pay a share of the cost of benefits provided to recipients.
States with error rates of:
0% to 5.99% will pay nothing,
6% to 7.99% will pay 5%,
8% to 9.99% will pay 10%, and
10% and above will pay 15%.
The national average error rate was 10.6% in FY2025.
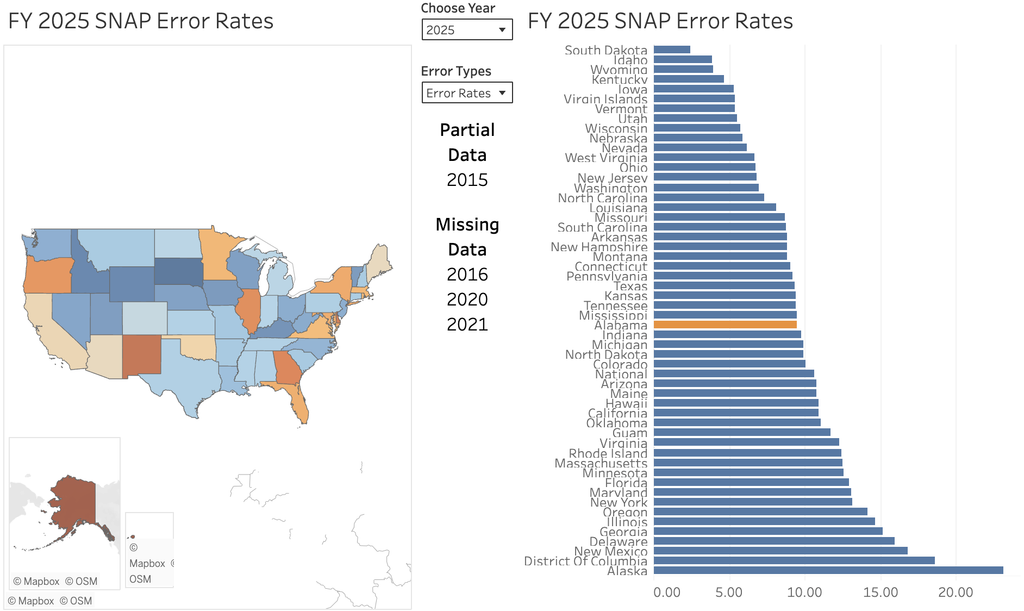
Alabama’s FY2025 error rate was 9.5%. This means the state will be required to fund $174 million in SNAP benefits (based on FY2025 numbers) beginning in FY2028. That cost can be reduced to $87 million if the error rate is kept below 8% and avoided entirely if it is kept below 6%.
Errors versus Fraud
A payment error is a mistake in the size of a benefit paid, not theft. State agencies verify each household’s income, size, and expenses, then recalculate the benefit whenever those circumstances change. Circumstances change often — a new job, lost hours, a household member moving in or out — so the agency is recalculating constantly. When it does not record a change in time, the household receives too much or too little for a month or more. Those timing failures, not deception, produce most of what USDA counts as error.
Not every discrepancy counts. Federal law sets a tolerance threshold — the dollar figure at or below which an error is not counted against a state. The current threshold is $58. A recipient who receives $57 more (or less) than they should is an error, but it is not counted against the state. However, if a household was not eligible for benefits at all that month but received them, that is an error regardless of the size.
Errors run in both directions. Nationally, USDA measured 9.3% of benefits as overpayments and 1.3% as underpayments — a combined error rate of 10.6%, or about $10.1 billion in FY2025.
Fraud is a separate question, and the available evidence indicates it occurs at a low rate, according to the Congressional Research Service report updated in April of 2025. That report noted that retailer trafficking, exchanging SNAP benefits for cash, is a major form of SNAP fraud, estimated to be around 1.6% of benefits.
Trafficking is not part of the payment error rate. The two measure different things: one counts deliberate misuse at the checkout, the other counts administrative accuracy at the eligibility office.
Recipients are more often targets of fraud than its sources. Thieves skim or clone Electronic Benefit Transfer (EBT) cards and empty the accounts.
What’s Next
For the first time in the program’s history, data accuracy carries a cost. At present, the state’s 9.5% error rate could cost $174 million. Reducing that rate below 8% reduces the cost to roughly $87 million. Below 6%, the state owes nothing toward benefits.
In order to avoid these penalties, many states are coordinating error-reduction efforts, like working to modernize software to better track and deliver benefits accurately, and analyzing where documentation and procedural mistakes happen most.
Special Congressional Primary Continues Trend of Declining Political Participation in Alabama
Only 5% of registered voters in the Alabama Congressional Districts holding elections last week cast ballots, producing one of the state’s lowest federal election turnout levels in recent history.
The Tuesday, August 11 elections were highly unusual. They marked the second time this year voters were asked to choose party nominees for U.S. House of Representatives seats in the 1st, 2nd, 6th, and 7th Congressional Districts. But the vote held on May 19 was nullified before it took place. The week before the primary, Gov. Kay Ivey called for the August special elections in reconfigured versions of those districts after the U.S. Supreme Court allowed Alabama to adopt maps drawn by the Alabama Legislature in 2023.
The rescheduled primaries did away with the usual runoff, with candidates needing only a plurality of votes to win their party’s nomination.
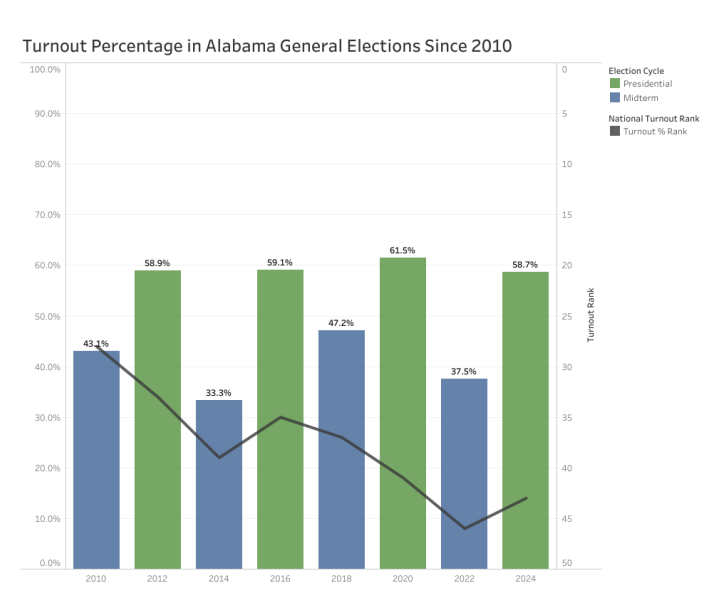
Given the unique circumstances, low turnout was expected, but it was also consistent with a years-long trend of low electoral participation in Alabama. According to data tracked by the Election Lab at the University of Florida, Alabama’s rank in general election turnout, measured as total ballots cast divided by voting-eligible population, has dropped significantly since 2010.
In 2010, when contests between Democrats and Republicans were more competitive, 43% of the state’s eligible voters participated in the midterm elections, and Alabama ranked 28th nationally in general election participation.
But now, after more than a decade of declining electoral competition, Alabama has one of the lowest political participation rates in the U.S. During the 2022 midterm elections, only 38% of eligible voters turned out, putting Alabama 46th in general election participation.
Factors that Weigh on Participation
Alabama’s participation is hindered by relatively inaccessible elections. After the 2024 election, the U.S. Census Bureau surveyed voters who were registered but did not cast ballots and found that conflicting work or school schedules, illness, and disability were among the top reasons cited for not voting.
How Alabama Democracy Compares, a 2024 PARCA report, found that some states have addressed these concerns by adopting measures such as excuse-free mail-in voting, excuse-free absentee voting, and in-person early voting, none of which have been implemented in Alabama.
Weighing voting regulations and procedures, political science professors Scot Schraufnagel, Michael J. Pomante II, and Quan Li developed the Cost of Voting Index (COVI), which provides for comparison of voting ease across all 50 states. Across all presidential cycles since the metric was first calculated, the negative correlation between high COVI scores and turnout has remained statistically significant. In 2024, Alabama ranked 44th nationally, meaning Alabama’s electoral regulations and procedures impose among the highest costs to citizens who wish to participate in democracy.
Compared to 2022 and 2024, Alabama’s 2026 primary season has seen only a slight rise in participation, one that does not portend a significant turnout spike to come during the 2026 general election. The most notable variation in the state’s participation trend has been a drop in Republican turnout in the May primary and an offsetting surge in Democratic turnout.
Republican candidates received 493,988 votes in May’s gubernatorial primary, significantly fewer than the 655,752 they received in 2022. Conversely, Democratic candidates received 365,368 votes in May’s gubernatorial primary, significantly more than the 168,224 they received in 2022. The leading Democrat in the governor’s race, former Sen. Doug Jones, received 287,106 votes, while in the Republican contest, Sen. Tommy Tuberville received 422,255.
The overall turnout rate for the May primary remained below 25%, and the rate dropped to 11% during the June primary runoffs before falling to 5% on Tuesday. None of the state’s primaries or primary runoffs has drawn a turnout rate higher than 25% since 2020.
Such low participation numbers are of concern to all Alabama residents, especially as redistricting has become more scientific, more frequent, and more controversial.
For two decades, Alabama has been at the center of national court fights over the line between redistricting for partisan political purposes, which is legal, and redistricting in a manner that is racially discriminatory, which is illegal.
In its most recent ruling, the U.S. Supreme Court narrowed the circumstances in which courts could find redistricting efforts racially discriminatory. The ensuing redistricting efforts in Alabama and across the country have been even more aggressively partisan.
Partisan redistricting tends to produce predictable outcomes. To the extent that there is competition among candidates, it occurs in the party primary, when relatively few voters are engaged. That allows Alabama officials to be elected by small groups of politically engaged voters, who may not be representative of their broader constituencies.
August Special Primary Election
This dynamic was on display last Tuesday, when unofficial results indicated that just 113,493 of 2,165,142 registered voters cast ballots in the four congressional districts that held elections. At 11%, the highest reported turnout rate was in Coffee County. Use the tabs below to navigate to election results by district, or click this link.
A number of factors unique to Tuesday’s elections played a role in depressing turnout.
Primaries and primary runoffs for statewide and federal offices were held as planned in May and June. As such, Tuesday’s ballots didn’t feature the high-profile races, like those for governor and for U.S. Senate, that typically drive turnout in midterm years.
Likely dampening turnout was also possible confusion among the electorate, with some voters having submitted absentee ballots before the primaries were rescheduled and others seeing their district change between May and August. The replacement election only concerned the four Congressional Districts that changed.
Areas where district boundaries shifted between maps are outlined below. Use the toggles to change between maps.
Overall turnout was further dragged down by the fact that some districts didn’t hold primaries for both parties: Democratic incumbents Shomari Figures and Terri Sewell, for instance, faced no challengers in the 2nd and 7th Districts.
Below is a graph of Alabama’s voter turnout in statewide and federal primaries and primary runoffs since 2016. Turnout is reported by the Alabama Secretary of State’s Office and expressed as total ballots cast divided by registered voters. Alabama did not hold a primary runoff election for a statewide or federal office in 2016.
After falling from the primaries to the primary runoffs, turnout further declined Tuesday, leaving multiple races decided by fewer than 15,000 voters. Running against three opponents in the 6th District, Maurice Mercer became the Democratic Party’s nominee with just 5,398 votes.
Elections that lack high-profile statewide races are particularly vulnerable to turnout issues. During Alabama’s 2024 primary runoffs, which drew a reported turnout of 8%, 14,705 votes were enough for Caroleene Dobson to become the Republican Party’s nominee for U.S. House in the 2nd District.
Voter turnout is low despite the importance of U.S. House primaries in Alabama, a state with no consistently competitive Congressional Districts. Of the 56 general elections and one special general election Alabama has held for Congress since 2010, only three were decided by fewer than ten percentage points.
While low turnout in primary and primary runoff elections is neither a new phenomenon nor one unique to Alabama, it has taken on greater significance as Alabama’s general elections have grown less competitive.
Elections like Tuesday’s, where less than 6% of registered voters exercised their right to vote, threaten to undermine democratic representation, opening the door for officials to assume office based on the preferences of a select group of voters rather than the electorate as a whole.
Local Court Fee Increases Associated with Increased Jail Detention, New Research Finds
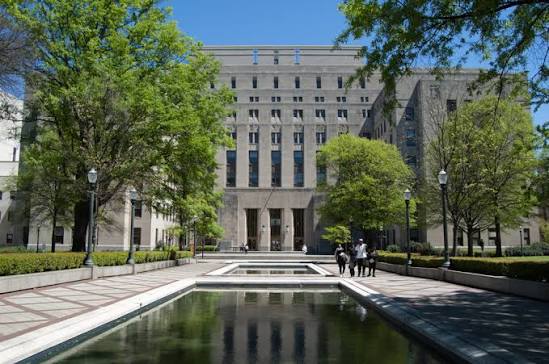
New research led by the Public Affairs Research Council of Alabama (PARCA) and MDRC indicates that each additional $100 in cumulative court fees for criminal cases is associated with an additional 34 jail detentions per 100,000 people at the county level. This small but significant increase suggests that fee increases could increase detention rather than deter it.
Counties often say local fee increases are needed to offset costs associated with processing criminal cases. Counties also pay the cost of housing people in their jails. This research suggests that new revenue from local fee increases should be weighed against the new costs (both social and fiscal) from housing more people in jail.
Beyond the Democratic and Republican primary elections scheduled for May 19, voters will decide the fate of two statewide amendments to the Alabama Constitution.
One would prevent local district attorneys’ salaries from being reduced during an elected term of office. Another would give judges discretion to deny bail to people charged with certain crimes.
Those amendments will be listed on the ballot in both the Republican and Democratic primaries. Alabama is an open primary state, which means voters don’t have to register with a party to participate in a primary. A voter simply requests the ballot of the primary they want to vote in.
If the voter doesn’t wish to vote in either party’s primary, he or she can request an amendment-only ballot.
PARCA has provided an objective, nonpartisan analysis of both amendments.
Drop in International Migration Slows Net Population Growth in Most of Alabama Counties
Decreasing immigration from abroad slowed population growth across Alabama’s counties in 2024 and 2025, though suburban counties and growth magnets in north and south Alabama continued to add new residents. The one-year metro population growth rate for Huntsville (3%) and Baldwin County (2%) put both among the fastest growing Metropolitan Statistical Areas (MSAs) in the US, with Huntsville at No. 6 and Baldwin County at No. 11.
Nationwide, the rate of population growth slowed sharply.
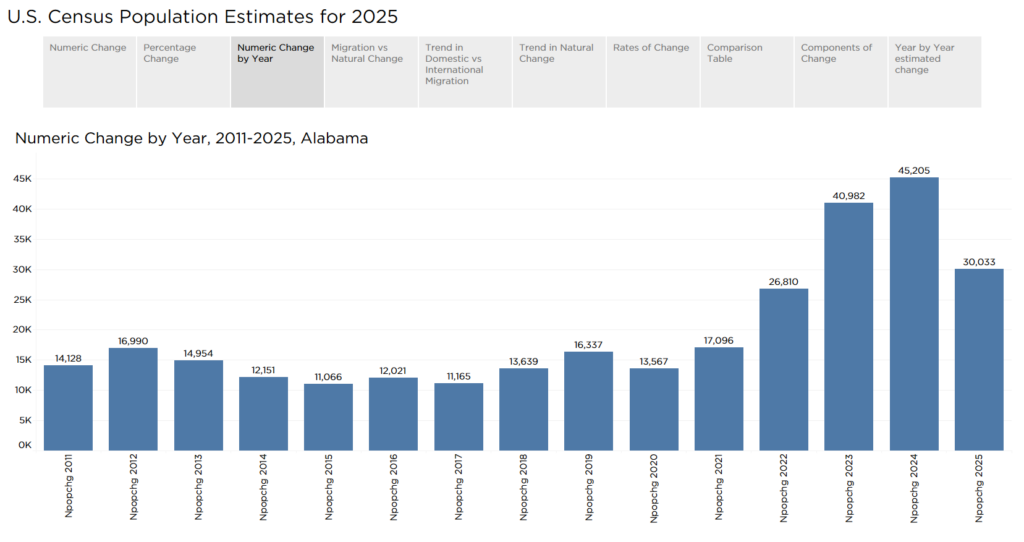
The new estimates released by the U.S. Census Bureau cover the period between July 1, 2024 and July 1, 2025. State-level estimates were released earlier this year. A PARCA analysis of that data showed that Alabama’s population growth hit a peak in 2024, driven in equal parts by international migration, new residents moving to Alabama from other countries, and domestic migration, people moving to Alabama from other U.S. states.
In 2025, the international component dropped sharply, while domestic migration edged down modestly. Deaths outnumbered births in Alabama at large and in all but 17 of Alabama’s 67 counties. Statewide and in most counties, the population would be decreasing without growth through domestic or international migration.
Figure 2. Comparing International Migration in Alabama 2024 vs. 2025
In 2024, central urban counties, like Jefferson, Montgomery, and Mobile, were receiving the bulk of new migrants from abroad. Population increases from international migration helped offset the population decline from people moving from those central counties to surrounding suburban counties or to other states.
However, with the drop in international immigration in 2025, Jefferson and Mobile counties lost population in the latest estimates. In Jefferson County, international migration decreased by almost 2,500 compared to 2024. Nearly 3,000 Jefferson County residents moved to other counties or states in 2025. After accounting for natural change and net migration, Jefferson County’s population decreased by 843 residents. Similar trends led to an estimated population decrease of 535 in Mobile. Montgomery County’s natural increase, plus a decline in outmigration, kept its population about even, increasing by 2, according to the estimates.
Figure 3. Population Change and Migration Components, 2025
National Perspective
These population dynamics within metro areas are not unique to Alabama. In its analysis of 2025 data, the Census Bureau noted that among large metro areas, the fastest-growing counties tended to be on the outer edges, indicating a continuing trend toward suburbanization. Meanwhile, central counties tend to draw the greatest number of international migrants.
For example, the central counties in the Nashville and Atlanta metros also see a net outflow of domestic residents. However, in both those cases, those central counties still attracted enough international immigrants to offset domestic outmigration. And those counties also lie at the center of some of the fastest-growing metropolitan areas in the country.
Figure 4. USA Map of Population Change By Metropolitan Statistical Area, 2025
The decline in inflows of international residents depressed growth in central counties and slowed metropolitan growth rates nationwide. The Census Bureau noted that growth in metro areas declined sharply. Average MSA growth was 1.1% between 2023 and 2024, but fell to 0.6% between 2024 and 2025.
Population growth is occurring disproportionately in southern coastal counties and in metro areas in the south. According to Census:
Geographically, many of the fastest-growing counties were in states along the Southeast coast of the United States, including Florida, Georgia, South Carolina, North Carolina, and Virginia.
Among counties with populations of 20,000 or more, nine of the top 10 fastest-growing counties were in the South, as were 45 out of the top 50.
Figure 5. USA Map by County of Rate of Change, 2025
Growth Spots
Madison County, home to Huntsville, continued to add more residents than any other county in Alabama. Growth from domestic migration increased in Madison County, which added more than 10,000 people, even as international immigration decreased.
Figure 6. Population Change and Migration Components, 2025
In neighboring Limestone County, growth tapered as international immigration decreased. However, in adding an estimated 3,285 residents, Limestone continued to rank among the nation’s fastest-growing counties with a 3.3% population increase in 2025. Together, Limestone and Madison County make up the Huntsville Metropolitan Statistical Area, which in 2025 was the nation’s 6th-fastest-growing MSA.
Figure 7. Percentage Population Change in Alabama MSAs
Alabama’s second-fastest-growing MSA consists of just Baldwin County and is officially known as the Daphne-Fairhope-Foley MSA. That MSA also continued to grow rapidly, as part of the growth pattern Census noted: people moving to southern counties along the Atlantic and Gulf coasts.
Despite Mobile County being right next door, Baldwin and Mobile are considered two separate MSAs. According to the Census Bureau’s analysis of commuting patterns, there is not enough daily interchange of populations between the two counties to consider them a single MSA. Mobile County’s population declined, in part due to a drop in international migration.
Figure 8. Numeric Change in Alabama MSAs
Alabama’s largest MSA is Birmingham, which now includes seven counties: Jefferson, Shelby, St. Clair, Blount, Walker, Chilton, and Bibb, with a population of 1.2 million people. That’s more than double the size of Huntsville, but Birmingham’s MSA is growing more slowly.
In 2025, the MSA added 3,450 people. Most of that growth occurred in Shelby County, which added 2,746 new residents, and St. Clair County, which added 1,160. That put both those counties in the Alabama top 10 for growth, both in pace of growth and number added. Walker, Bibb, and Chilton experienced modest gains. Together, that was enough to offset the decline in Jefferson and Blount counties.
The Auburn-Opelika MSA, which consists of Lee and Macon counties, grew by almost 2,000.
Dothan’s MSA, which includes Geneva, Houston, and Henry counties, added about 1,000 in total. Tuscaloosa County added almost 500 new residents, and Hale County added about 50, but the other two counties in the Tuscaloosa MSA, Greene and Pickens, lost population. So, in total, the four-county MSA was up by just over 300 residents.
Over in East Alabama, Etowah County, which makes up the Gadsden MSA, has posted positive growth for the past three years after several years of decline, adding 411 in 2025. Calhoun County, the Anniston-Oxford MSA grew in 2022 and 2023, but in 2024 and 2025, the estimates point to population decline, a decrease of 469 in 2025.
Huntsville MSA’s north Alabama neighbors in the Decatur and Florence-Muscle Shoals MSA’s grew modestly. In Decatur, Morgan, and Lawrence counties, each added about 200 new residents, a fourth straight year of growth. The Shoals, made up of Colbert and Lauderdale counties, have both been gathering steam in population growth during the current decade, though Lauderdale was estimated to have had a decline of 163 residents in 2025.
Overall, 36 Alabama counties gained population, but only 7 added more than 1,000 people; 31 counties saw population declines.
Rates of Change
The counties losing the population the fastest are in Alabama’s Black Belt. And that trend continued in 2025. Perry, Lowndes, Willcox, Dallas, and Greene counties have each lost 8% or more of their population since 2020. There are now five counties with fewer than 10,000 residents: Bullock, Wilcox, Lowndes, Perry, and Greene.
Figure 9. Rate of Change, Domestic Migration, 2025
Multiple factors are conspiring to drain population from rural Alabama counties. Rural counties also tend not to attract new immigrants from other counties. Domestic migration is also typically low to negative, with younger residents often moving to metropolitan counties where jobs are concentrated. As younger people move away in search of opportunity, the population becomes disproportionately old.
As the Baby Boom ages, that large cohort is beginning to experience increased mortality. As the average age increases, the death rate increases. And since younger people have tended to move to metros, the birth rate has declined.
Figure 10. Rate of Change, Death, 2025
The pattern isn’t confined to rural Alabama. It is also pronounced in the former coal country in the Appalachians, in the Mississippi Delta, and in portions of the West and Midwest.
Figure 11. USA Rate of Population Change by County
Keys to Success in College and Career Readiness
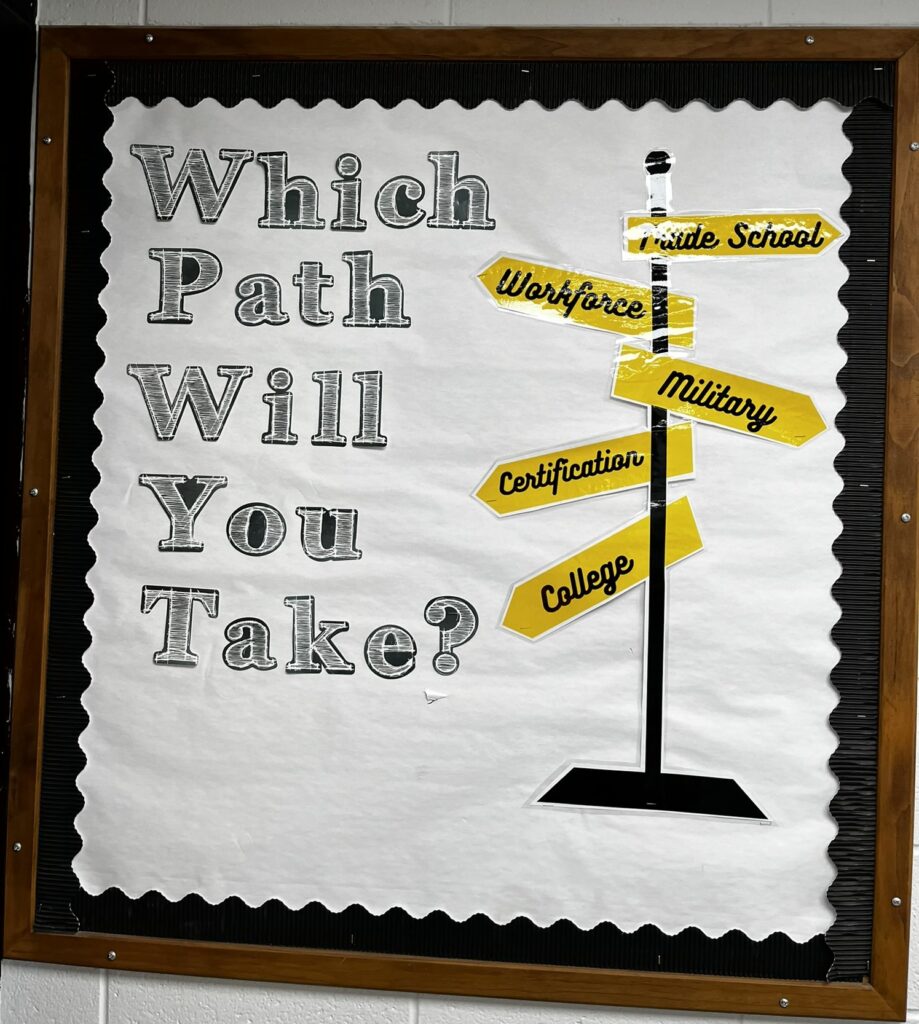
This spring, all Alabama high school graduates will have to earn a marker of college and/or career readiness in order to graduate.1
In this installment of PARCA’s Keys to Success series, we visit Opp High School, which has been one of the state’s most successful schools at producing college and career-ready graduates. In fact, for five years running, more seniors were college or career-ready (CCR) than actually earned a diploma.
In 2024, 94% of Opp’s seniors graduated (beating the state average of 92%), and 99% of seniors ended the year with a marker of college and career readiness, a CCR rate that is 10 percentage points higher than the state average.
How do they do it?
More attention per student thanks to small school size
A close dual enrollment partnership with the local community college
Creative use of practical, local opportunities for students to earn Career Technical Education credits and credentials
Practice and deliberate effort on the measures that qualify students for college readiness
PARCA’s Keys to Success series identifies schools and systems that are exceeding expectations and explores how they are doing it. The series aims to identify and share best practices.
Small Town Personalized Attention
The City of Opp, located in rural Covington County, was formerly a textile mill town. Despite the closing of the textile mills, Opp has maintained a stable population of around 6,700 people since 2000.
The school system produces between 80 and 90 graduates per year, which ranks among the 20 smallest school systems in the state. Opp’s percentage of students from economically disadvantaged households is higher than the state average. Thanks to federal anti-poverty education dollars, Opp’s per-student expenditure was slightly above the state average in 2023.
In some ways, that small size helps Opp. The high school is the center of activity and energy for the entire community. That keeps students and the community engaged.
“What is going on at school is the hottest thing in town. That is very much an asset for us,” said Opp High School Principal Matt Blake.
A smaller school can, in some instances, mean each student receives extra attention. For example, in addition to a traditional guidance counselor, Opp High School has a full-time career coach, who works with the counselor, to make sure all students have a plan to progress through school on a trajectory that points toward one of the “three e’s”: graduating from high school, either Enrolled, Employed, or Enlisted.
Student preparation for college and career readiness begins in middle school, with the career coach visiting students and making them aware of potential career pathways. During orientation, rising ninth graders and their parents are presented with career options, and students begin developing four-year plans to meet both academic and college- and career-readiness markers they’ll need to graduate.
Once at the high school, the counseling suite is highly visible, located at the top of the high school stairs, with glass windows for walls. The visibility serves as a reminder to students of the stream of opportunities available. Opp has a regular stream of visits from college, employment, and military recruiters.
When Blake moved to Opp from Gulf Shores in 2022, he brought his career coach, Courtney Blake, with him. She also happens to be his wife. The two have creatively conspired to leverage resources to expose students to college and career opportunities.
Community College Collaboration
A primary partner in the CCR enterprise is Opp’s community college, the MacArthur branch of Lurleen B Wallace Community College (LBW).
In the past, more than half of Opp graduates flowed into LBW after graduation. More recently, the relationship is even tighter and starts earlier through dual enrollment. Opp students, while still in high school, make up a healthy share of the college’s enrollment.
In fact, Opp now delivers all its college-caliber courses in partnership with LBW, rather than offering Advanced Placement courses at the high school.
In the 2024-2025 school year, Opp students took almost 400 credit hours at LBW, including college-level courses in English and history, calculus, biology, and psychology. That total also included about 52 career tech classes, including industrial maintenance, engines, computer science, and cosmetology. Opp High School students also took aviation courses through Enterprise State Community College.
Some students attend classes on the LBW campus. In other cases, an LBW instructor may come to the high school campus to lead class two days a week, with students led by Opp teachers the other three days, who focus on ACT prep skills and strategies. Opp High School also has its own teachers who are certified to teach dual-enrollment classes on campus at OHS, but through LBW.
Both academic and career-tech courses taken through LBW count toward degrees or certifications. The academic courses can be transferred to universities, allowing Opp graduates to start college with a bank of credits toward a degree.
Taking Creative Advantage of Available Opportunities
Opp isn’t a big city full of employers and businesses that can offer internships or sponsor training programs for high school students. But the Opp High has a tradition of Career and Technical Education programs that creatively intersect with school and community needs.
Plant Science teacher, Josh Kyser, is a graduate of the turfgrass management program he now leads. After graduating from Opp, he continued in the field at Auburn, which led to a career in golf course management and design.
Family ties eventually drew him back to Opp, and after a few twists and turns, he was recruited to serve as the City of Opp’s director of Parks and Recreation. The City maintains the high school’s fields, so he had a close relationship with the school. Eventually, high school leaders persuaded him to lead the program that had launched his career.
The horticulture class helps care for the school’s athletic fields, which, over time, can lead to students earning turfgrass management and plant biotechnology certifications. Meanwhile, through a competitive grant program, Opp won extra career-tech funding to put students to work and in class during the summer on a school field project.
The students worked with the City and the county on a project to grade and pave a road from the school to the athletic field. Through their summer work, the students earned money and certifications for operating skid steers, mini-excavators, and bulldozers. Those certifications have real value in the employment marketplace.
In another summer project, students in the plant biotechnology classes designed and constructed a pollinator garden. Students also planted and tended vegetable and herb gardens, projects that were also funded in part with CTE money won through a competitive grant.
This fall, that pollinator garden was fluttering with butterflies and darting with hummingbirds. The vegetable and herb gardens yielded beans, collards, Brussels sprouts, and other ingredients that contributed to a community banquet organized by the students in the food and nutrition program.
In preparing for the event, students earned ServeSafe certifications, a credential often required for those working in the restaurant industry. The preparation and execution also dovetailed with nutrition science course credits.
Increasing College Readiness
Opp High School has also ramped up student preparation for four-year colleges, focusing on improving performance on the ACT college admissions test.
Historically, most college-bound Opp graduates started at a community college, then transferred to four-year universities after earning college credits.
With the sharp rise in students taking community college courses in high school, students are in a better position to go straight to a four-year college after graduation. However, that means ACT scores take on more importance for college admission and scholarships.
Blake, who spent time as a football coach, recognizes the value of practice.
So, in his effort to improve student performance on the ACT, Blake created more opportunities for students to take the test. The school pays for ninth-graders to take the Pre-ACT, in addition to administering it to 10th-graders in the fall.
The school then offers students a first attempt at the ACT in the spring semester of their 10th-grade year.
In January, teachers begin reviewing the test and have students take a mock version of the ACT.
They take mock versions again in February. Using a digital test reader, students receive immediate results. Teachers identify questions that tripped up students and talk through the answers, and address the underlying skill.
Students participate in a two-day ACT boot camp. The school brings in an ACT specialist in Math and ELA to lead a two-day intensive review before the last mock exam. This allows students to use the strategies and tips from the last mock exam to build confidence in their abilities.
In late March, juniors take the real test, the required junior year administration.
Blake concedes that he has greatly increased the emphasis on the ACT. However, he doesn’t think that emphasis distracts from educational goals. “Test-taking skills aren’t frivolous,” he said. “It teaches problem-solving and critical thinking. And they’ll have to take similar tests in college or if they apply to graduate school.”
Results
Between 2023 and 2024, the percentage of students earning a benchmark score on the ACT leapt from 34% in 2023 to 52% in 2024, exceeding the state benchmarking rate of 42%
The Opp graduating class of 2024 posted major gains on the ACT in every subject, outperforming the state in all four subjects.
The college-going rate in Opp rose from 62% in 2022 to 68% in 2024, far exceeding the state college-going rate of 57%.
The gains were particularly pronounced in the percentage of students who went straight to a four-year college after graduating from high school, rising from 10% in 2022 to 31% in 2024.
Conclusion
Blake said Opp’s success has resulted from long-term planning by the school, students, the system, and the state.
The school works with students and parents, beginning in middle school, to chart a student’s path through choices and courses that lead to a college or career goal. The school works with local partners such as LBW Community College, Opp’s Mizell Memorial Hospital, and the City of Opp to expand work and internship opportunities for students.
The school also works with the system and the state to pay for enhanced opportunities. The school has been aggressive and creative in pursuing grants and establishing budget priorities in order to pay for novel CTE programs, summer work opportunities, and intensive ACT training for faculty and students.
As the requirement that all students earn a CCR credential goes into effect this fall, the State Department of Education and the governor’s office have indicated continued support for enhanced investment in College and Career Readiness. The Governor’s proposed budget maintains support for career coaches and for K-12 career tech programs and initiatives. The budget proposes increasing support for dual enrollment through the Alabama Community College System by $10 million. The Legislature will consider the budget during its session, which opened earlier this month.
Footnotes
In order to demonstrate college and career readiness, a student must achieve one of the following: 1. Score college-ready in at least one subject on the ACT 2. Score at the silver level or above on the WorkKeys Assessment. 3. Earn a passing score on an Advanced Placement or International Baccalaureate Exam. 4. Successfully earn a Career Technical Education credential or earn Career and Technical Education (CTE) completer status. 5. Earn dual enrollment credit at a college or university. 6. Successfully enlist in the military. 7. Complete a CTE program of study. 8. Complete an in-school youth apprenticeship. ↩︎
PARCA Partners with VOICES on the 2025 Alabama Kids Count Data Book
Since 1994, the Alabama Kids Count Data Book has documented and tracked the health, education, safety, and economic security of children at the state and county levels.
The Data Book serves as both a benchmark and roadmap for how children are faring and is used to raise visibility of children’s issues, identify areas of need, set priorities in child well-being and inform decision-making at the state and local levels.
The 2025 edition represents the 32nd installment of the organization’s long-running assessment of child well-being in Alabama. Unlike previous years, the Data Book will no longer be limited to a single annual release. Instead, VOICES plans to publish ongoing updates, analyses, and issue briefs throughout 2026.
“For more than three decades, the Data Book has helped Alabama understand how our children are doing,” said Dr. Tracye Strichik, executive director of VOICES for Alabama’s Children. “But children’s lives—and their mental health needs—are changing quickly. A digital, year-round approach allows us to respond with data that is timely, relevant, and actionable.”
See how children in all 67 counties of our state are faring in education, health, economic security, and more. VOICES believers that every child in Alabama should have access and opportunity to thrive and become all they can be, and hopes that by utilizing this book’s insights, we can identify the challenges, set priorities, track our progress, and achieve real outcomes for children and families.
The 2025 County Data Profiles are also available for each of Alabama’s 67 counties and the state. These four-page reports provide even more disaggregated data on the indicators presented in the 2025 Alabama Kids Count Data Book.
Want to see this data at the national level? Visit the national KIDS COUNT Data Center to access hundreds of indicators, download data and create reports and graphics!
How Alabama Taxes Compare, 2025
Each year, PARCA uses data from the U.S. Census Bureau’s Annual Survey of State and Local Finances to compare Alabama’s tax collections to all 50 states. The most recent data comes from the 2023 Fiscal Year.
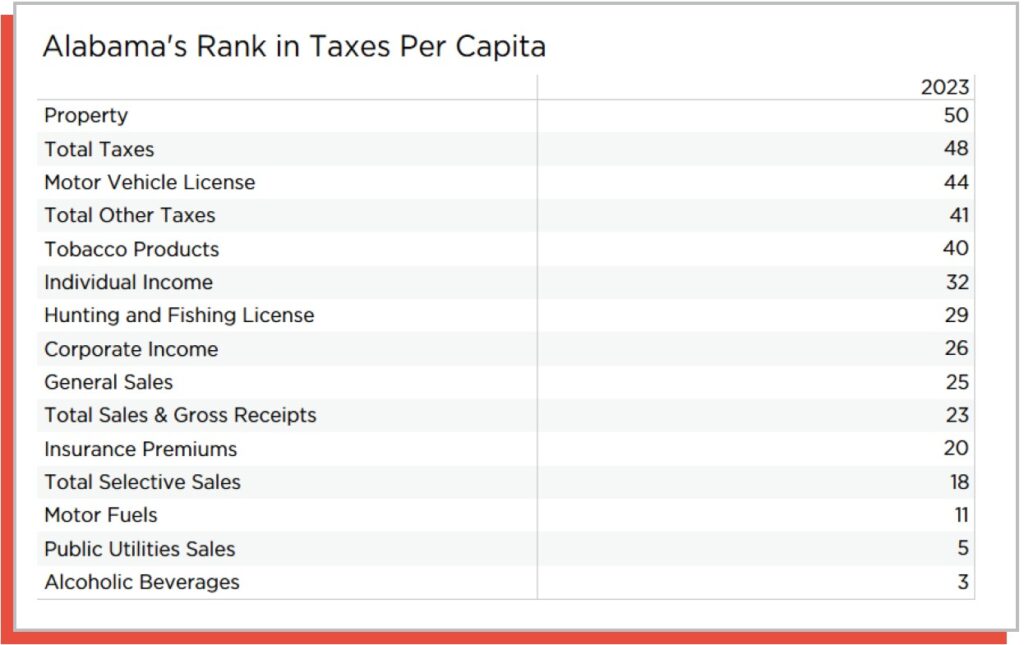
In FY 2023, adjusted for population, Alabama collected less in state and local taxes than all but two other states, Tennessee and Mississippi, both of which cut taxes significantly in recent years.
Alabama’s per capita property tax collections are the lowest in the nation. That can help owners of homes, farms, and timberland but comes at the cost of a revenue deficit, leaving state and local governments with less to spend providing government services like education, health, and public safety.
Alabama’s state and local sales tax rates are among the highest in the U.S., compensating for low property taxes.
Alabama’s income tax, while technically graduated, does not provide the balancing effect on the regressivity of the entire tax system that graduated income taxes in other states do. Low-income workers begin paying taxes at a lower threshold than in any other state, and brackets top out at a low threshold as well. At the other end of the spectrum, Alabama is the only state that allows a full deduction for federal income taxes paid, a tax break that benefits high-income earners.
Alabama is home to 5,996 active 501(c)(3) organizations that file regular tax returns and report at least $25,000 in annual revenue or assets. Although more than 25,000 nonprofits are registered in the state, many are inactive. The active group represents the real working infrastructure of civic life—from child abuse prevention and mental health services to workforce training, arts, and conservation.
Relative size
Alabama has 114.6 nonprofits per 100,000 people—ranking 40th nationally. Its density is lower than most states, suggesting opportunity for measured growth rather than oversaturation.
Economic footprint
Active nonprofits generate $16.9 billion in annual revenue, but that total is highly concentrated: 0.35% of organizations (the 21 largest) account for nearly half of all income. The median nonprofit operates on about $200,000 a year, with two-thirds reporting less than $500,000.
Public investment
Between 2015 and 2025, Alabama nonprofits received $5.5 billion in federal awards—an average of $553 million per year. More than 60% of those dollars flow through the U.S. Department of Health and Human Services; most reach communities through state agencies such as the Alabama Department of Economic and Community Affairs (ADECA), the Alabama Department of Public Health (ADPH), and the Department of Early Childhood Education.
Philanthropic capacity
Alabama’s 822 foundations hold $4.5 billion in assets—ranking 49th per capita. Assuming a typical 5.6% payout, foundations could distribute about $226 million per year, only one-third of recent federal funding. Private philanthropy cannot replace sustained public investment.
Key finding
Alabama’s progress depends on collaboration among government, philanthropy, and community organizations. Nonprofits are not a substitute for government; they are its local expression. Strengthening this partnership—through data transparency, diversified funding, and civic trust—is essential to building a resilient Alabama.