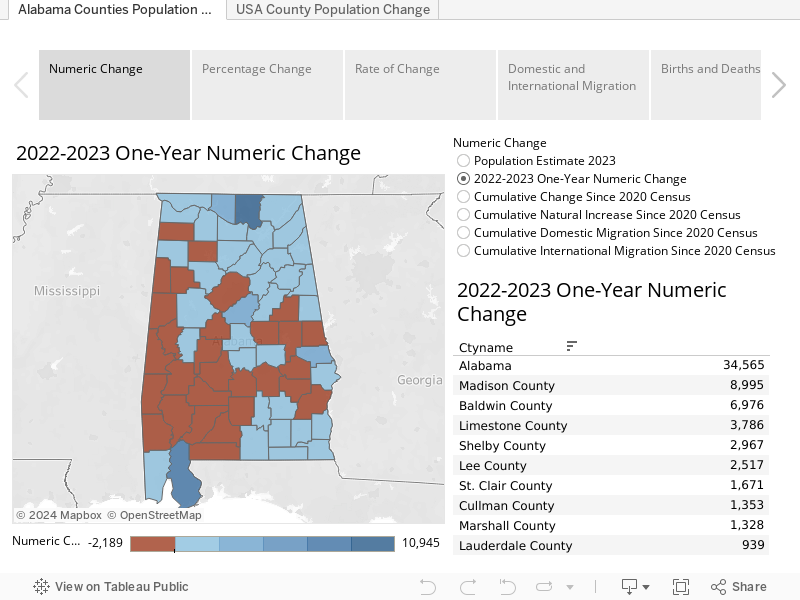
The Huntsville area and Baldwin County continue to add more new residents, while growth in Shelby County and St. Clair County helped the Birmingham Metro Area return to positive growth after two years of population loss. That’s according to new estimates of population change in U.S. counties and metro areas published by the U.S. Census Bureau. The new estimates identify population totals and components of population change as of July 1, 2023.
Printable PDF available here
In addition to the growth in Shelby and St. Clair, Birmingham’s metro population got a boost from an accounting change. In the 2022 estimates, the Birmingham-Hoover MSA ranked No. 50 in population among metropolitan areas and seemed destined to fall out of the top 50 metro areas.
However, in 2023, Walker County was re-added to the Birmingham metro, which boosted the Birmingham MSA population by almost 65,000 and allowed it to climb to the 47th most populous metropolitan area.
Metro areas are clusters of counties where a significant percentage of the population moves back and forth across county lines for work and commerce. According to the most recent data, about 26% of Walker County’s resident workforce commuted to work in Jefferson County or other counties in the MSA. That’s above the 25% threshold that triggers inclusion in the MSA. Walker was historically part of the MSA.
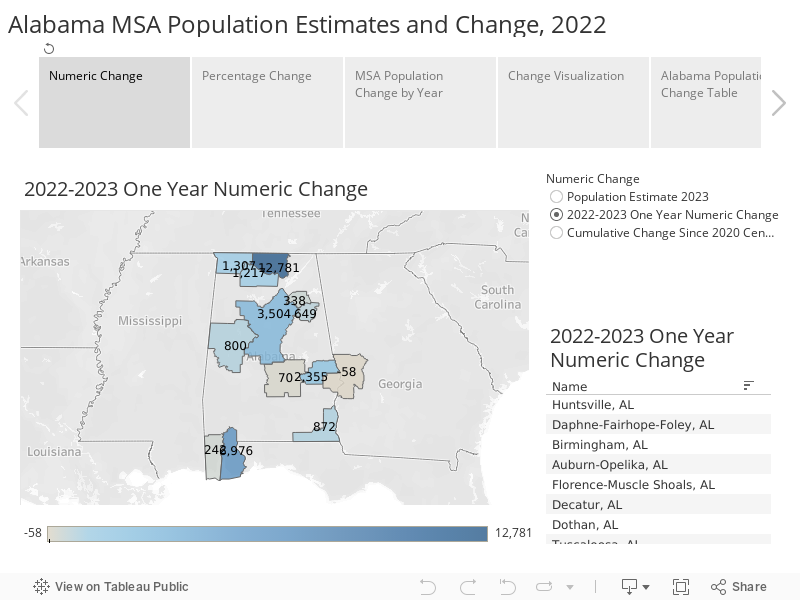
Consisting of 7 counties with a population of 1.2 million, Birmingham is the state’s largest metro area. Huntsville’s MSA, comprised of Limestone and Madison Counties, is second with 527,254.
Trends
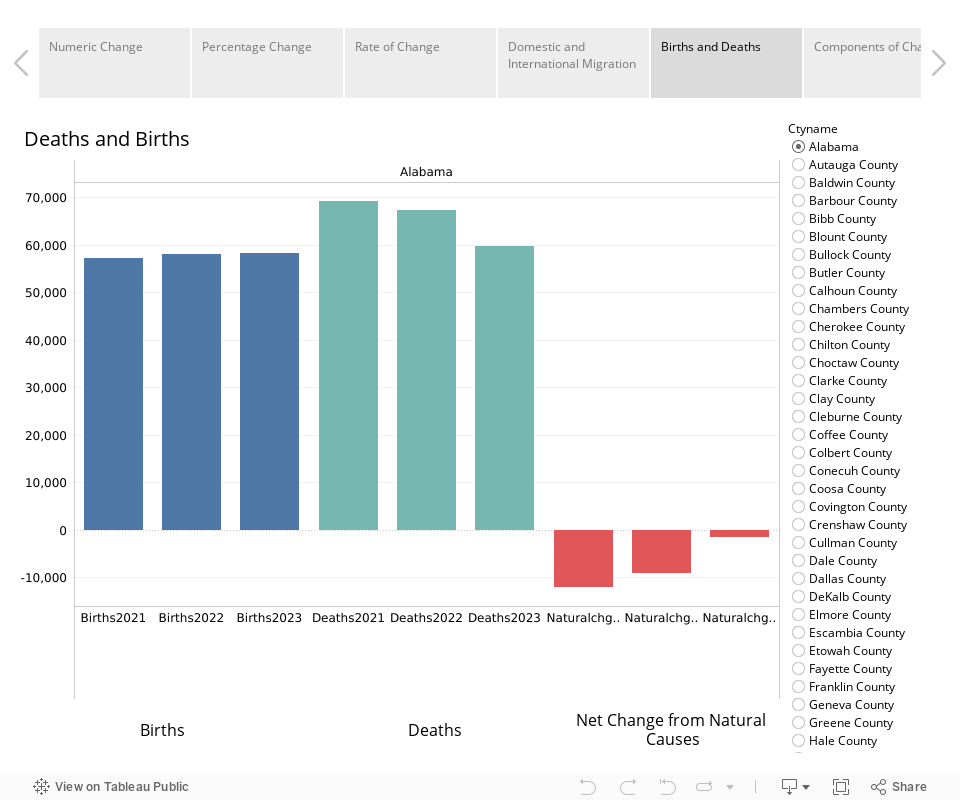
As observed in the PARCA’s analysis of state-level estimates released earlier this year, the decline in deaths related to the Covid-19 pandemic improved baseline conditions for population growth. In the 2021 and 2022 estimates, deaths far outnumbered births. In 2023, the number of deaths in Alabama continued to drop, though, due to an aging population and lower birth rate, deaths still outnumbered births.
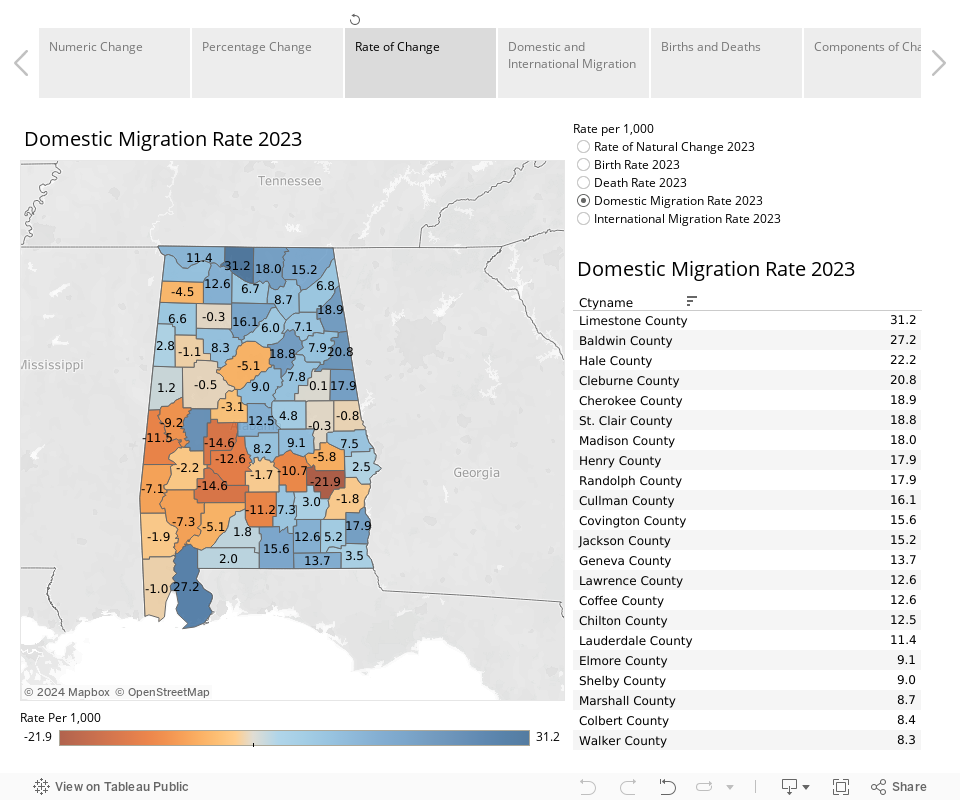
International immigration to Alabama remains low, but domestic immigration continues to accelerate, according to the estimates. Alabama netted 30,744 new residents through domestic in-migration in 2023, building on an upward trend.
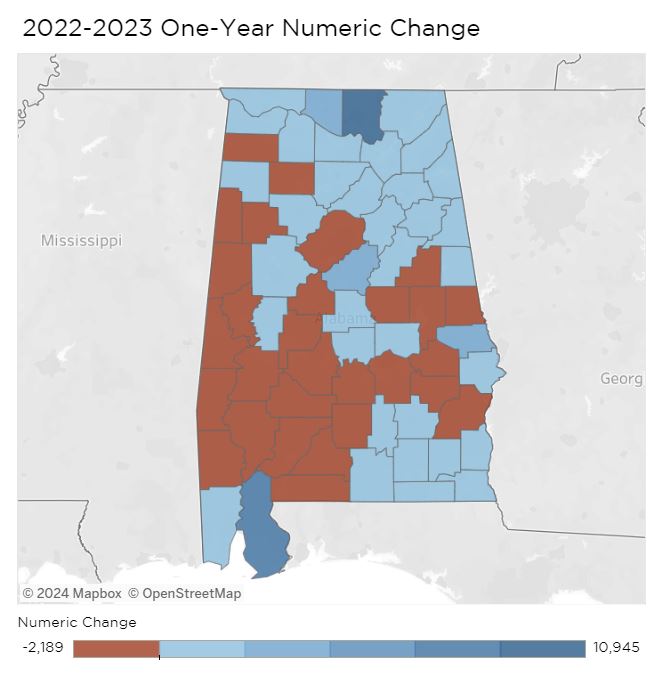
Domestic in-migration is powering population growth in hot spots like Madison, Limestone County, and Baldwin, as well as in suburban counties around Birmingham and Montgomery. In the latter cases, the central county is losing population while suburban counties gain. Across Alabama, 38 of the 67 counties are seeing more people moving into the county than moving out.
Calhoun and Etowah counties, home to Anniston and Gadsden, respectively, are showing population growth after years of decline. Mobile County also grew, breaking a streak of decline. In fact, all of the state’s metro areas posted population gains except for the Columbus, GA—Metro Area, which includes Phenix City and Russell County.
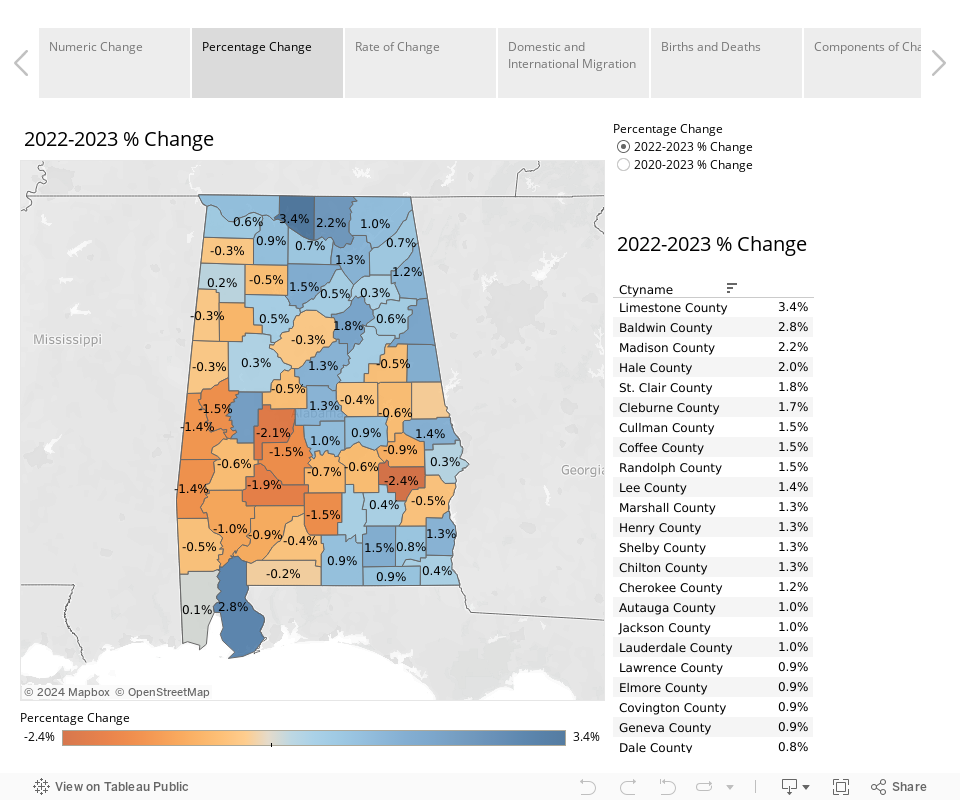
Rural counties, particularly in Alabama’s Black Belt, continued to lose population. The biggest drop in percentage terms was Bullock County, where the population declined by 2.4%, or 246 residents, according to the estimates. Hale County was the exception to the Black Belt trend. Hale added 289 residents, which amounts to a 2% population increase in a year.
In numeric terms, Jefferson County lost the most people, with a decline of 2,186. That is less of a loss than in 2021 or 2022. Deaths were down, births were up, resulting in a positive natural change of 394. International migration added 818, a slight increase over the year before. However, domestic migration remained a drain, with 3,417 more people moving out of the county than moved in, according to estimates.
Montgomery County also continues to see significant domestic outmigration, but a slight rise in international migration and births and a drop in deaths helped offset the outmigration. Montgomery County’s population has decreased by 1,321. Autauga, Elmore, Chilton, and Lee counties grew.
Mobile County grew with a smaller net decline in domestic migration, a slight increase in international migration, and a return to positive natural change (more births than deaths). According to the estimates, Mobile County posted a net addition of 242 residents.
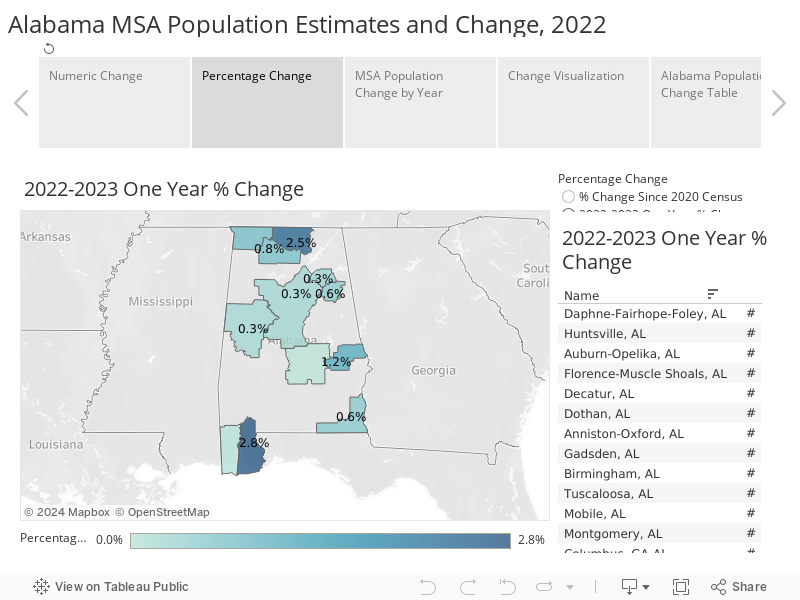
Next-door neighbor Baldwin County added 6,976 people, mostly because of people moving to the coastal county. In percentage terms, the Baldwin County metro area, officially the Daphne-Fairhope-Foley MSA, grew faster than any of the state’s other metro areas.
However, the Huntsville MSA netted the most new residents, with Madison County adding 8,995 and Limestone County adding 3,786. Adjacent North Alabama counties like Lauderdale, Morgan, Marshall, Jackson, Lawrence, and Cullman grew.
The Dothan-area Wiregrass counties also saw population growth, as did counties on the Alabama-Georgia Border like Cleburne, Randolph, and Cherokee.
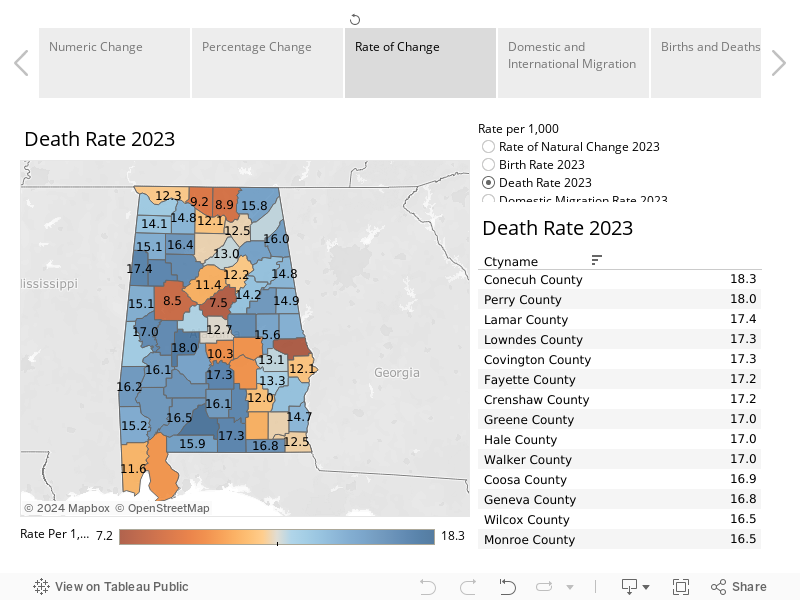
Most counties bordering Mississippi lost population. The median age in rural counties tends to be higher, which correlates with higher death rates.
Those counties also tend to experience more people moving out than moving in.
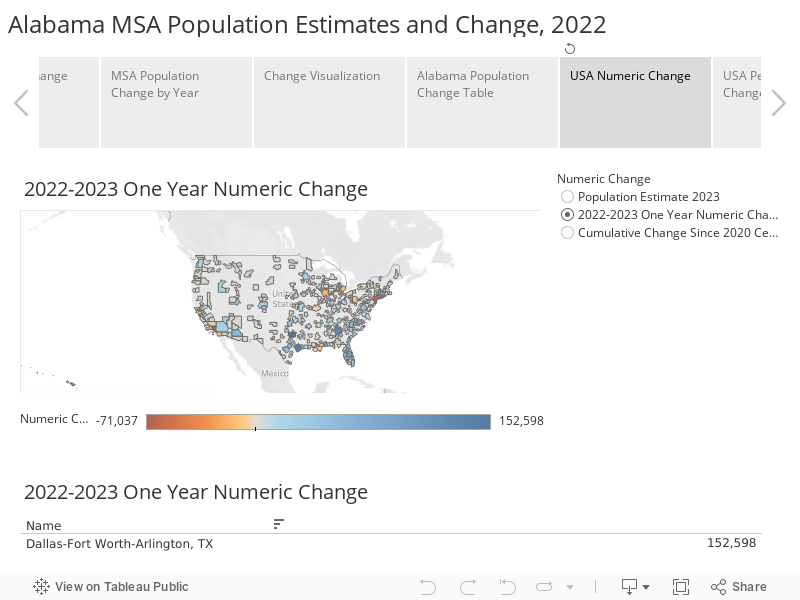
Use the tabs and menus to explore the estimates for counties and metros you are interested in. If you want to see how Alabama compares with the rest of the United States, visualizations of the population estimates and change are available for counties and metros across the country.
Similar stats are available for metro areas as well. Use the controls to zoom in on areas of interest.