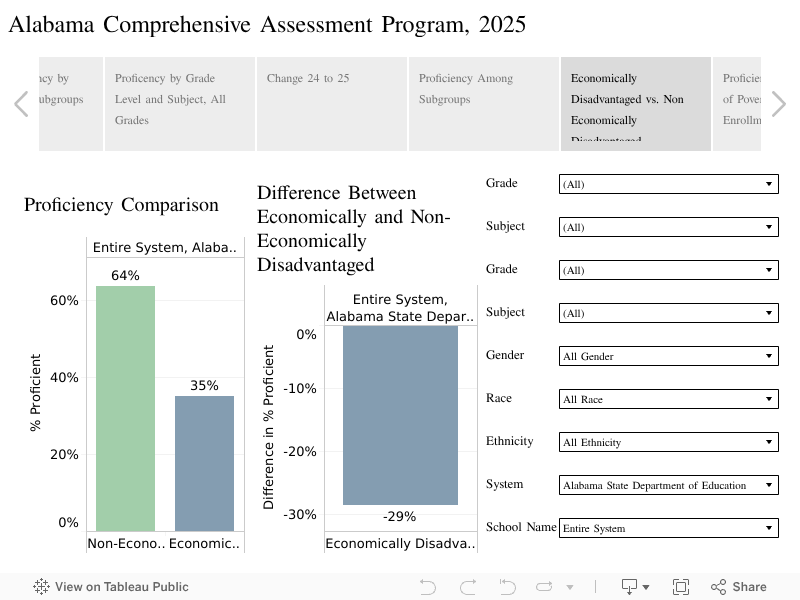
The Houston County School System ranks 129th out of 140 school systems in Alabama in per-pupil expenditures. More than half its students — 57% — qualify as economically disadvantaged, slightly above the state average.
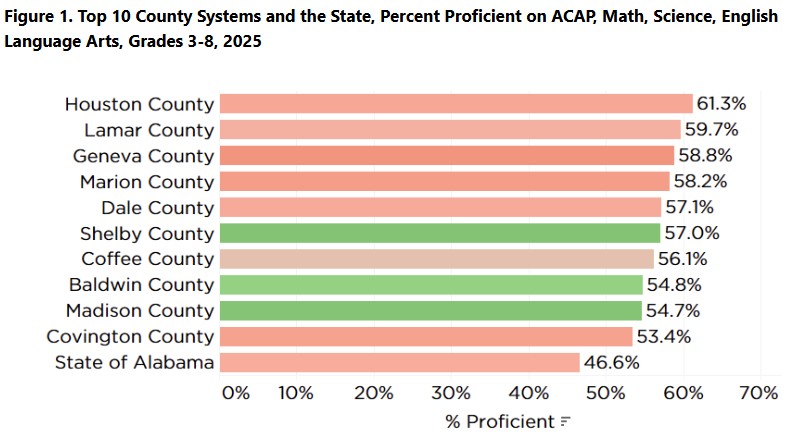
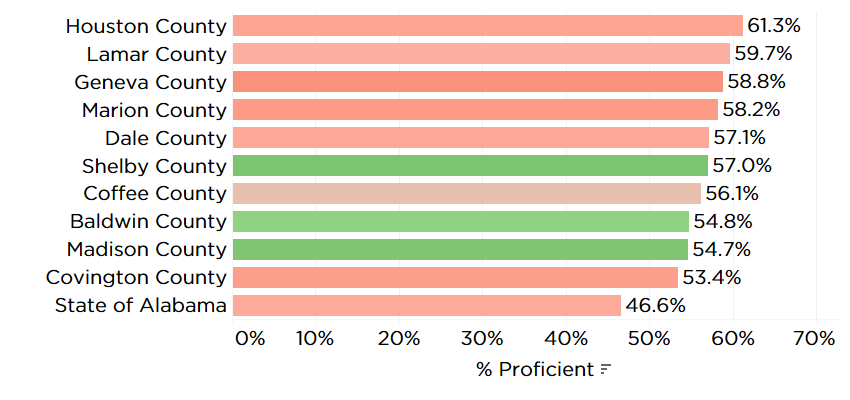
And yet, Houston County outperformed every other county school system in Alabama on the 2025 ACAP, the state standardized test, in grades 3-8. More of its students tested proficient in math, science, and English Language Arts than in any other county system in the state.
Figure 1. Top 10 County Systems and the State, Percent Proficient on ACAP, Math, Science, English Language Arts, Grades 3-8, 2025
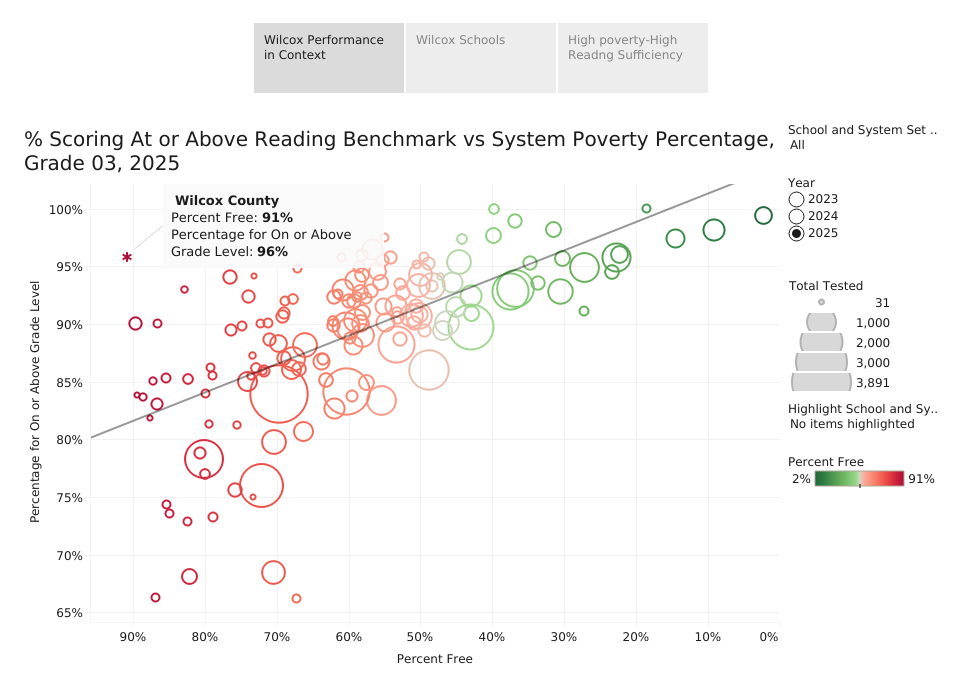
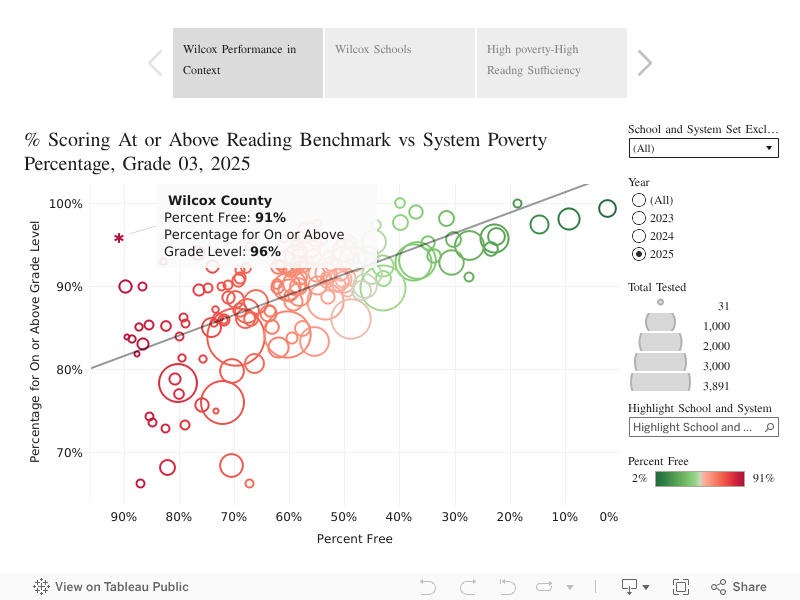
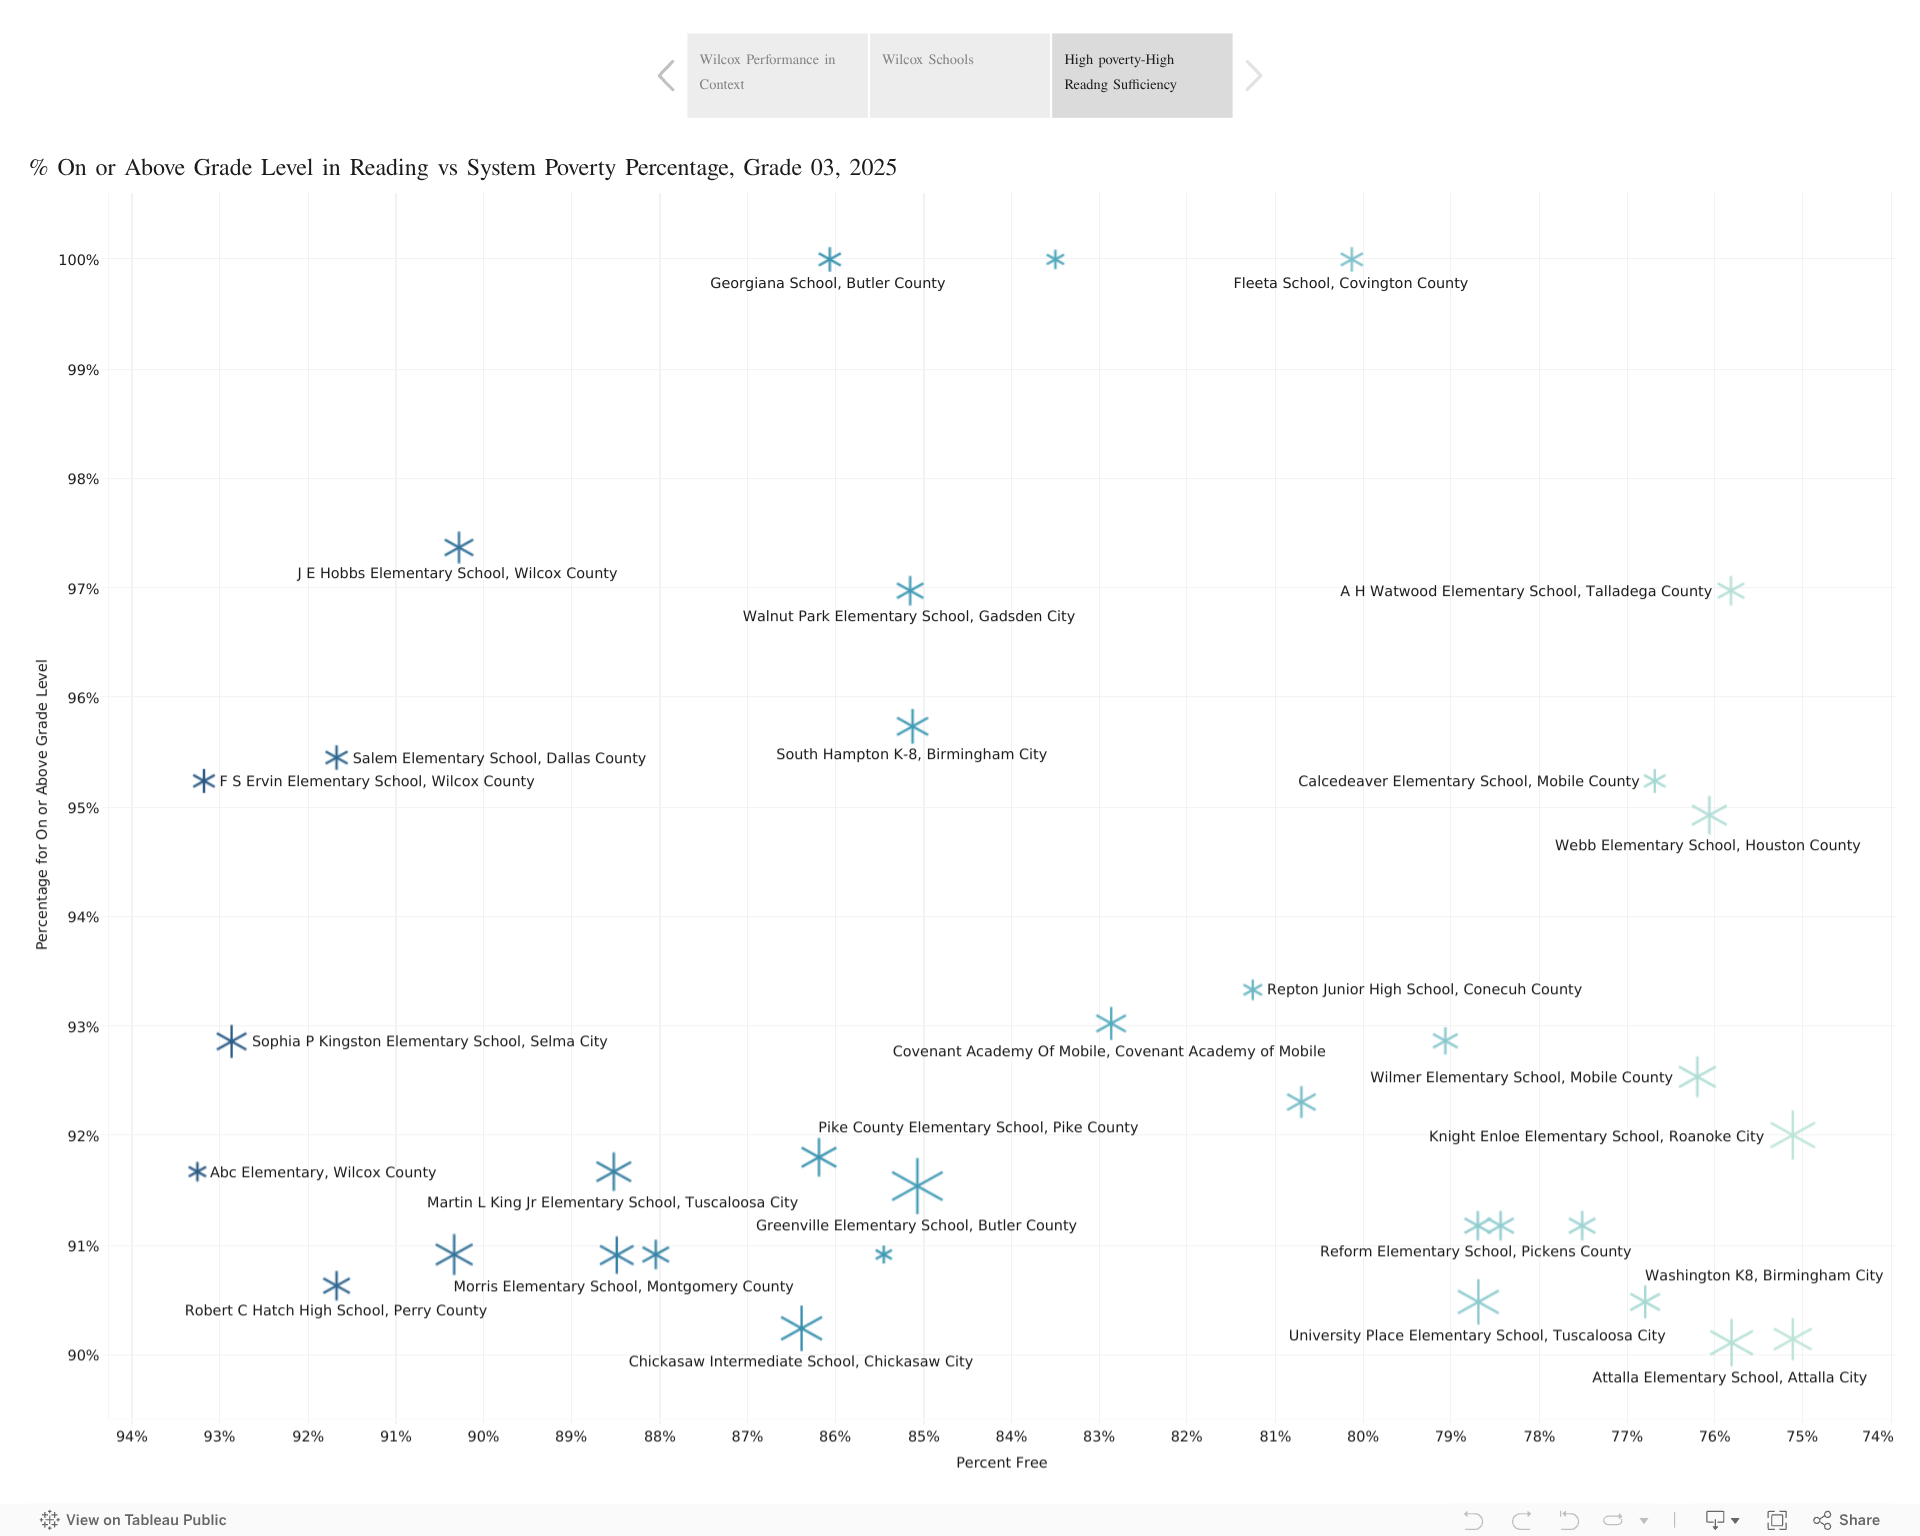
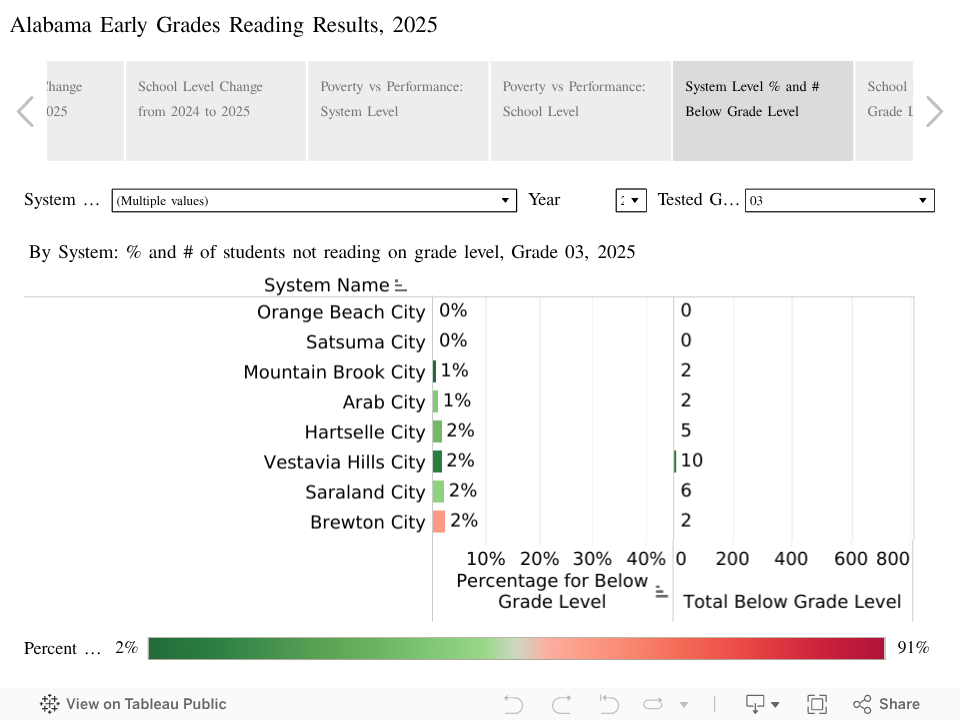
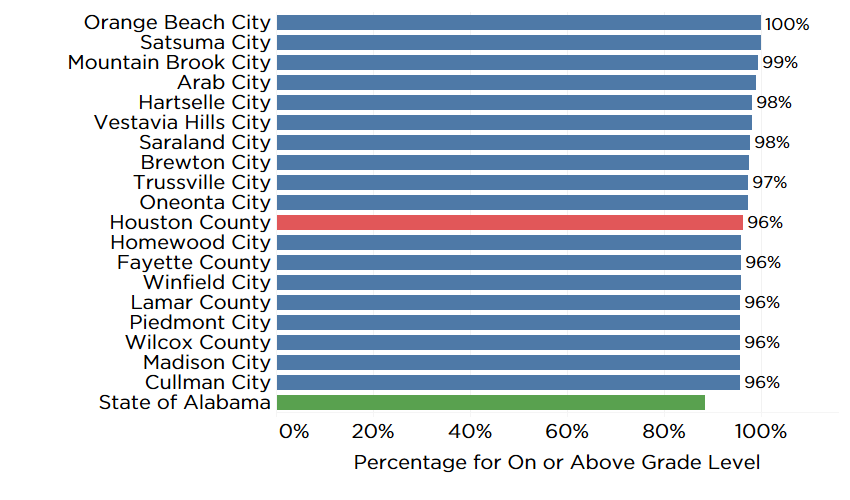
Ninety-six percent of Houston County third graders tested at or above the grade-level reading benchmark — placing the system among the top 20 in Alabama, and doing so with nearly 500 third graders. Most systems with comparable proficiency rates are working with far fewer children.
Figure 2. Top Performers in 3rd Grade Level Reading, Plus State, 2025
County school systems are notoriously hard to run. They can be geographically sprawling, with diverse communities and conditions within each feeder pattern. They generally have less money per student than city systems, and they face the ongoing challenge of building a shared sense of purpose and consistent quality across multiple schools with diverse populations.
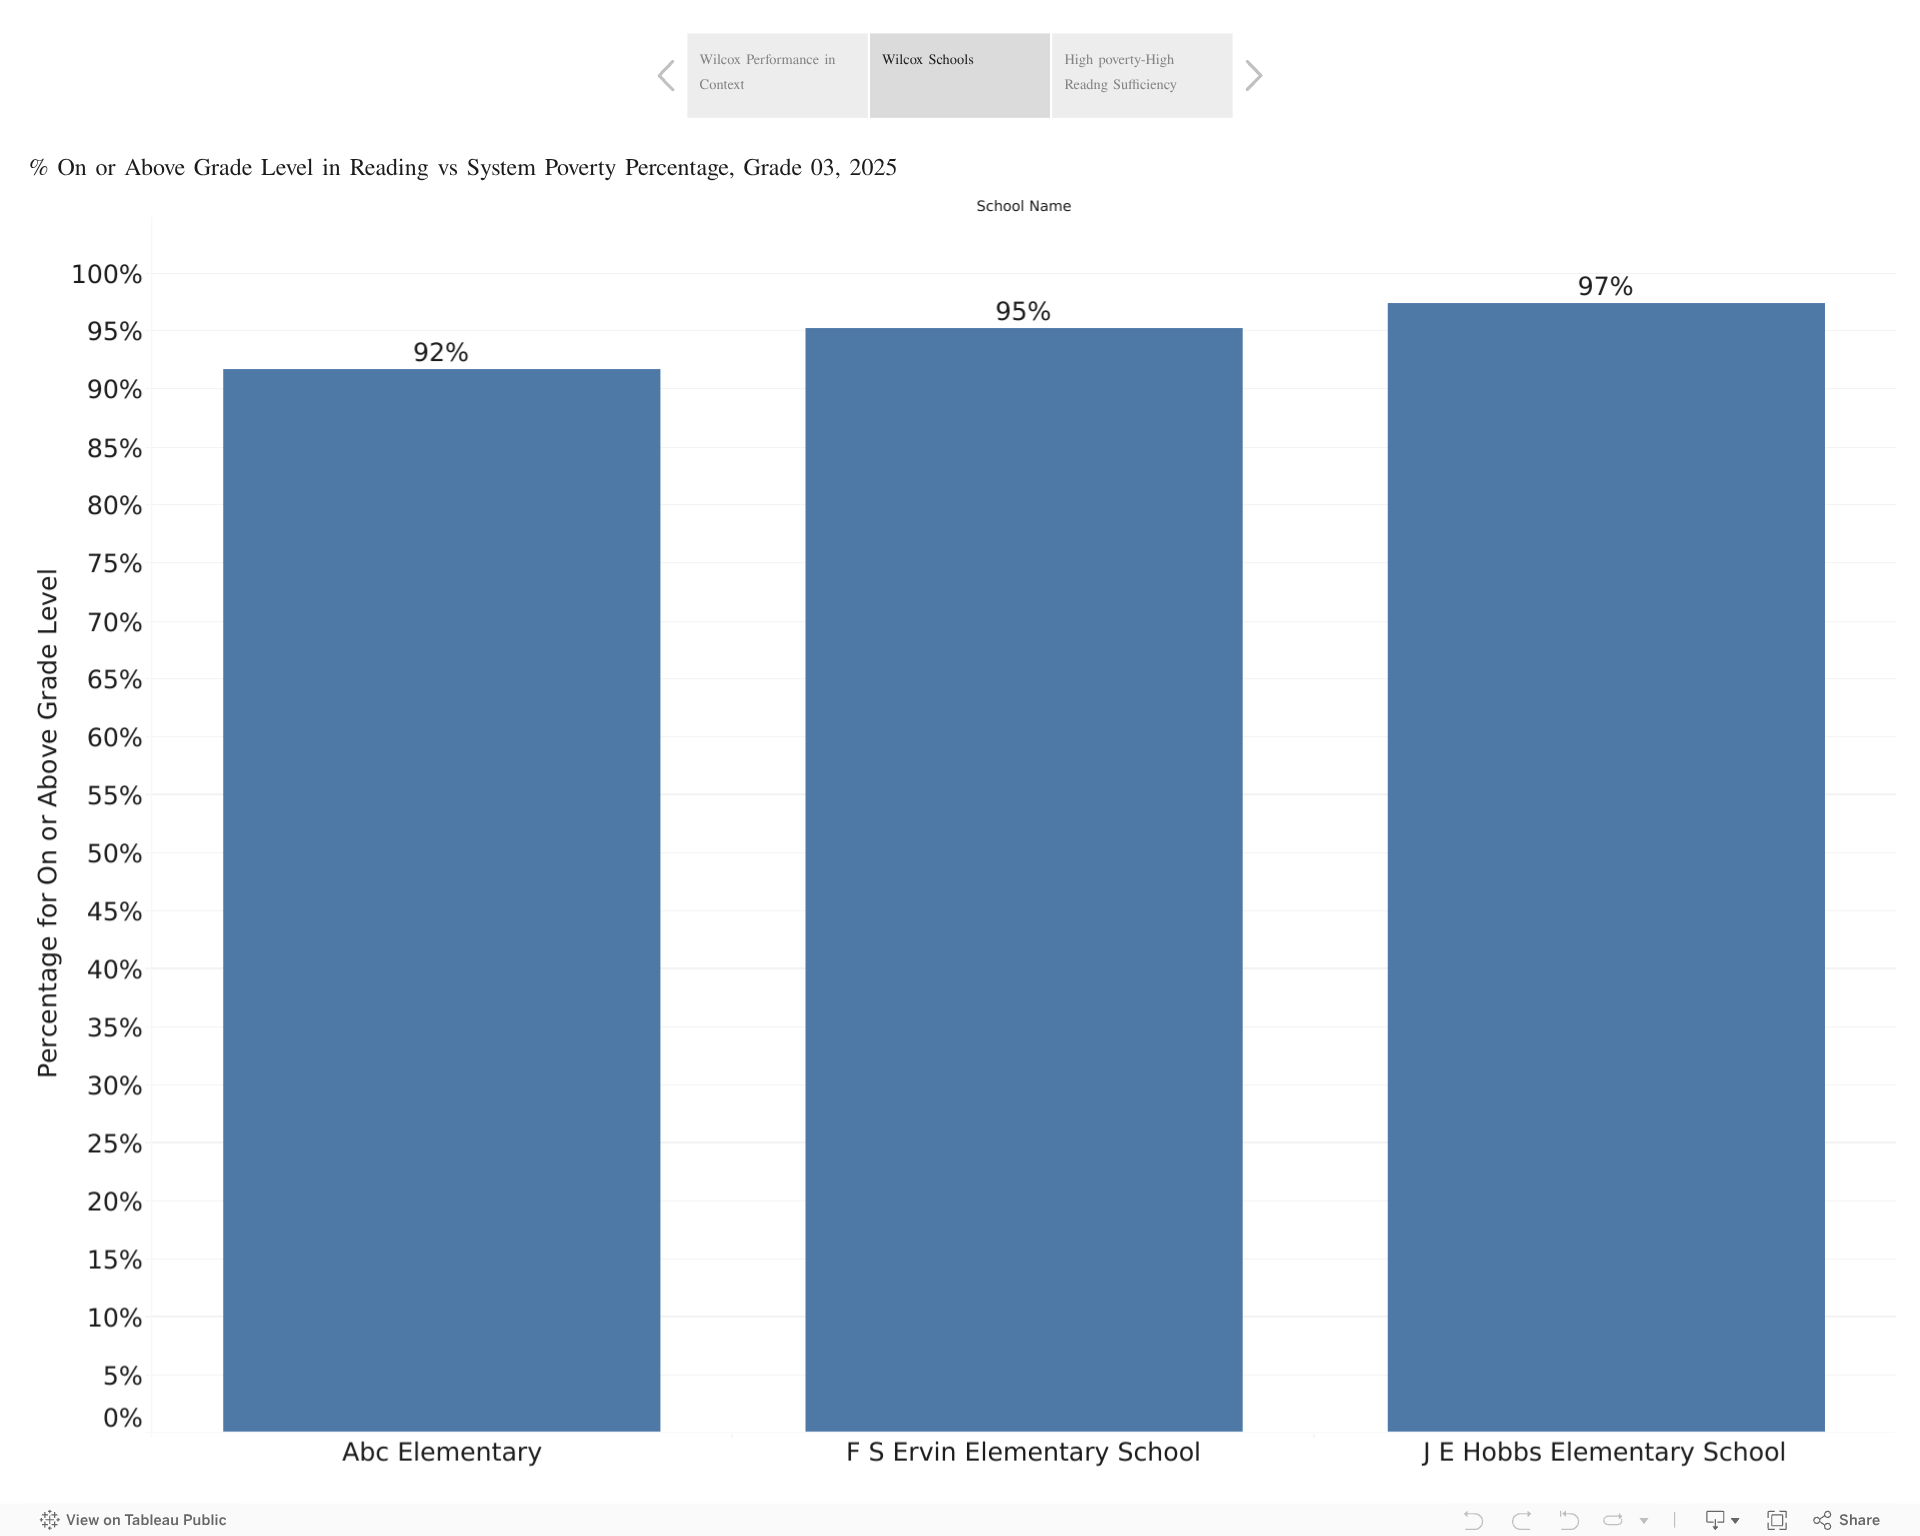
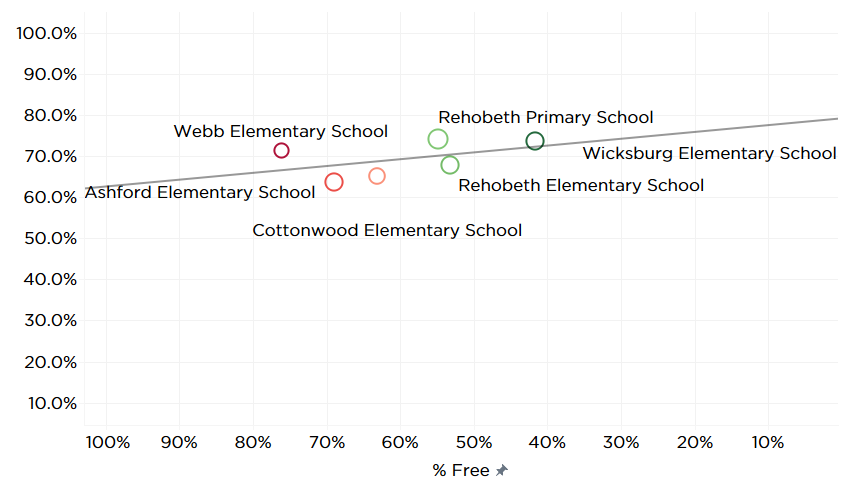
Houston County appears to have found an approach that avoids those pitfalls. While the socioeconomic composition varies widely among the six elementary schools in the system, the rate of student proficiency varies only narrowly.
The school with the highest percentage of economically disadvantaged students scores nearly as well on the state’s ACAP assessment as the school with the lowest rate of economic disadvantage.
Figure 3. Houston County Elementary Schools’ ACAP Performance vs. Percent of Students Economically Disadvantaged, 2025
Keys to Success
Houston County’s story is the latest installment of Keys to Success, PARCA’s ongoing project to investigate schools and systems that outperform expectations and look for lessons that can be shared broadly. Previous installments include features on Wilcox County, where 96% of students passed the third-grade reading benchmark despite Wilcox having the state’s highest rate of student economic disadvantage, and Opp High School, where the college-and-career-ready rate among seniors actually exceeds the school’s graduation rate.
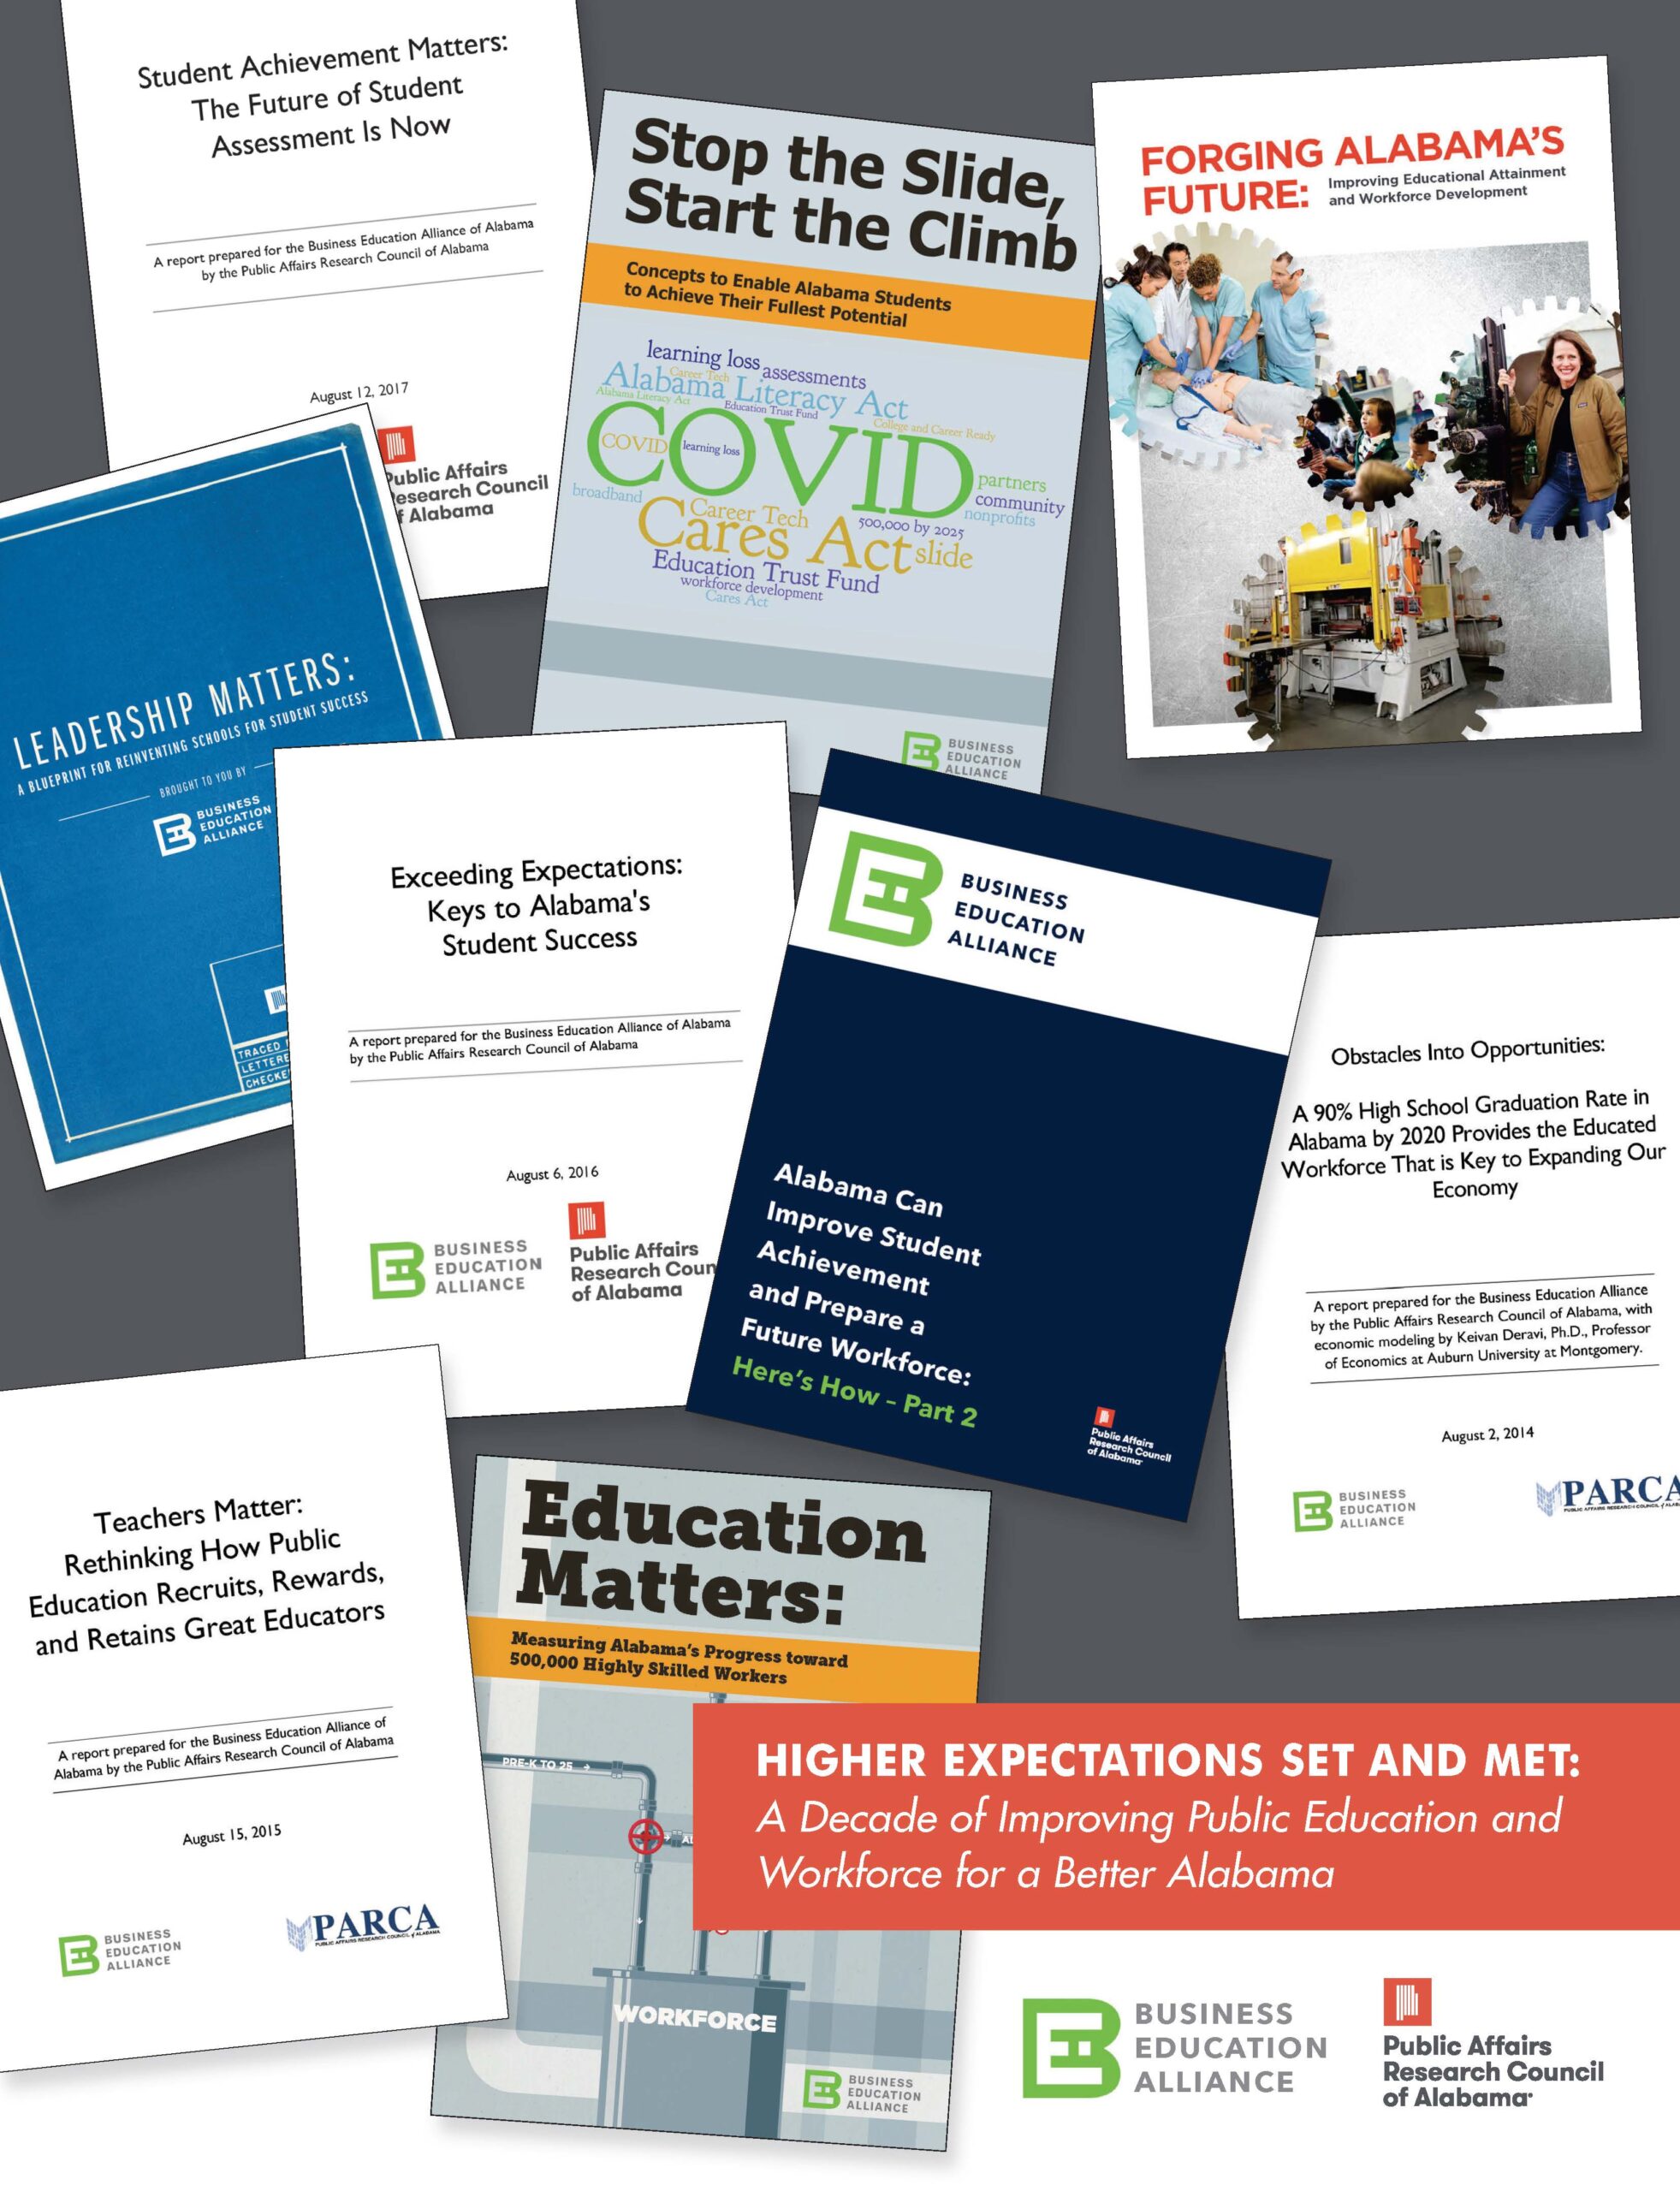
The series builds on earlier PARCA research, including features on Piedmont City Schools and reports like Exceeding Expectations, sponsored by the Business Education Alliance.
The Keys to Success series is supported by the generosity of the J.L. Bedsole Foundation, Charles and Estelle Campbell Foundation, The Daniel Foundation of Alabama, Hugh Kaul Foundation, Mike & Gillian Goodrich Foundation, Robert Meyer Foundation, Susan Mott Webb Foundation, and Wells Fargo Foundation.
Foundation, Framing, and Skilled Carpentry
Before running for Houston County Superintendent, Brandy White was a teacher and an assistant principal, and in his spare time, he and a partner developed a home-building business. After being elected superintendent of Houston County Schools, he left homebuilding. However, the approach he and his team have built in Houston County could be compared to home construction: a repeatable process that produces predictable, high-quality results regardless of variations in local conditions.
That process rests on five elements: understanding the blueprints, procuring quality materials and tools, measuring carefully before you cut, building a great team of carpenters, and celebrating what gets built.
Blueprints: Know What You’re Building
Houston County is taking advantage of a framework designed by Alabama educators and policymakers. Starting around 2010, Alabama began paying serious attention to its courses of study. The state adopted detailed learning standards that define what children should be learning at each grade level, laid out in a logical, building-block sequence aligned with the pace of learning students follow across the country.
Those standards have continued to evolve and improve, but their core function — giving teachers and students increasingly clear guidance about what to learn and when — has only grown stronger.
In Houston County, those standards aren’t just a reference document. They are the foundation on which everything else is built. Instruction is based on the standards. Assessments are built to mirror the standards. The logic is straightforward, as White’s team puts it: base instruction on the standards, test on the standards, and you will achieve the standards. The ACAP isn’t treated as an external imposition or a mysterious hurdle — it is a standards-based assessment, and Houston County treats it as such.
Procure Quality Materials and Tools
Knowing the plans is one thing. Successful execution requires the right tools and materials.
Houston County’s instructional team has worked deliberately to equip teachers and students with high-quality materials without overwhelming them with options. The education marketplace is flooded with instructional resources, computer-aided programs, curriculum packages, and textbook adoptions — many of them aggressively marketed to districts. Houston County officials made a conscious decision to choose a limited number of proven, high-quality tools and stick with them rather than chasing every new offering.
The system adopted SAVVAS as its core instructional platform and built a centralized resource hub where teachers can find what they need in one place. Supplemental tools like iReady, Moby Max, and IXL for high school students round out the toolkit without cluttering it.
The system also used ESSER funds — federal relief dollars that followed the pandemic — to put a Chromebook in the hands of every student. Before that, students took tests and accessed computers in shared labs, a logistical bottleneck that disadvantaged students who weren’t comfortable with the technology. Paper-and-pencil work is still valued and encouraged, but students also need to be fluent with the tools they’ll encounter on state assessments: drag-and-drop graph builders, multi-select questions, two-part items. The question Houston County asks itself is an important one: when a student struggles with a test item, is it because they don’t know the skill? Or is it because they’re unfamiliar with the format? Eliminating the second possibility lets teachers focus on the first.
Teachers, meanwhile, were equipped with interactive panels, laptops, and printers — the basic modern professional tools that allow them to do their jobs well.
Measure Twice, Cut Once: Assessment as Instruction
Perhaps the most distinctive element of Houston County’s approach is the way it has rebuilt its internal assessment system from the ground up.
The system administers summative assessments three times a year, timed so that the third assessment falls just before students sit for ACAP. Those assessments aren’t generic checkpoints — they are built to mirror the state test in structure, question type, and depth of knowledge, aligned directly to what’s in the course of study and calibrated to the pace students need to maintain to reach grade-level by testing time. And since ACAP is designed to test student mastery of Alabama’s learning standards, the coursework and instruction, the formative testing, and the standardized tests are all pointing in the same direction.
Nothing about student readiness is left to guesswork. Locally-designed 9-week tests are administered across the system, keeping students on pace and giving teachers data on class progress. Principals don’t have to wait for end-of-year results to know where their schools stand. The data tells them — specifically and in time to act.
And act they do. With each round of testing, the instructional teams at the schools dig into the results. Teachers identify which questions students missed, which standards those questions addressed, what type of question was involved, and what percentage of students got it right. When something goes wrong, they ask why. One telling example: seventh graders performed poorly on a particular item. Analyzing the item tripping students up, teachers discovered it was based on a sixth-grade skill that hadn’t been revisited. That diagnosis transformed data into an improved teaching strategy.
Building a Team
A house is only as good as the people who build it, and Brandy White is direct about what that means in practice.
Principals in Houston County are expected to be instructional leaders, not building managers. They have to know the data. They have to know what effective teaching looks like. They need to be in the classroom observing instruction — and they have to be willing to have hard conversations when something isn’t working.
That accountability runs in both directions. Principals are given real authority: they have the ability to make their own hiring decisions, with support from the central office rather than interference from it. The expectation is high, but so is the trust. As White puts it: “Hire good people and let them do their jobs.”
Non-tenured teachers who aren’t getting the job done are not renewed. The standard isn’t punitive — “No one is scared if they are getting it done” — but it is real. The culture White describes is one of high expectations paired with genuine support, and the result, he says, is that the educators who come to Houston County and thrive don’t want to leave.
“At the end of the day, none of our plans or initiatives matter if we don’t have strong teachers and staff who believe in the work and are fully bought in,” White said. “That’s really what drives success.”
The north star, always, is the students. “It’s got to be about the kids,” White says.
Celebrate What Gets Built
The fifth element of Houston County’s approach is easy to underestimate: the deliberate cultivation of a culture of pride and healthy competition.
When students do well, the system makes a point of recognizing it — honoring students who achieve perfect scores and students who make significant growth, because both matter. White describes a shift in mindset that has taken hold when the ACAP comes around. Instead of dreading testing or mailing it in, teachers and students are ready to show their work: “We’ve changed the culture. It’s time to show everybody what you know. This is the time to show how hard you’ve worked.”
The competition that has emerged is, as White describes it, competitive in a good way. Schools compare results. Students and teachers track progress. The system ranked first in the state in math and fourth in ELA in 2025 — and people know it, and they take pride in it.
“Excellence is the journey,” White says. No excuses. Positive outlook. And results to match.
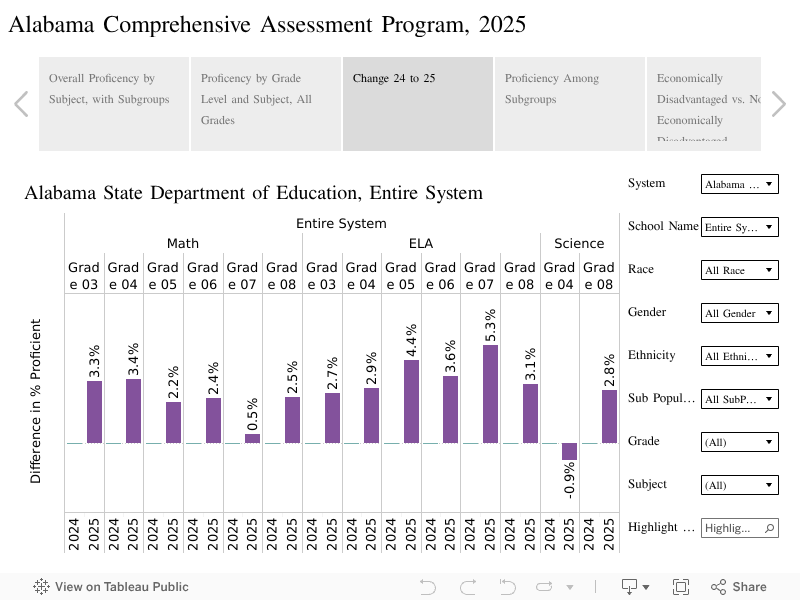
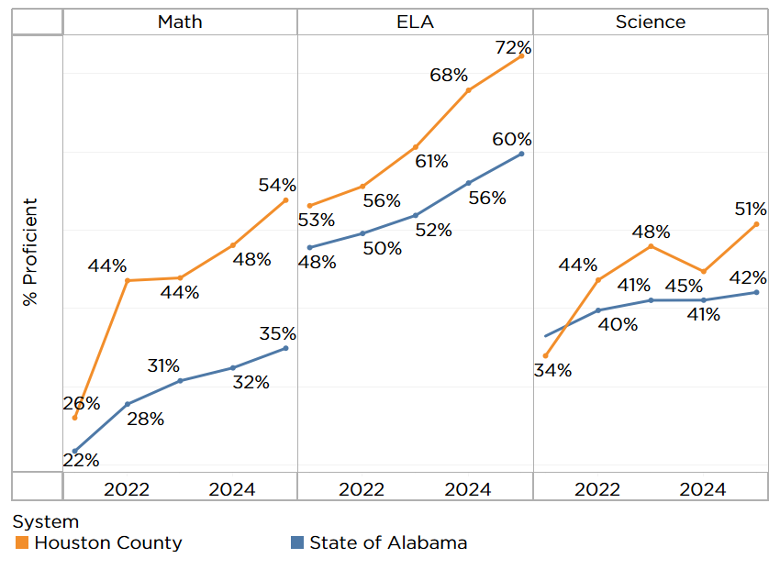
Figure 4. Houston County vs State of Alabama, ACAP Proficiency by Subject, over time. Grades 3-8
What Houston County Teaches Us
Houston County Schools is not a story about abundant resources or favorable demographics. It is a system that concentrates on fundamentals: clear standards, strong materials, rigorous and aligned assessment, empowered and accountable principals and teachers, and a culture that celebrates the hard work of learning.
Based on the data, the system has built and continues to improve a repeatable process that, when applied with care, produces results you can measure and similar outcomes across diverse schools and student populations.
And Houston County is not resting on its laurels. This school year, the system set a theme: “Positive Mindset; No Excuses.”
That message is displayed throughout their schools, even setting it as the background on every computer.
“What’s been especially encouraging is seeing how much our students have embraced it, and that’s a direct reflection of the teachers and staff who bring it to life every day,” White said. “As we all know, any plan is only as good as the people implementing it.”