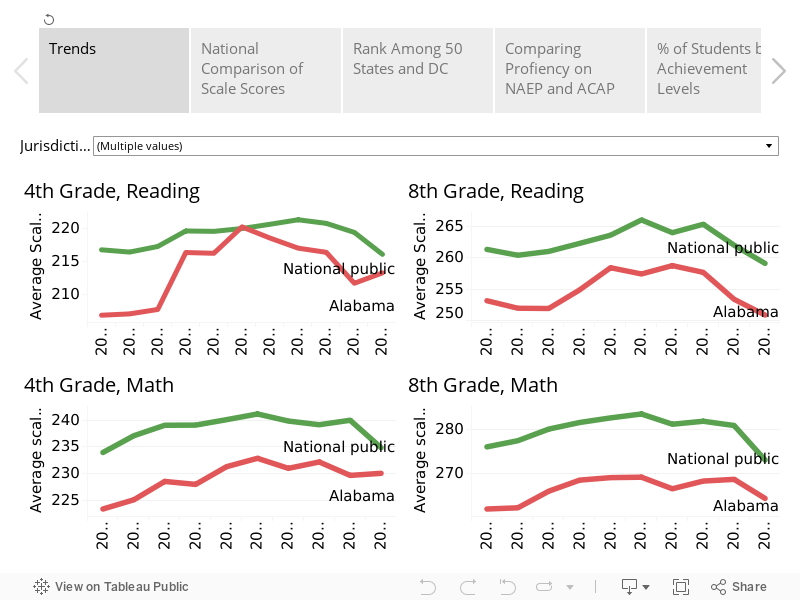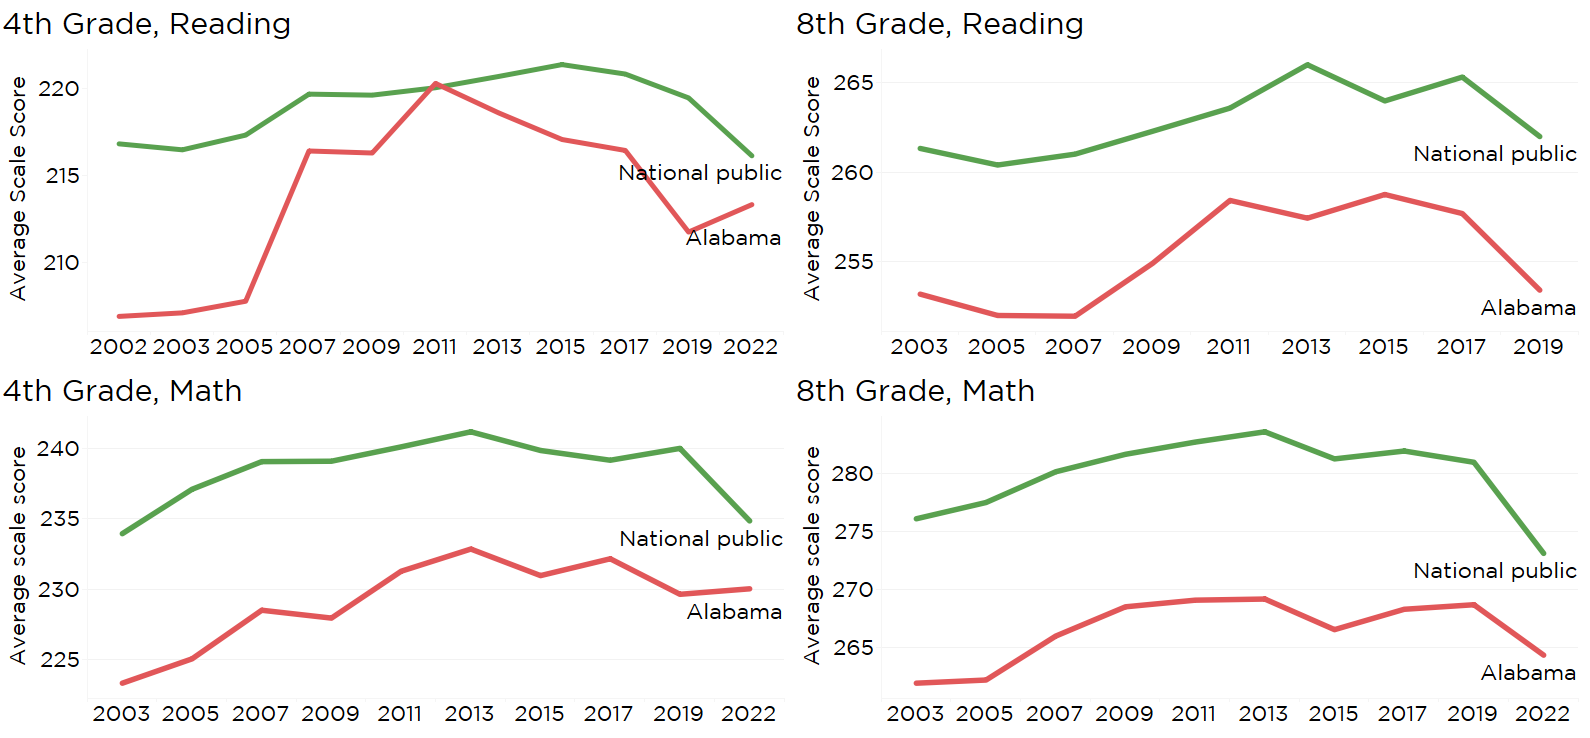
Alabama 4th-grade students performed better in both reading and math between 2019 and 2022, leading to improved national rankings for Alabama on The Nation’s Report Card, the National Assessment of Educational Progress (NAEP). That progress came despite the pandemic, which took a heavy toll on academic performance nationwide. Nationally, NAEP scale scores recorded their worst drops ever.
Alabama was the only state where 4th graders improved in math performance. It was one of only five states to see improvement in Grade 4 reading. Only Louisiana had a higher gain in 4th-grade reading.
To be clear, Alabama’s average scale score gain in both reading and math was not large enough to be considered statistically significant, but, when compared to sizeable scale score declines in many other states, the shift was notable. Alabama’s 8th-grade scale scores were down in reading and math, though, in the case of math, because Alabama lost less ground than other states its national rank improved.
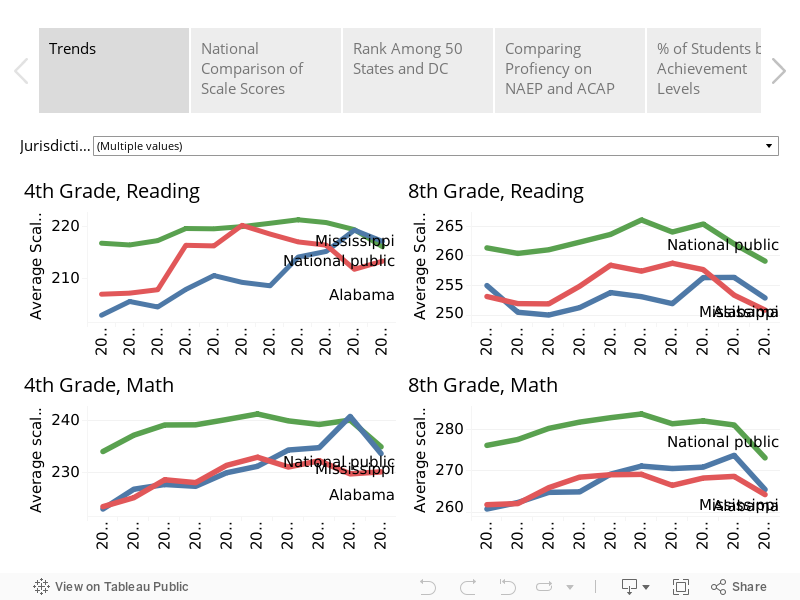
Figure 1. NAEP Performance over time, Alabama vs. U.S.
NAEP results are derived from standardized tests given to a representative sample of students in each state. The most recent test was administered in the spring of 2022. The NAEP is the only assessment that is given in every state and thus provides comparative information across the nation.
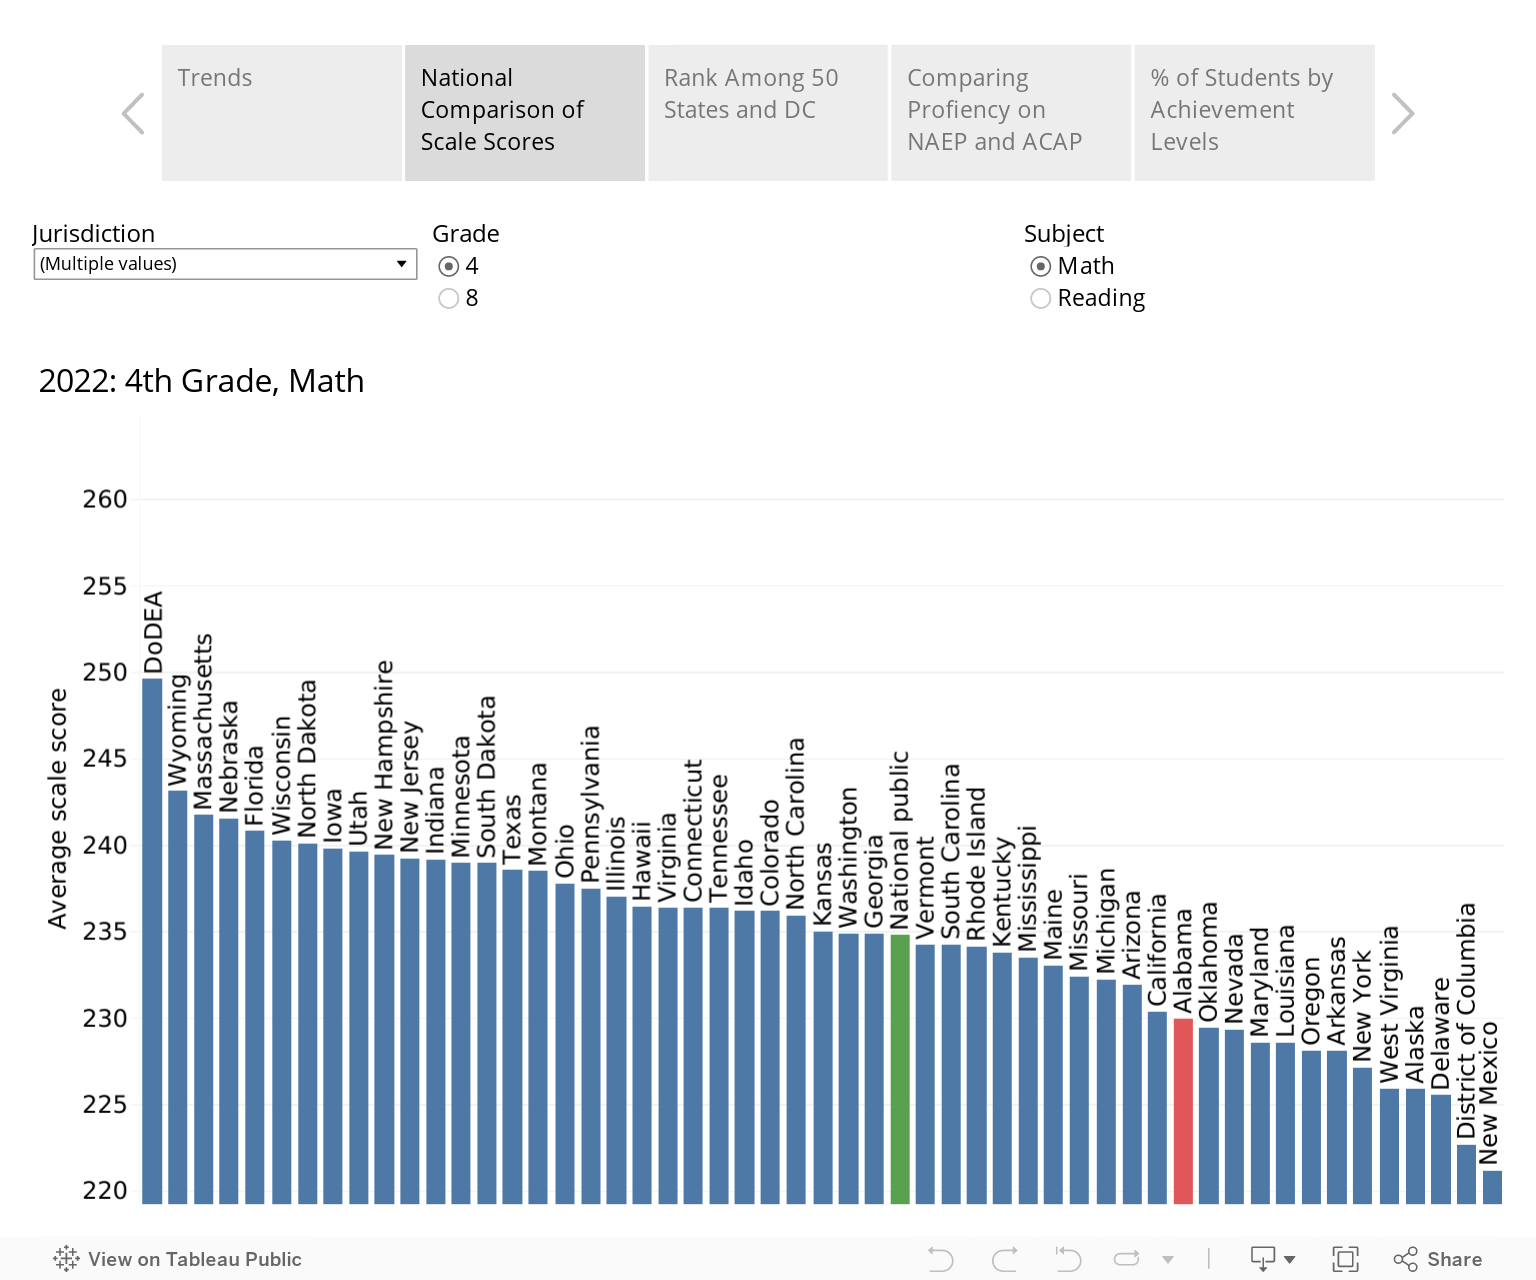
Figure 2. Average NAEP scale scores for U.S. States, 2022. Menus change views by grades and subject
Similar findings from state-level assessments
In a separate analysis of state-level assessment data, Alabama’s results have gotten national attention. An analysis produced by educational researchers and shared with al.com showed that Alabama school districts showed greater stability and improvement from 2019 to 2022 than schools in much of the rest of the country.
Researchers at The Educational Opportunity Project at Stanford University and the Center for Education Policy Research at Harvard University collaborated to publish and analyze the Education Recovery Scorecard Project, the first district-level view of changes in academic performance from 2019-2022. Several Alabama systems are among the top performers for improvement over the period, including Boaz, Piedmont, Andalusia, Arab, Cullman, Muscle Shoals, Hoover, Hartselle, Pike Road, Vestavia Hills, and Mountain Brook.
Alabama rising?
Since 2003, Alabama students have ranked at or near the bottom in math on the NAEP in both grades tested, 4th and 8th. In reading, Alabama 4th graders had improved enough to meet the national average by 2011 but drifted downward in subsequent years. Alabama 8th-grade reading scores have been in the bottom five consistently.
In 2019, Alabama 4th graders ranked No. 51 in math compared with students in other states and the District of Columbia. In 2022, Alabama 4th graders ranked 39th. In reading, Alabama 4th grade student performance rose from 48 to 38.
Average scale scores for Alabama 8th graders declined in both reading and math. However, other states experienced steeper drops in math, so Alabama’s rank climbed from 51 to 46. In 8th-grade reading, Alabama maintained its rank of 48 out of 51.
Figure 3. Scale score rank of states, by grade and subject
The improvements in 2022 indicate some progress, but Alabama has a long way to go before it is providing a nationally competitive education to all students. In the 2022 results, students in Mississippi once again scored ahead of Alabama in both reading and math at both grade levels. Alabama did close that gap with Mississippi in math and in 4th-grade reading, but the gap widened in 8th-grade reading.
Figure 4. Alabama, Mississippi, and U.S. NAEP scores compared
Results coincide with investments
The positive results coincide with the recent infusion of money and effort in early grades reading. The Alabama Literacy Act in 2019 was accompanied by increased funding for the Alabama Reading Initiative (ARI). ARI provides professional development and support for teachers. The state also requires a dedicated reading coach to work with K-3 teachers. The coach and teachers monitor reading data, identify struggling readers, and provide enhanced support. That includes providing services from specialists trained to diagnose and work with children with learning challenges like dyslexia.
In math, Alabama realigned its math standards in 2019, with one of the aims being to align better with national expectations represented by the NAEP. The Alabama Math and Science and Technology Initiative (AMSTI) also altered its tactics, allowing it to reach more schools and teachers. Extra federal relief money also allowed some districts to hire math coaches to work with teachers. In 2022, the Alabama Legislature passed the Alabama Numeracy Act, which provides increased funding and calls for a strategic approach to improving math performance, borrowing some of the approaches deployed to support literacy.
PARCA showcased investments in AMSTI, ARI, and Mississippi’s approach to educational improvement at the PARCA Annual Forum in March of 2022. The Forum webpage provides recordings of the presentations, more information, and resources.
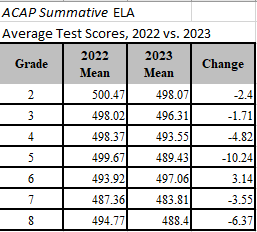
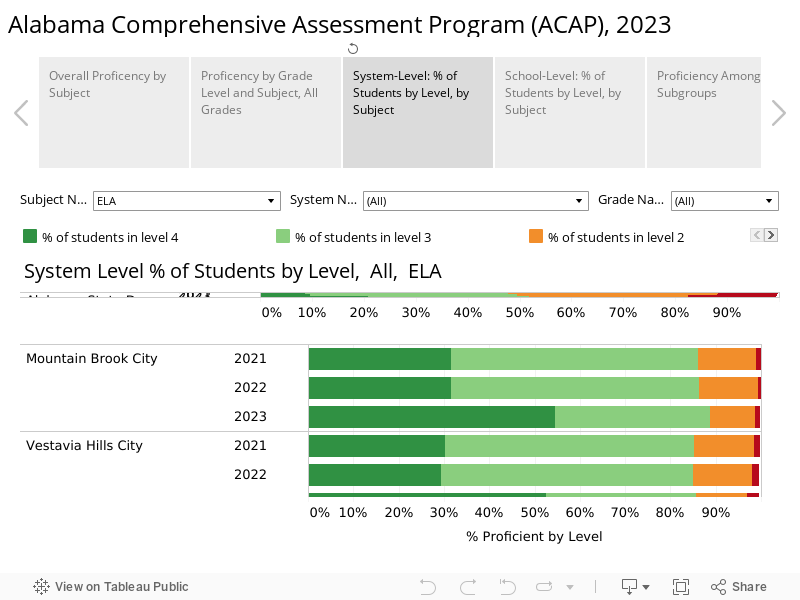
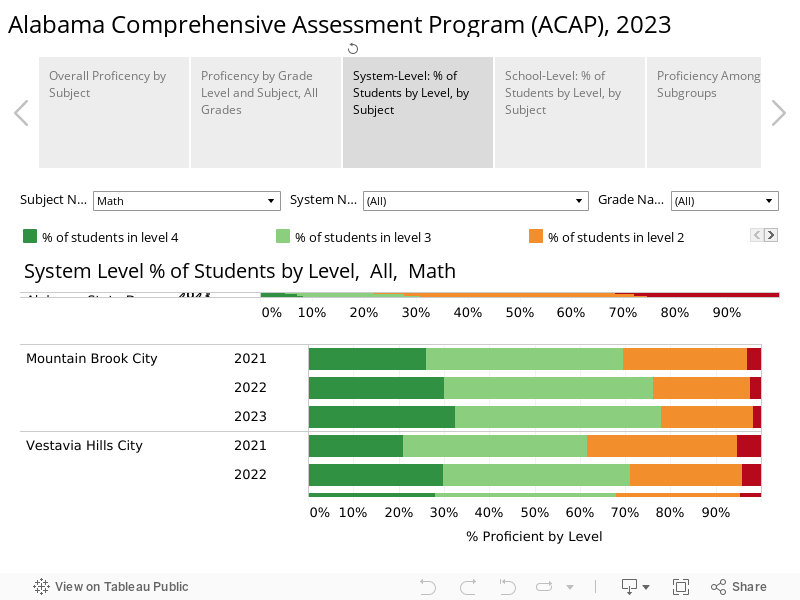
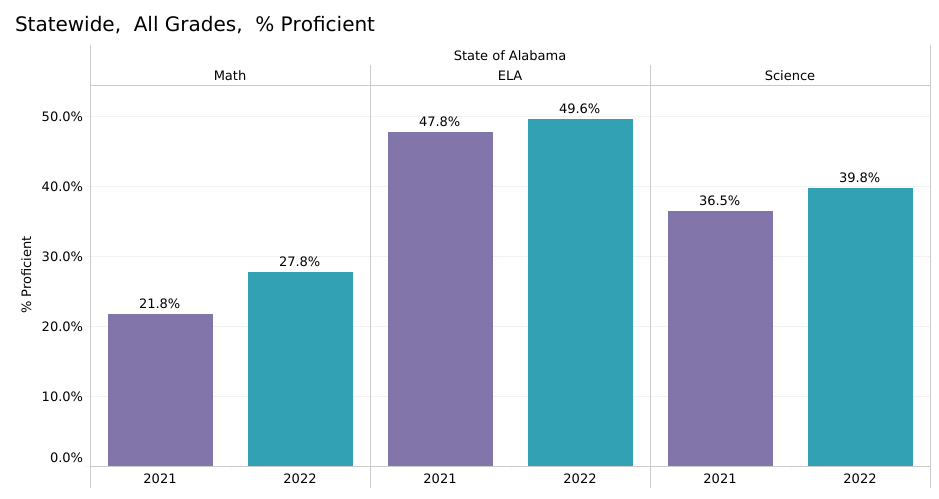
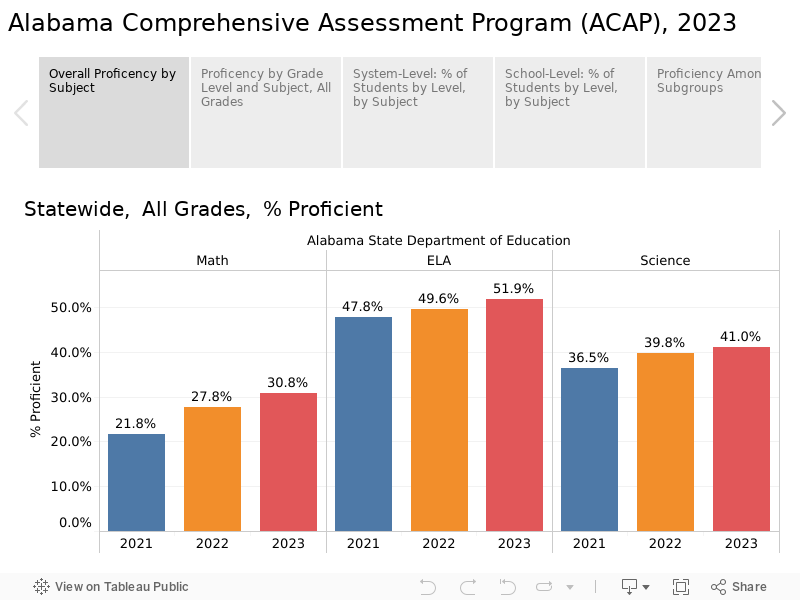
While the gains on the NAEP in 4th-grade reading and math might not be statistically significant, those results mirror improvements Alabama students posted on the Alabama Comprehensive Assessment Program (ACAP), the state’s standardized test. Compared to 2021, the state saw gains, particularly in early grades mathematics.
Comparing NAEP to Alabama’s test of proficiency
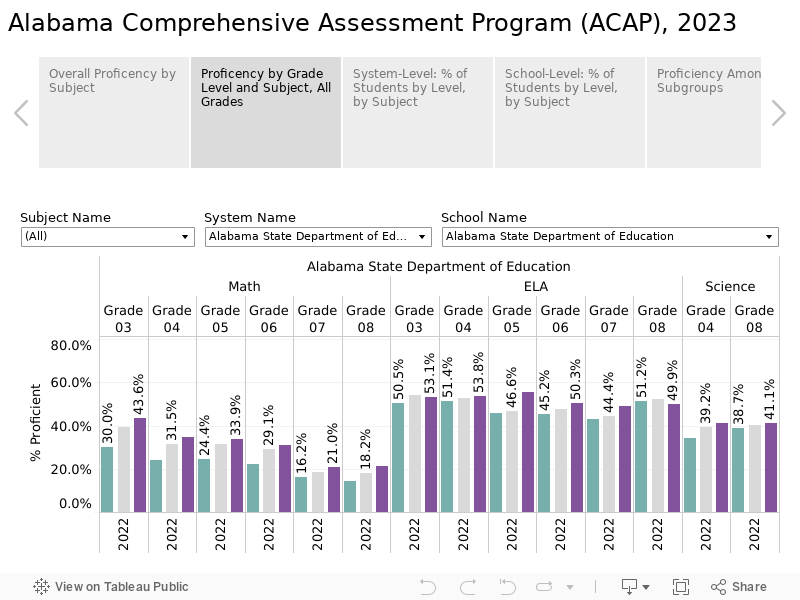
Alabama has administered several different achievement tests over the past decade, which leads to confusion about how Alabama students are performing. Complicating the picture is that the different tests, including the NAEP, have different measures of proficiency. Figure 5 compares the results of the 2022 NAEP with the results of the ACAP, also given in the spring of 2022.
The results of both tests are expressed in terms of the percentage of students who scored proficient or above on the tests.
The bars in red represent the percentage of Alabama students scoring proficient on the NAEP and on the ACAP at both grade levels and in both subjects.
The green bars present the percentage of students in the U.S. that scored proficient on the NAEP.
Figure 5. Scores from Alabama’s ACAP vs. NAEP, 2022, by subject and grade
Comparing NAEP and ACAP results, it is apparent that Alabama’s ACAP English Language Arts assessment is much more generous when it comes to grading student proficiency in English.
In contrast, ACAP produces results similar to NAEP’s in math.
Except for the ELA scores on the ACAP, both tests indicate that only somewhere around 20-30% are reaching proficiency. The National Assessment Governing Board sets proficiency levels and describes them as follows: “Students performing at or above the NAEP Proficient level on NAEP assessments demonstrate solid academic performance and competency over challenging subject matter.” They specify that the NAEP Proficient achievement level does not represent “grade level proficiency” as determined by other state assessment standards.
Figure 6 presents three levels of achievement on the NAEP: the percentage of Alabama students scoring “at or above Basic,” the percentage scoring “at or above Proficient,” and the percentage of students scoring “Advanced.”
Figure 6. Percentage of Alabama Students at each NAEP Achievement Level, 2003-2022
In 4th grade reading and math, students today are ahead of where they were a decade ago: a greater percentage of students are scoring above basic, above proficient, and at the advanced levels.
In 8th-grade math, there has been some progress, while 8th-grade reading gains seen in 2015 and 2017 have fallen away substantially.
Conclusion
The NAEP and the ACAP have provided evidence that Alabama educators and students can improve even in challenging circumstances. The investment and attention to early grades reading and mathematics need to be sustained and accelerated. Alabama has a long way to go to catch the national average or even our neighboring state, Mississippi.
But even as further gains are pursued for younger learners, Alabama needs to find ways to sustain learning gains into middle and high school. The erosion in proficiency in the middle grades could have lasting negative effects in preparing students for high school, college, and careers.