By the end of FY 2021, Alabama tax collections had grown at their fastest pace in recent history, fueled by economic recovery from pandemic shutdowns and by unprecedented injections of federal stimulus for governments, businesses, and individuals.
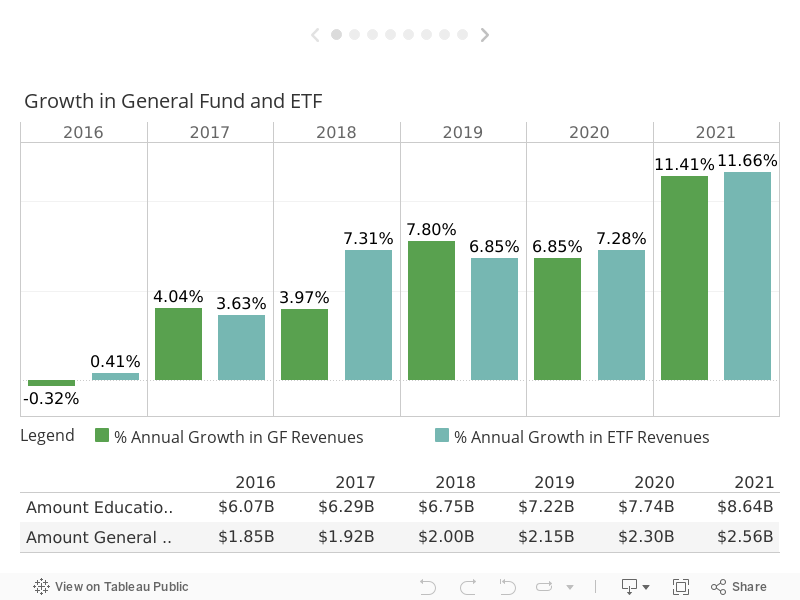
For the fiscal year that ended September 30, both the Education Trust Fund (ETF) and the General Fund grew by more than 11%, compared to historical averages of 3.5-3.7% for the ETF and 2-2.25% for the General Fund. Alabama’s percentage gain in tax revenue since the pandemic crash ranks 7th among the states, according to an analysis by the Pew Charitable Trusts. The growth rates far exceed any year since at least 1995.
Printable Version
However, it is important to remember the growth comes in comparison to FY 2020, a year in which COVID shutdowns constrained growth. During FY 2021 (from October 2020 — September 2021), businesses were open throughout the year, though some were still affected by restrictions related to the virus.
The growth is also taking place in the context of rising inflation, meaning the revenue is based on higher prices, and the money collected won’t have the same purchasing power it previously did. Regardless, the growth was substantial.
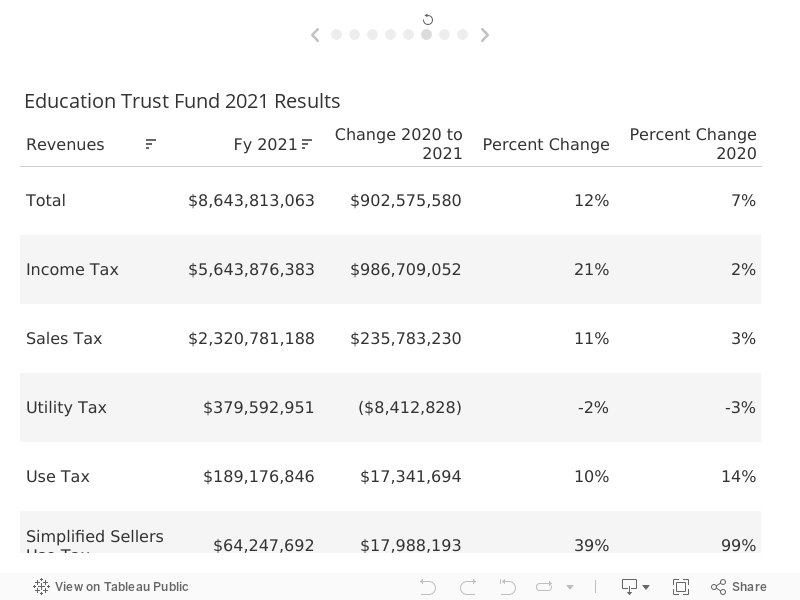
The ETF took in $900 million more than in FY 2020, topping $8.6 billion. And that understates the gain. FY 2020’s total included over $300 million borrowed from the Budget Stabilization Fund for cash flow purposes. That money was returned to the fund later in 2020.
The General Fund took in almost $2.6 billion, an increase of $262 million over last year.
Where did the growth come from?
Based on estimates from the Federal Funds Information for States, Alabama budget analysts estimate that $30 billion in federal relief flowed to individuals and businesses in Alabama. In addition, $16 billion in federal relief was authorized and is in the process of flowing through the state out to agencies and local governments.
That extra money in the hands of consumers fueled spending. Gross sales tax collections increased almost 15%, driven by multiple rounds of economic stimulus payments to individuals and parents with children. Spending was also boosted by unemployment benefits, which provided roughly twice the minimum wage. For some laid-off workers, the benefits amounted to a raise. Aid from the paycheck protection program kept businesses solvent and employees on payrolls.
While the bulk of the sales tax is deposited in the ETF, the General Fund also benefited from the increased spending and changed consumer patterns. The Simplified Sellers Use Tax (SSUT), the tax on online sales, rose almost 40% over 2020 totals (and 2020 was 99% higher than 2019). The Legislature’s decision to deposit the bulk of the SSUT into the General Fund added a growth element to the General Fund that had been lacking. Instead of lurching from crisis to crisis, the fund has kept pace with the rising costs.
Gross individual income tax collections were also up, increasing 13%, despite the fact employment levels haven’t reached pre-pandemic highs. By the beginning of FY 2021, employment levels had rebounded to about 60,000 short of March 2020 employment. Since then, they have continued at that level. Meanwhile, wages have been on the rise as businesses seek workers in the face of a shortage of workers.
Surpluses and Temptations
Thanks to the additional revenue, the state covered the 2021 ETF budget and ended with a balance of $1.24 billion, which will be available for lawmakers when the lawmakers convene in 2022.
The General Fund ended with a surplus of $368 million, which has already been put to use, appropriated as part of the funding for new prison construction.
The surge in state tax dollars has come along with a surge in federal support for state government operations as well. In a typical year, federal funds provide almost the same amount the state raises in taxes. But with the pandemic, the U.S. government sent an estimated $17 billion in relief funding to Alabama to schools, hospitals, and other agencies. Some of that is flowing through the appropriation process, but much of it is flowing directly to the agencies, making it difficult to know whether it has been spent yet or not.
The danger comes when those federal relief funds dry up. Growth will taper. State agencies receiving federal relief cannot count on that level of funding to continue. Legislators will convene in 2022, in an election year, with a lot to spend. But they will also have to keep an eye toward an unpredictable future and not commit to unsustainable levels of recurring expenses.
Thus, it’s useful to look for clues in the FY 2021 collections.
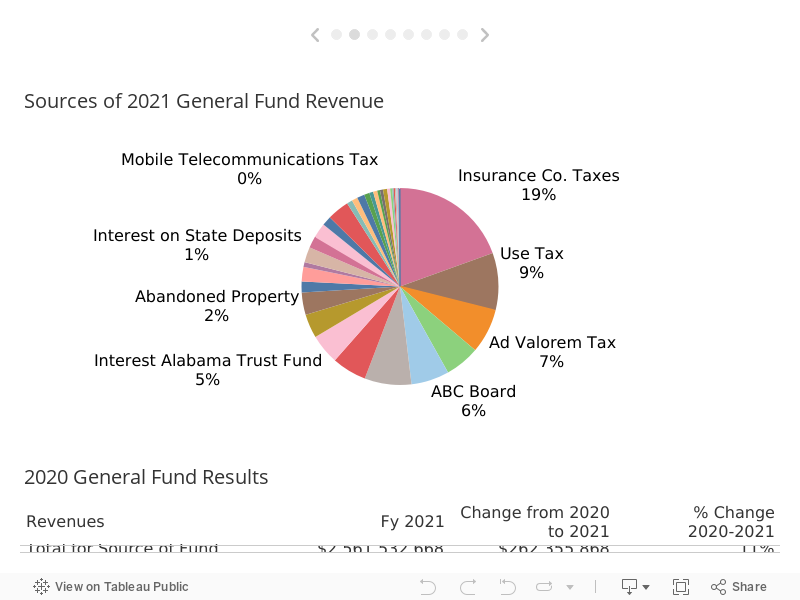
General Fund Revenue Sources
A myriad of tax sources supports the General Fund. Traditionally, most of those sources saw little growth from year to year. The General Fund struggled to keep up with rising expenses in non-education expenses, like funding for prisons and the Medicaid program.
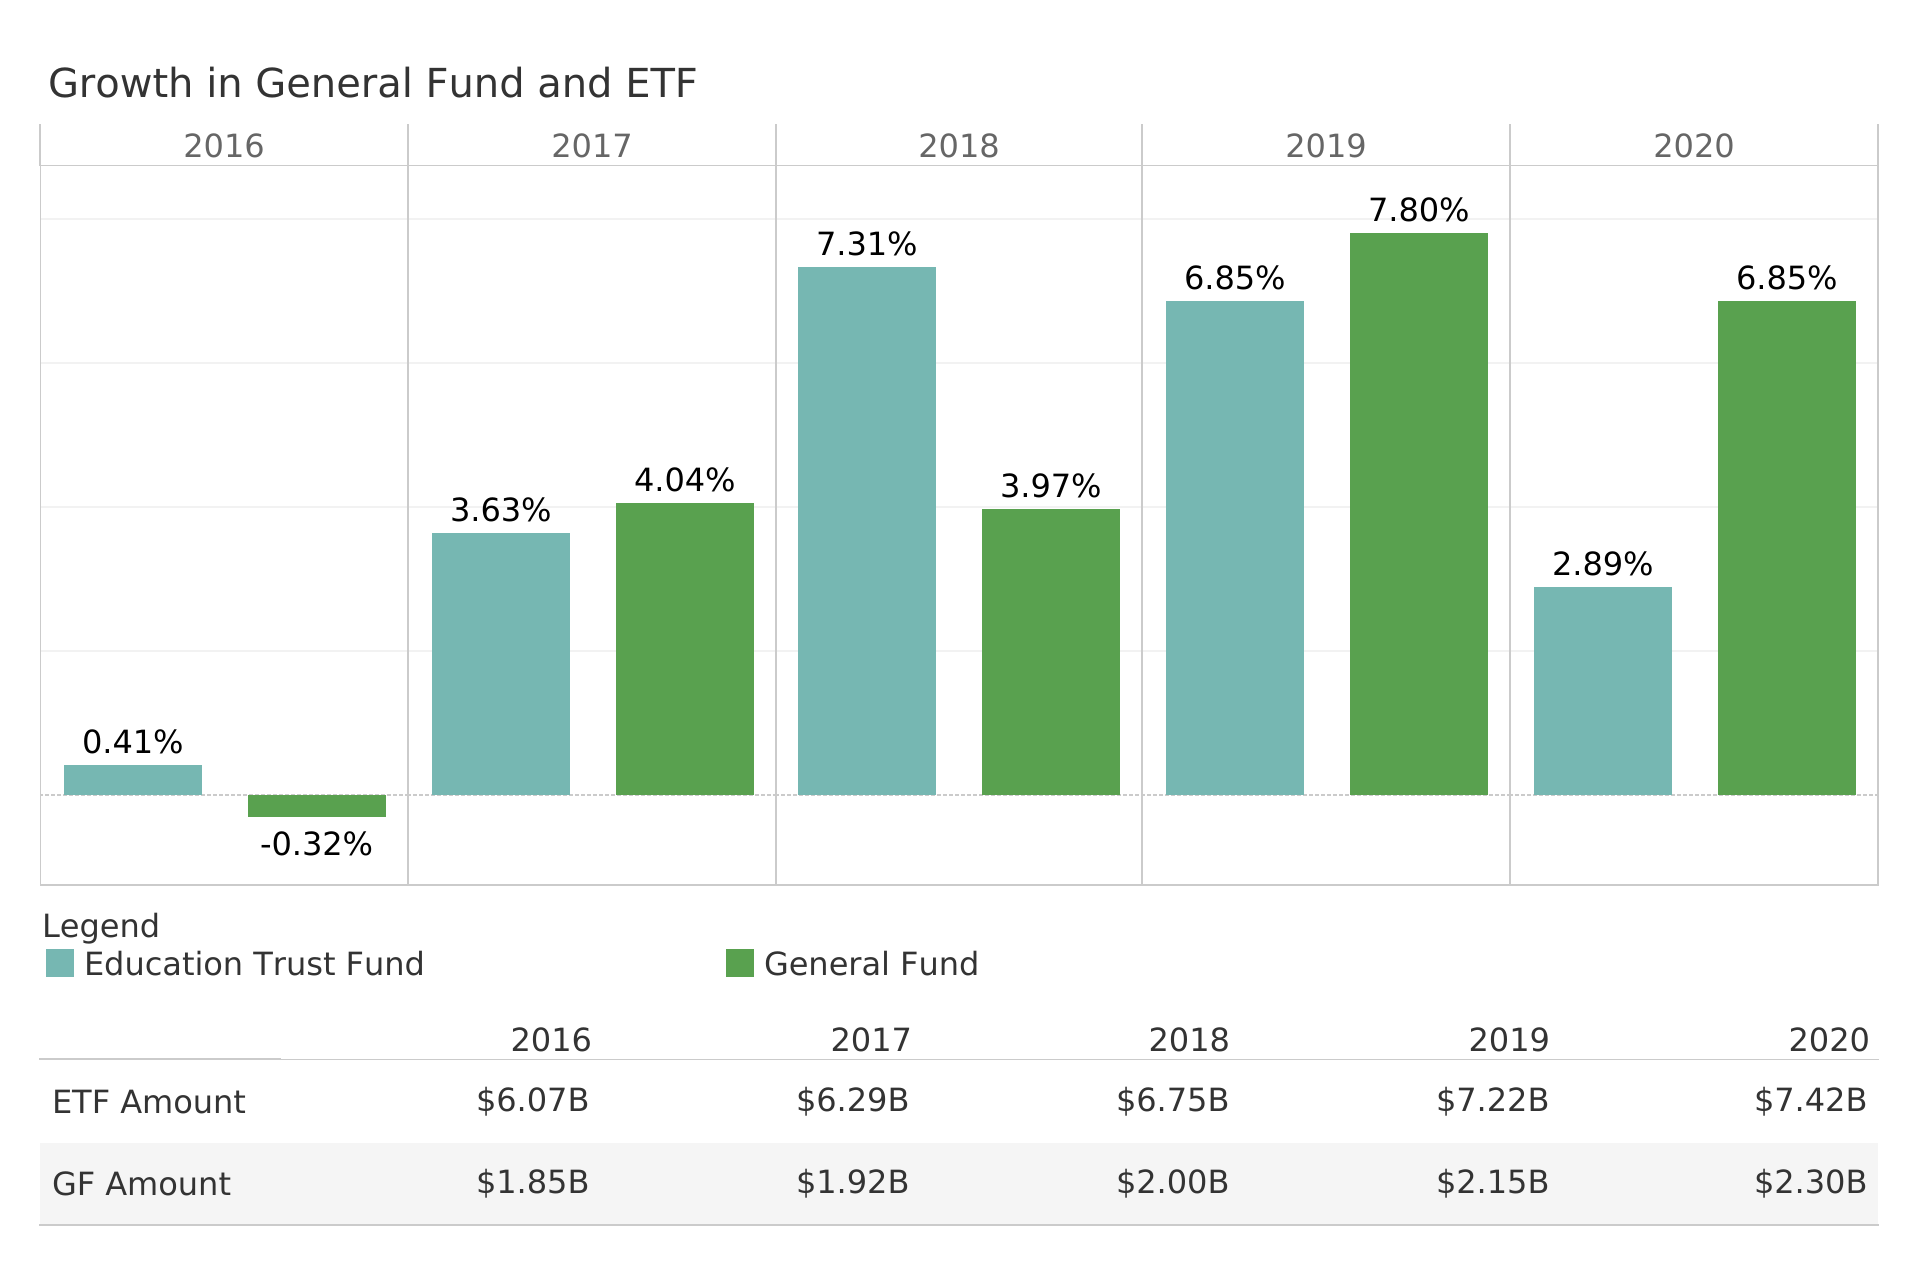
However, in recent years, some growth taxes have been added to the General Fund, and its rate of growth has been similar to the Education Trust Fund. Since 2017, General Fund receipts have increased 33%, while ETF receipts have increased 37%.
Big gainers
Insurance Co. Taxes: The largest tax in the General Fund, the tax on insurance premiums, contributed close to $500 million to the General Fund, increasing by $77 million or 19% over 2020 collections. As insurance rates go up, and as more people take out insurance, the tax brings in more. Also, $30 million of the tax had been going to the ETF. That ended with a law change in 2019, increasing the yield to the General Fund.
Simplified Sellers Use Tax: The SSUT continued a string of huge gains as the shift to online sales continued in FY 2021. An additional $55 million came in from this source, an increase of 39% over 2020 (In 2020, the increase was 99%). It has quickly grown into the third-largest source of revenue in the General Fund at $192 million. That represents 75% of the tax. The remaining 25% goes into the ETF. Some of the growth may be attributable to new retailers submitting the tax. Still, this year’s growth is likely attributable to both the increased spending power of consumers because of stimulus and rising wages and to the continuing shift to purchasing online for home delivery. Considering the decreased threat of Covid, the tax is expected to grow more slowly in the future.
Financial Institutions Excise Tax: Coming off a down year in 2020, this tax source jumped by $55 million, an increase of 156%. The big jump is attributable to a new law in 2019 that required banks to make payments quarterly rather than in a lump sum. It also changed how the tax amount due was calculated, bringing it more in line with the federal definition of taxable income. The big surge in collections was not expected, as the law changes were expected to be revenue-neutral. State budget officials think the shift in the schedule for payment of the tax may have resulted in a surge of revenue in FY 2021 will not continue.
Sales and Use Tax: a share of the sales tax on autos and boats is distributed to the General Fund, and each of those lines was up by more than $25 million, thanks to the strong demand and rising prices for both.
ABC Board: Liquor sales continued a rising trend posting a 12% gain over 2020, a year when ABC proceeds climbed by 14%. This may result from a continuing shift toward purchase for home consumption, as restaurant and bar operations continued to be somewhat curtailed in FY 2021. The revenue sent to the General Fund from the ABC sales increased to $157 million.
Mortgage and Deed Record Taxes: About $20 million additional came in through taxes related to home sales. Both prices and activity spike in 2021, reflected in a 34% increase in the mortgage tax, adding $15 million to reach a total of $58 million, and a 45% jump in the deed record tax, reaching $17 million. Continued low-interest rates led to more refinancing and home purchases.
Lodging Tax: This tax on hotels and vacation rentals was up 26% in 2021 after being down 15% in 2020, bringing in an additional $13 million compared to 2020. Gulf Coast rentals saw a record demand though some units were offline because of damage caused by Hurricane Sally in Sept. 2020. Convention and hotel traffic remained depressed compared to historic norms.
Interest on the Alabama Trust Fund: More accurately described as investment returns on the Alabama Trust Fund, the contribution from this source increased 8%, or $8 million, thanks to a strong market. Also known as the State’s savings account, the Alabama Trust Fund is at nearly full strength as amounts borrowed during previous downturns have largely been repaid.
Oil and Gas Production Tax: The oil and gas production tax was up 16%, recovering somewhat from a crash in FY 2020.
Court Costs: With the courts open again, court costs recovered some of the previous year’s drop, though FY 2021 collections were still behind 2019s. In FY 2021, proceeds from court costs contributed $60 million to the General Fund.
Big losers
Cigarette Tax: Though it remains a significant source of revenue, the cigarette tax continues to decline as smoking decreases. The taxes brought in $143 million to the General Fund in FY 2021, down by $5 million, a decline of 3%. Meanwhile, a Tax on Vapor products increased 28%, or $614,875, to $2.8 million.
Interest on State Deposits: The state earns interest on the cash it holds, but this source of revenue declined $31 million or 62% because of dropping interest rates. The state collected about $20 million from this source in 2021.
Mobile Telecom Tax: A dying tax, this tax applied to phone plans that sold talk time. For the most part, cellular plans now provide unlimited talk time at no charge but charge for data, which is not covered by this tax. Revenue continues to decline, bringing in just over $11 million, down another nearly $4 million or 26% lower than last year.
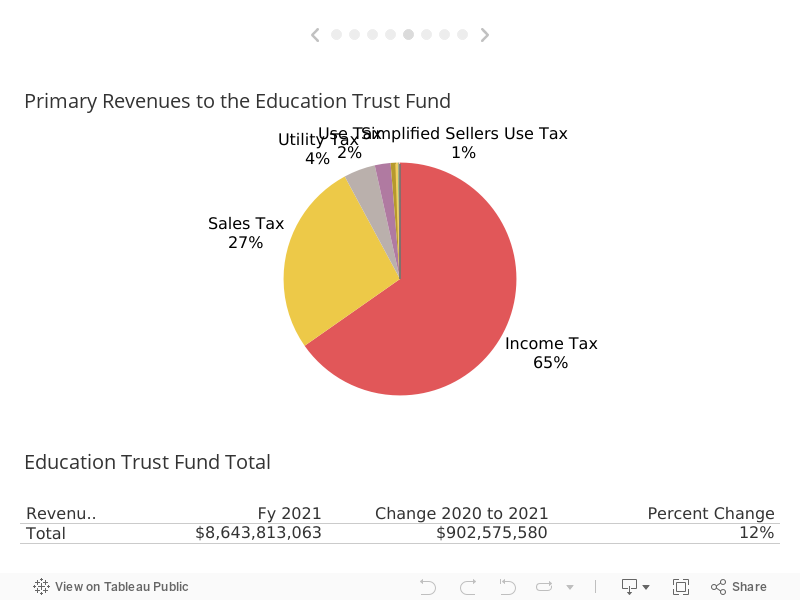
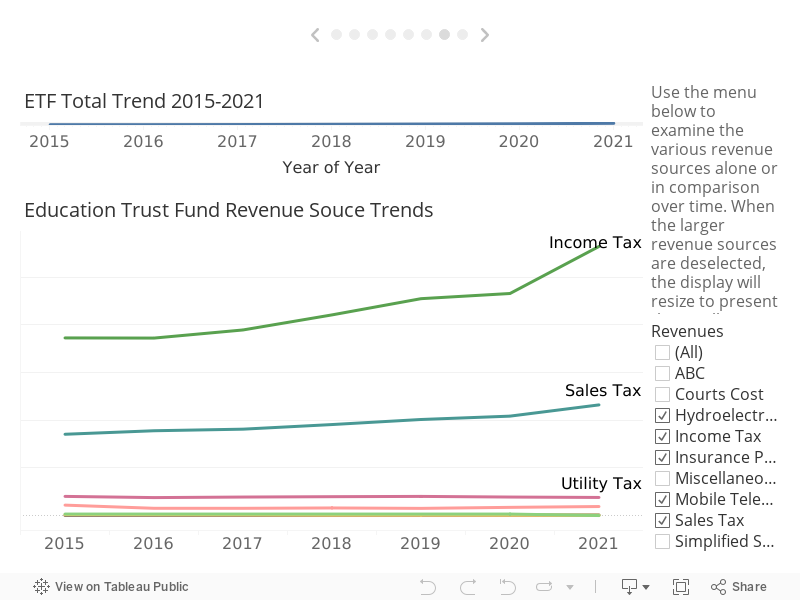
Education Trust Fund
The ETF supports K-12 schools, colleges, and universities. The state’s two largest revenue sources flow into it: the income tax and the sales tax.
Benefiting from growth taxes, the ETF has traditionally seen the most substantial ups and downs: rapid growth in good times and jarring contractions when the economy falters. However, more recently, the Legislature has spread some of the growth taxes and has imposed rules on how fast spending can grow. These restraints have thus far prevented mid-year budget cuts and have allowed the accumulation of reserve funds.
Big Gainers
Income Taxes: Net income tax deposited in the ETF was increased by a jaw-dropping 21%. The anemic growth of income taxes in FY 2020 is part of the story. FY 2021 full-year of full-time employment earnings produced a substantial gain in gross personal income tax collections, up $643 million to a total of $5.8 billion. But even more staggering was a 61% increase in corporate income taxes. Corporate income taxes increased $370 million to a total of $974 million. Explanations for such a large jump are not completely clear. Certainly, the recovering economy had businesses operating a full calendar year. Pent-up demand and the stimulus in the economy drove up sales bolstering income over a down 2020. Budget analysts also speculate that corporations may have realized more revenue in 2021 to avoid potentially higher federal taxes in 2022. After refunds and other adjustments, the income tax contributed $5.6 billion to the ETF, increasing $987 million over 2020.
Sales Taxes: The state received over $2.3 billion in sales tax revenue in 2020, and $325 million more than last year was sent to the General Fund, an 11% increase. Sales were robust at grocery and hardware stores as people continued to invest in home improvements. It’s also important to note that inflation has driven up the prices of some goods, which in turn drives up sales taxes, which are based on the total cost. With the dissipation of stimulus money, this pace of growth is unlikely to recur. But, with the pandemic under better control, activity continues to accelerate, Demand is strong. Unemployment is low, and wages are rising. That suggests income and sales taxes will continue to grow.
Simplified Sellers Use Tax: As in the General Fund, the contribution of this tax was up 40%, adding $18 million to the ETF, for a total contribution to the ETF of $64 million. The proceeds of the tax are divided, with the ETF receiving 25% and the General Fund 75%.
Big losers:
Insurance Premium Tax: Before FY 2021, $30 million from the Insurance Premium Tax was deposited into the Education Trust Fund. That ended because of a 2019 change in the law governing the distribution. The total amount is now in the General Fund.
The Utility Tax: Down 2% or $8 million, this is a tax on electric, water, telephone, and gas utilities. FY 2021 saw both a mild summer and winter and a wet one. That leads to decreased energy consumption and lower levels of water use. However, the extra rain provided more opportunities for hydropower generation, driving up receipts from the hydroelectric tax.
From the Year’s End Looking Forward
Both funds ended FY 2021 with substantial surpluses. FY 2022 budgets were built on the assumption of 3% growth over the 2021 budgets. Current conditions suggest the state should easily exceed those predictions.
Alabama is in an unfamiliar position of having to manage its way through unexpected excess revenue.
General Fund
- FY 21 Budgeted $2,393,272,863
- FY 21 Receipts $2,562,158,281
- FY 22 Budgeted $2,637,874,471
Education Trust Fund
- FY 21 Budgeted $7,217,422,487
- FY 21 Receipts $8,643,813,063
- FY 22 Budgeted $7,672,576,575
And that’s only part of the picture
The ETF and General Fund totals don’t even represent half the revenue that powers public agencies, state schools, universities, and hospitals. Nor does it represent the federal benefits that flow through state agencies like Medicaid, the Departments of Human Resources, Health, Mental Health, Labor, and Rehabilitation Services. The chart below gets closer to a picture of the scale of public spending in Alabama.
Reserve Fund Balances
Current conditions suggest continued recovery, But if things were to falter, Alabama has built up major reserves that are available to tap in case of an economic downturn. A recent analysis on state reserves and rainy day funds by the Pew Charitable Trusts estimated that Alabama $1.1 billion in rainy day funds or 11.2% of spending. The state could run on its rainy day funds for 41 days, Pew estimated. That puts Alabama well ahead of the 50-state median for the strength of its reserves.
- ETF Budget Stabilization: $448,410,575
- ETF Rainy Day: $484,979,764
- ETF Advancement & Technology: $282,314,668
- GF Budget Reserve: $75,303,255
- GF Rainy Day: $263,994,883