The college-going rate for Alabama public high school graduates declined in 2017, and for the first time in three years, the number of high school graduates who went on college declined as well, according to new data provided by the Alabama Commission on Higher Education (ACHE).
The data, drawn by ACHE from the National Student Clearinghouse, follows Alabama public high school students who graduated in the spring of 2017 and enrolled in higher education in 2017 or the spring of 2018. The data includes records for in-state and out-of-state institutions, both public and private.
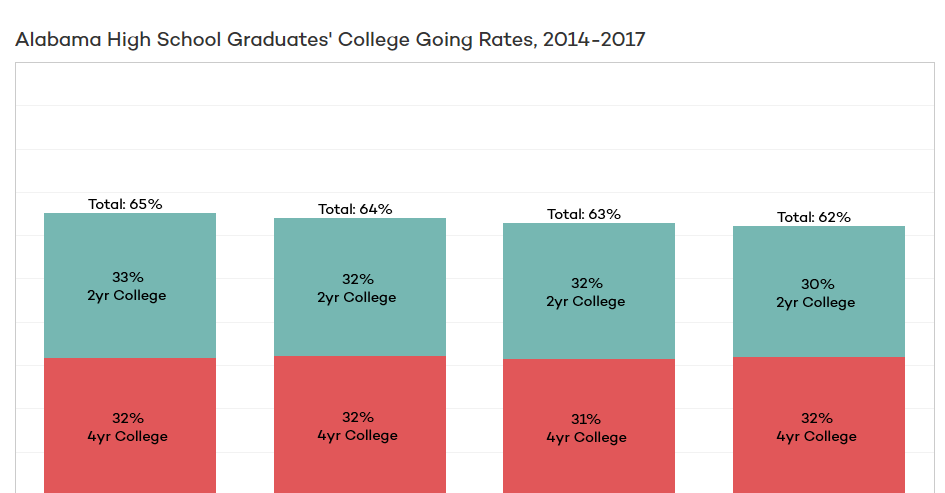
In 2014, the first year this set of statistics was produced, 65 percent of high school graduates enrolled in college the year after their graduation. In 2017, 62 percent of graduates enrolled. While the college-going rate has edged down, the number of high school graduates has been going up, as high school graduation rates have climbed. So though the rate was lower, more students entered higher education.
But in 2017, for the first time since 2014, there was a dip in the number of students enrolling. One factor was that the graduating Class of 2017 was smaller than the Class of 2016. Also, the number of students going to community colleges experienced most of the decline, something that tends to occur when unemployment is low, and graduates are drawn directly into the workforce. The number and percentage of high school graduates not enrolling in higher education the year after graduation also increased for the Class of 2017 when compared to previous years: 38 percent of high school graduates did not enroll the year after their graduation.
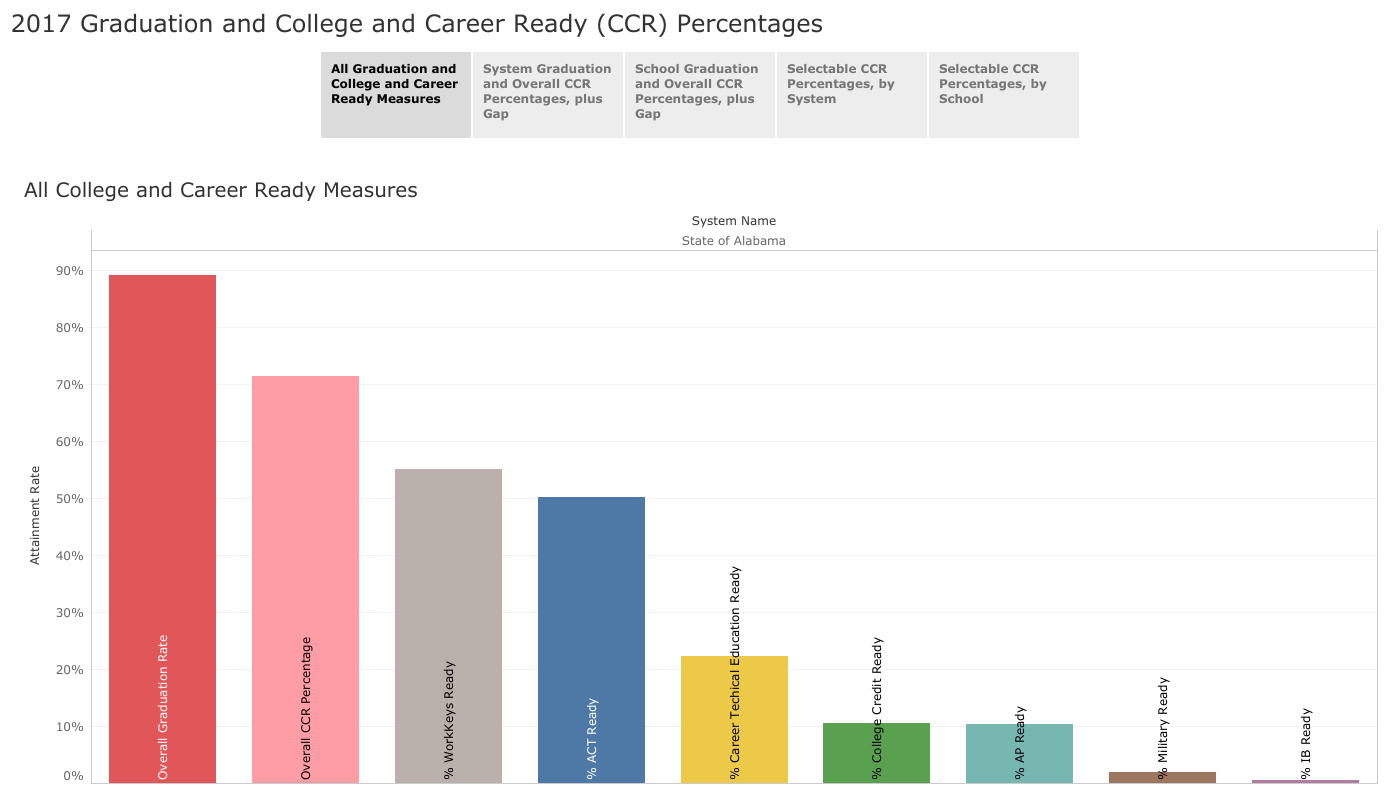
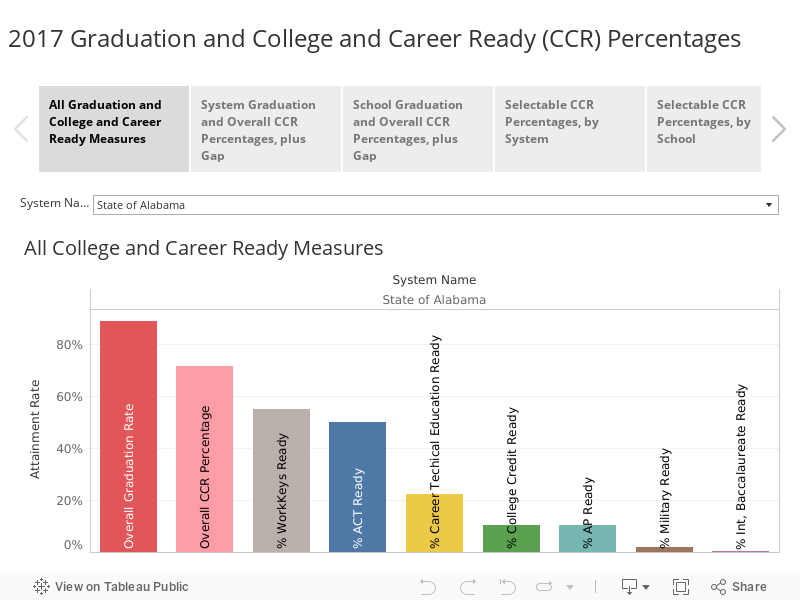
The intersection of high school graduation and college-going is an area of keen interest as Alabama has set a goal of improving the education and skill levels of its workforce. It benefits the state to have more of its students graduating high school, rather than dropping-out. But those graduates need to have either earned a meaningful occupational credential while in high school or have graduated high school prepared for advanced training or higher education.
Alabama’s public high school graduating class of 2017 totaled 49,764, about 200 students less than the Class of 2016. Among those graduates 15,738, or about 30 percent, enrolled in a two-year community college, according to the data. That’s about 600 students fewer than the previous year.
The number and percentage of students enrolling at a four-year college increased to 15,804, up 128, accounting for 32 percent of graduates. The total number going to public 4-year colleges in Alabama dipped by 122, but that dip was offset by an increase in the number of students going to in-state private colleges or going to four-year colleges out of state. Still, the overwhelming majority, 91 percent of those who enrolled, went to Alabama institutions and 92 percent of those who enrolled went to a public college or university.
The remaining 18,826 high school graduates, 38 percent of graduates, were not found to have enrolled in higher education. Data for individual schools and for school systems is available by exploring the tabs about the data display.
Why is this important?
Alabama trails most other states in educational attainment levels. Higher levels of education generally translate into more job stability, higher pay, and better health. As the economy continues to shift toward jobs requiring a higher level of education and training, the need for a better-educated population grows.
Alabama has set a goal of adding 500,000 new highly skilled workers to its workforce by 2025 in order to meet and exceed the anticipated demands of the evolving economy. To reach that goal, virtually all high school seniors need to graduate ready for college or career, ready to go into advanced training related to employment or into college, prepared for college-level course work.
Alabama’s public high school graduation rate has increased substantially since ACHE began providing this data on college-going rates. During the period since 2014, the number of high school graduates has increased, as has the number of graduates enrolling in higher education. However, the number of students not enrolling has also increased. In round numbers, high school graduates have increased by 4,000 a year, the number of students going to college has increased by 1,000, and the number of students who don’t enroll in the year following graduation has increased by 3,000. This produces a dip in the college-going rate, or percent of graduates attending college.
Other observations from deeper in the data
The new data from ACHE and Student Clearinghouse allows comparisons between Alabama school systems and schools. But when making comparisons, it is important to keep in mind socioeconomic factors that affect college-going. College is expensive. Systems with higher levels of affluence will send a greater share of the students to college. At the same time, some less affluent schools and systems achieve a high college-going rate by sending more students to two-year colleges, a more affordable alternative. Research shows a number of factors can play into a student’s decision to attend a two-year college. Examples include (from Community College Review):
- Open admission policies at many schools that allow students who did not perform as well in high school the opportunity to pursue a higher education
- A lower tuition rate that can reduce the cost of earning a four-year degree
- A flexible schedule that provides both day and night courses for students who have families and must work full time
- Technical training that provides a more direct route to particular careers
- Proximity to to home
Two-year colleges were originally created in part to provide assistance (a second chance) for students who did not become college ready and could not get into the four-year college of their choice. Four-year colleges know this and prepare to help them transition into their college when they arrive, or they should. This will include a number of students from lower economic backgrounds, but others too.
For instance, the number one school system for college-going is Mountain Brook, with 92 percent of graduates enrolling in college immediately after graduating from high school. Almost all of those students enroll in four-year college or university. Students in Mountain Brook are more likely to come from a college-going family with expectations or goals for attending a four-year college than in other systems. Some systems and schools are likely to be more richly resourced and focused around this objective. By contrast, the system which posted the second highest college-going rate this year, the Oneonta City System, sent 50 percent of its graduates to four-year colleges and 36 percent of its graduates to two-year college, for an overall college-going rate of 87 percent. While two-year colleges have historically been a choice because of needed academic catch-up or cost, with new ideas around a changing workforce they may increasingly become the first choice for students in a variety of systems.
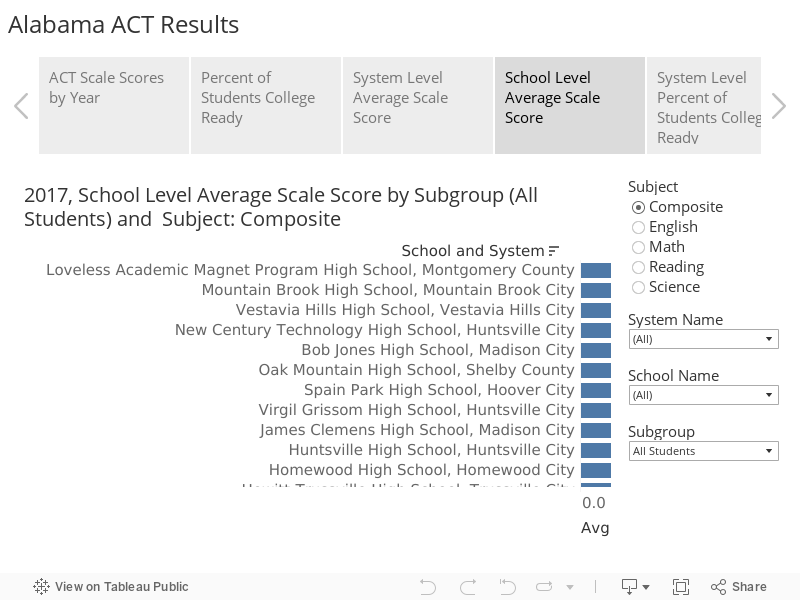
The college-going data also highlights the high-performance levels of magnet high schools. For instance, as a system, Montgomery County Schools have an overall college-going rate of 56 percent among its graduates. However, three of its magnet high schools, Booker T Washington, Loveless Academic Magnet Program, and Brewbaker Technology Magnet High School, have college-going rates above 90 percent, which ranks all three in the top 10 among Alabama high schools for college-going.
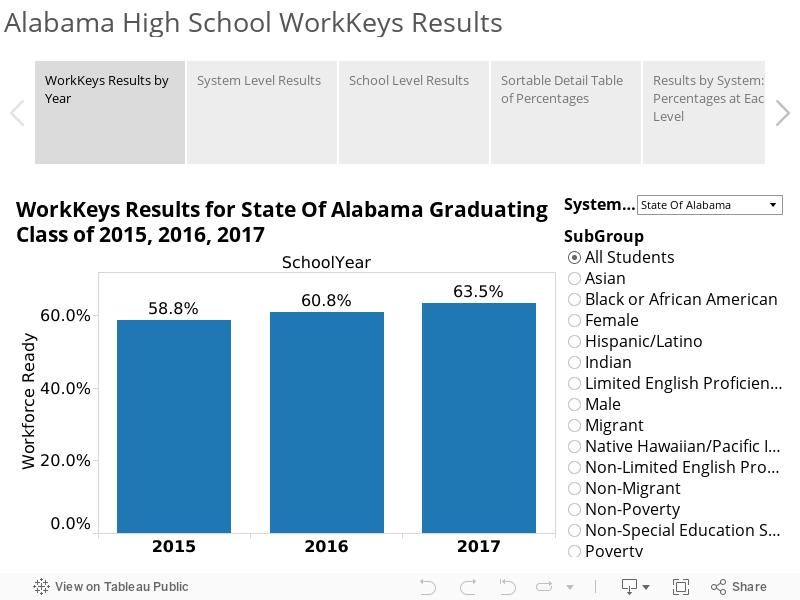
The data is also presented for schools and systems in statistical form or as represented on a map. Look for selectors on each of the data visualizations that allow you to change the statistic, the schools or systems in the comparison, or the year of the data.
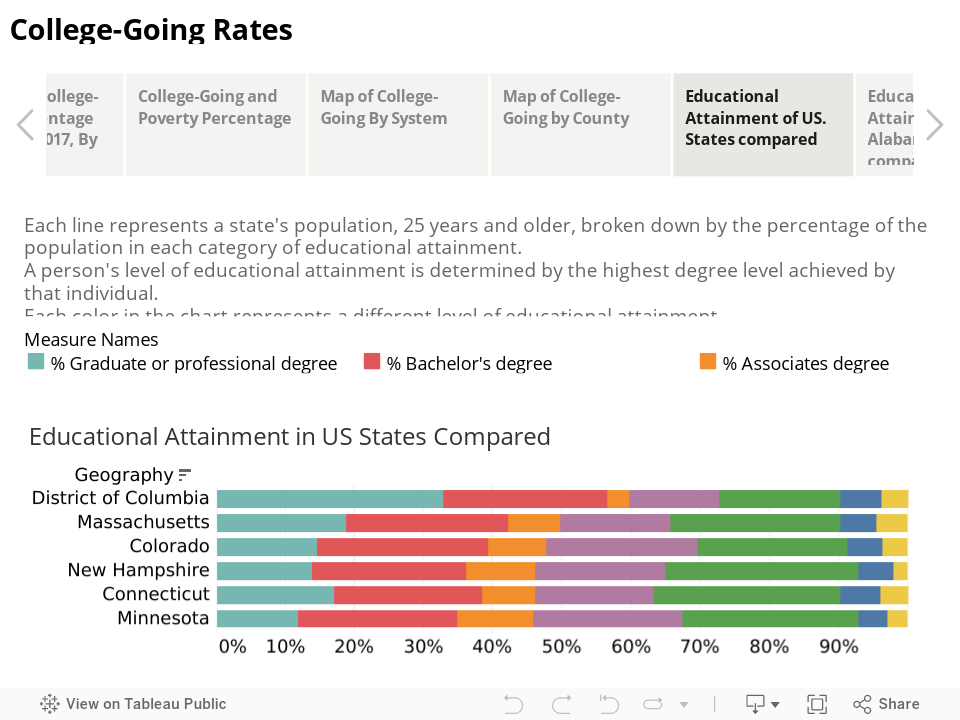
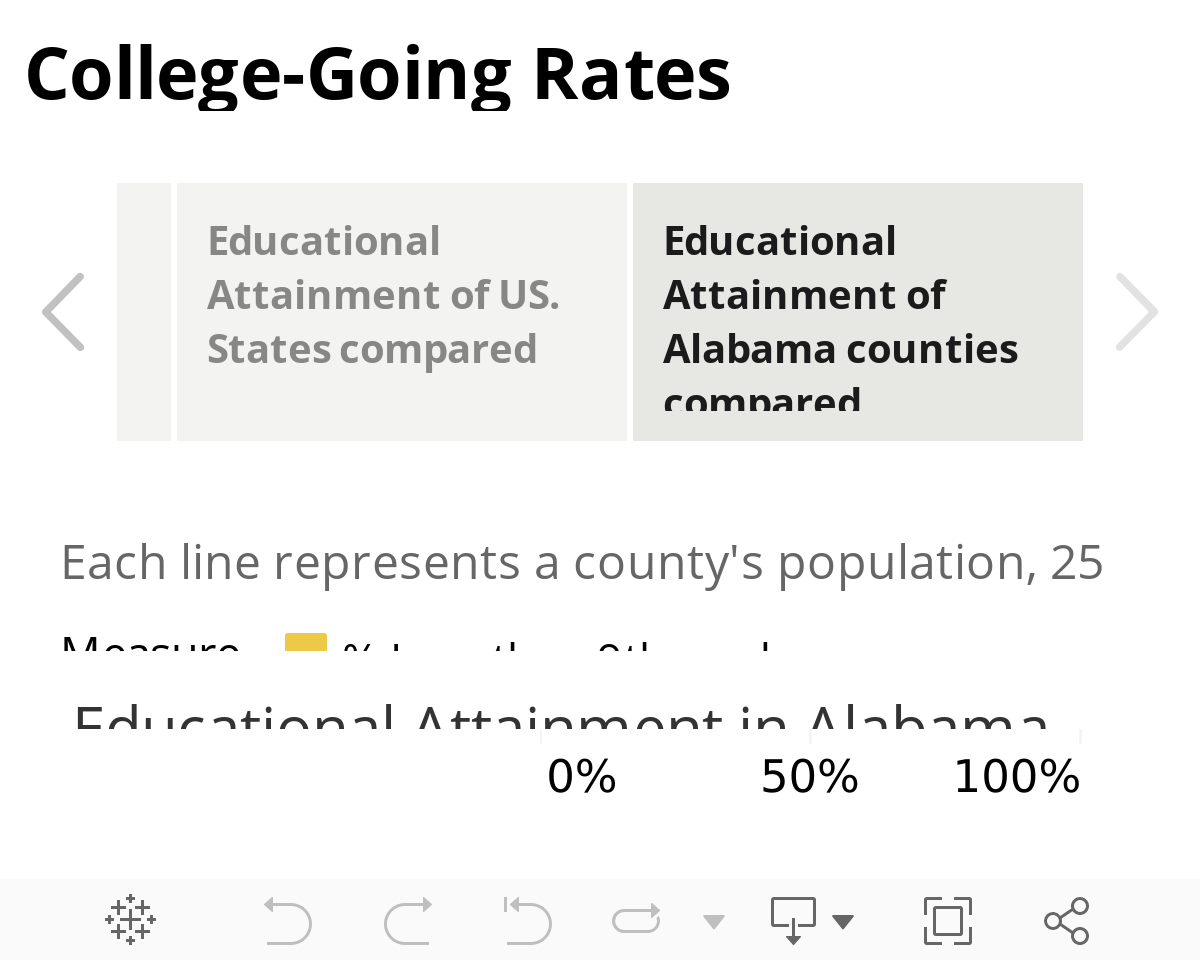
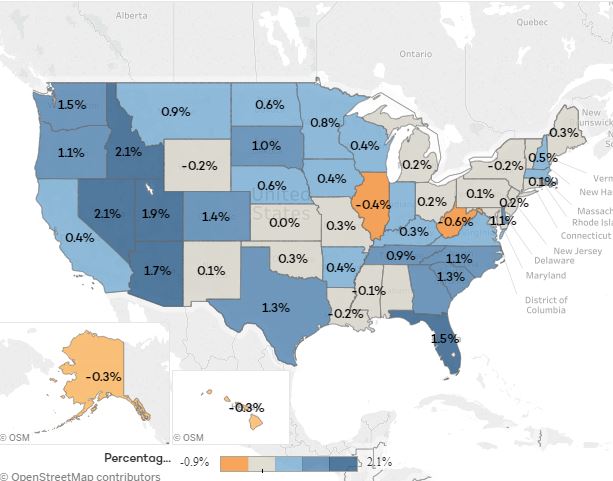
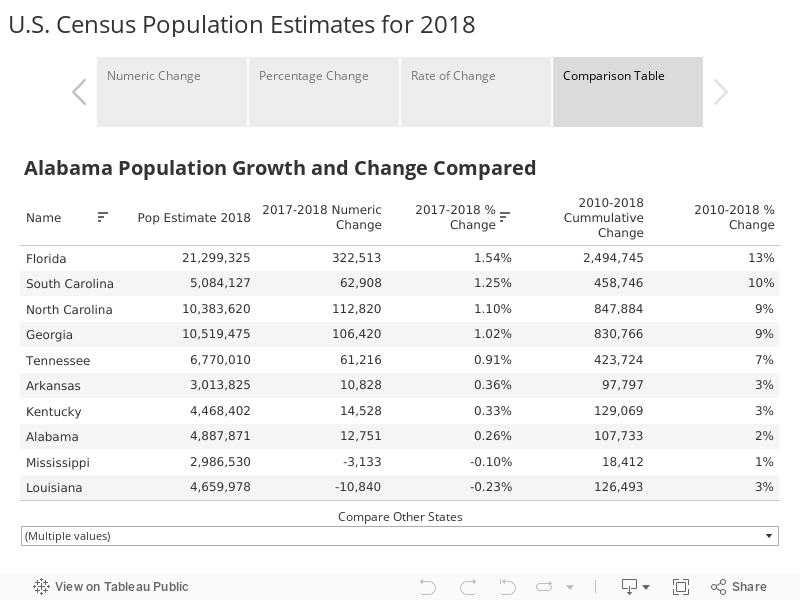
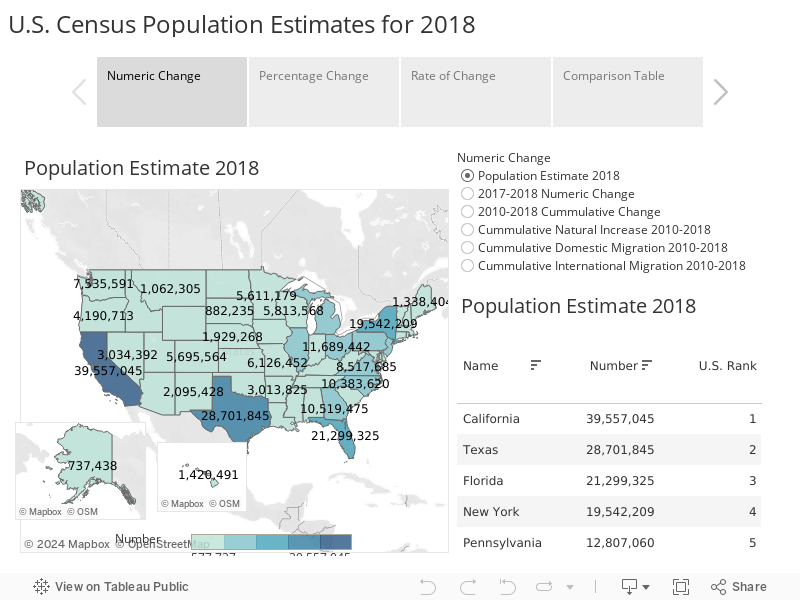
College-going rates are a building block for educational attainment, though entry into college is only one step on the journey to a degree. The rate at which student persist in and graduate from college is also important. Alabama lags behind other states in terms of educational attainment, according to statistics generated by the U.S. Census Bureau.
Educational attainment levels also vary widely by county. Half the adult population of Shelby County has an associates degree or higher, the highest level of educational attainment in the state.
On the opposite end of the rankings is Conecuh County, where only 14 percent of the adult population has an associates degree or higher, according to Census estimates.