In this graduation season, we take a look back at some encouraging educational statistics for last year’s graduating class, the Class of 2017.
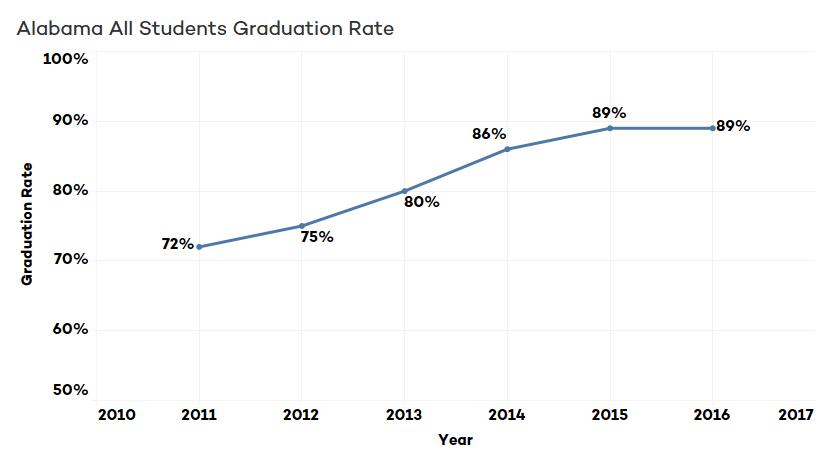
For the Class of 2017, the final tally for the state high school graduation rate and college and career readiness rate both improved over the Class of 2016’s rates.
However, there is still a troubling gap between the percentage of high school seniors graduating and the percentage of those seniors graduating college and career ready, as measured by the state.
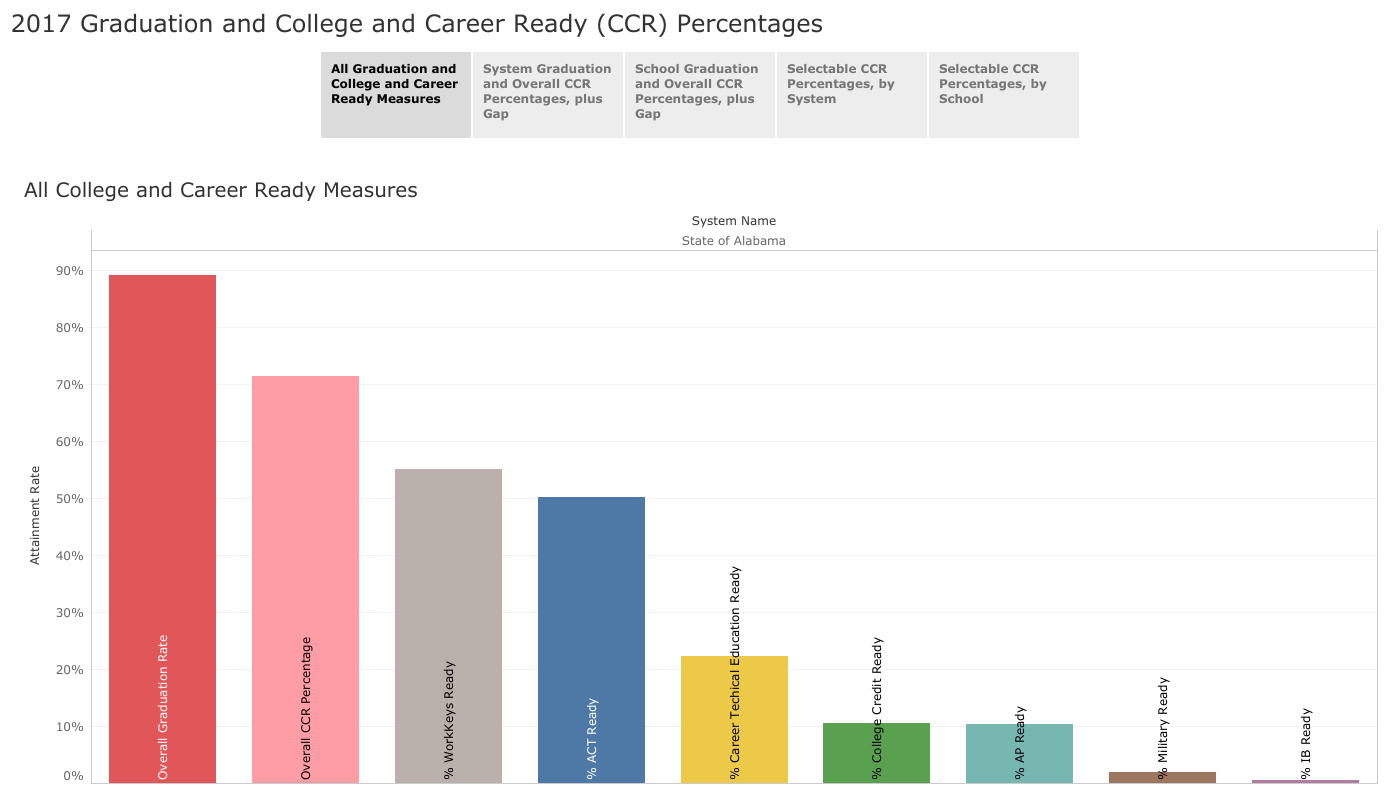
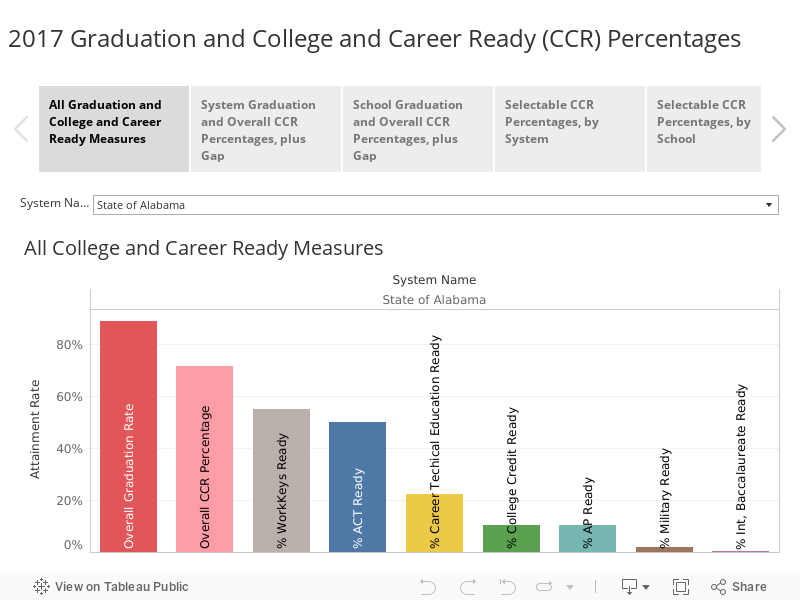
For the seniors in the Class of 2017, 89 percent graduated with a diploma, but only 71 percent of seniors earned the college and career ready designation.
The statewide results for the ACT and WorkKeys assessments also both showed improvement for the Class of 2017.
The ACT is the widely used assessment test designed to measure college readiness. The test is given to all 11th graders in Alabama’s public schools. WorkKeys is a separate test, also developed by the ACT organization, designed to measure workforce readiness. The test, given to all 12-grade students annually, measures students’ skills on the math and reading skills as they might be applied in the workplace.
The state uses both as measures of the college and career readiness of graduates. High school seniors are considered college and career ready if they meet one of the following criteria.
- Score college ready in at least one subject on the ACT
- Score at the silver level on ACT’s WorkKeys Assessment
- Earn a passing score on an Advanced Placement or International Baccalaureate Exam (college-level courses delivered in high schools)
- Successfully earn a career technical credential
- Earn dual enrollment credit at a college or university
- Successfully enlist in the military
Graduation and College and Career Readiness Percentages
The interactive chart below allows users to explore the graduation and college and career readiness percentages for high school seniors in 2017 at the state level and by school system, and high school. When comparing results on individual measures, bear in mind that some schools and systems vary on which route to college and career readiness they emphasize. Some may invest heavily in providing AP classes or preparation for the ACT while others concentrate on dual enrollment or career technical education.
As Alabama’s graduation rate has soared, so has the concern that some students who are receiving high school diplomas haven’t been adequately prepared for the next step after high school.
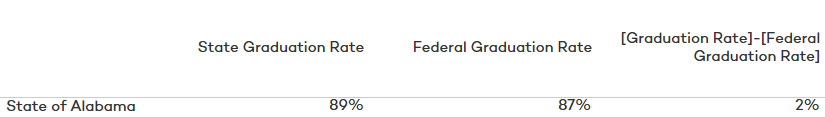
In March, then-State Superintendent Ed Richardson pointed out the disparity between Alabama’s high school graduation rate (87 percent in 2016) with the Class of 2016’s College and Career Readiness rate (66 percent). Richardson called the 21-percentage point gap between the graduation rate and the career readiness rate “unacceptable.”
“Some schools have a gap approaching 60 percentage points,” Richardson noted. “In fact, a few high schools only have one in four graduates who accomplish one of the six College- and Career-Ready Standards.”
The final tallies for the Class of 2017 showed that the gap between high school graduation and college and career readiness narrowed to 18 percentage points.
Richardson declared the gap between graduation and college and career readiness one of the “most serious issues facing our schools.”
“Failure to address this issue immediately,” Richardson said, “will only result in more high school graduates and their families being led to believe they are ready for the next step in their lives when they are not—harm public education and depress our state’s economic growth.”
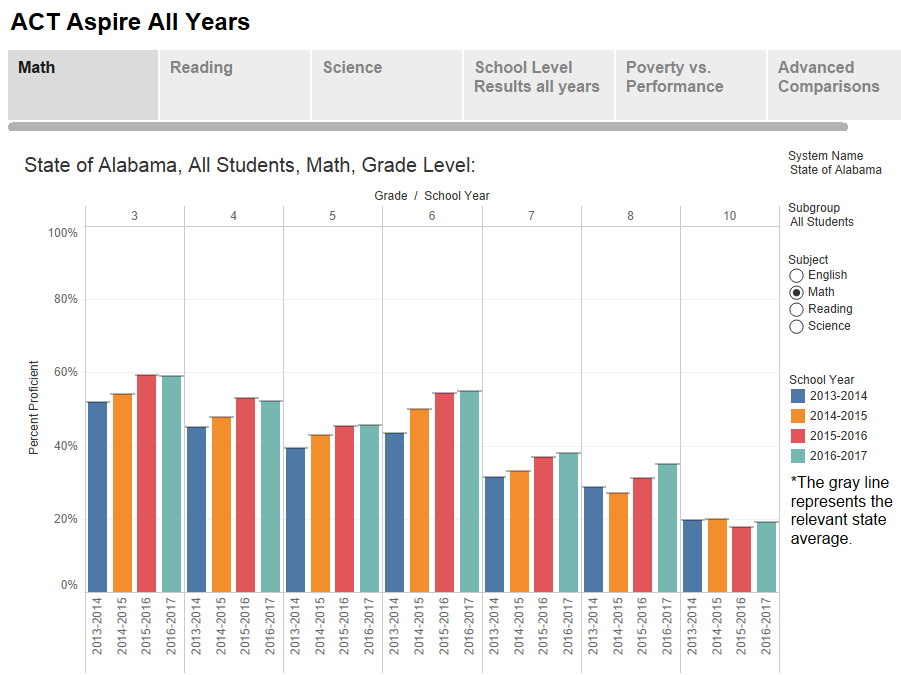
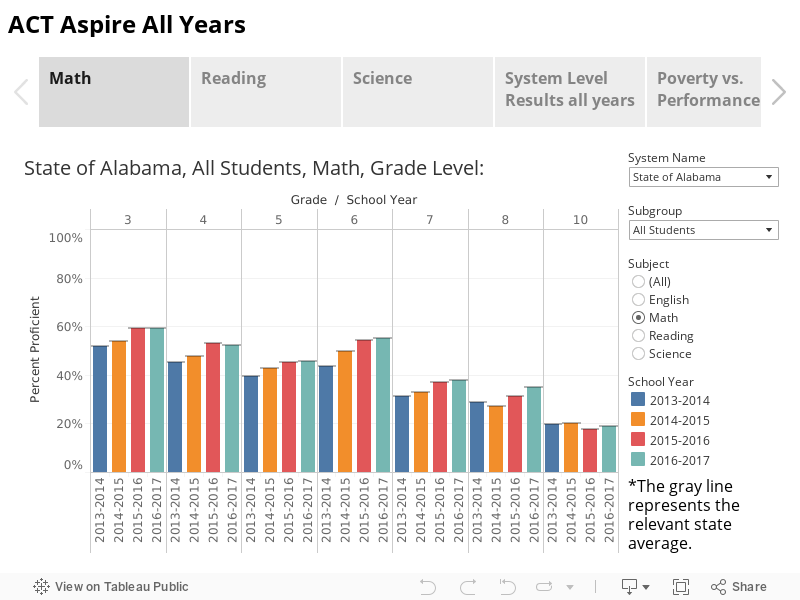
ACT
For those students who plan to continue at a four-year college, the ACT is designed to measure their readiness for college.
In 2017, 18 percent of high school seniors met or exceeded the benchmark score in all four subjects tested, English, Reading (Social Studies), Math, and Science. That’s up from 17 percent in 2015, according to the most recent data provided by the Alabama State Department of Education.
Success rates vary by subject: 53 percent of high school seniors scored college-ready in English, 37 percent in reading; 28 percent in science; 24 percent in math. The percentage of students scoring above the college-ready benchmark for each subject has increased in all subjects, except for English. In English, 53.1 percent of students met the college-ready benchmark in 2015 compared to 52.6 percent in 2017.
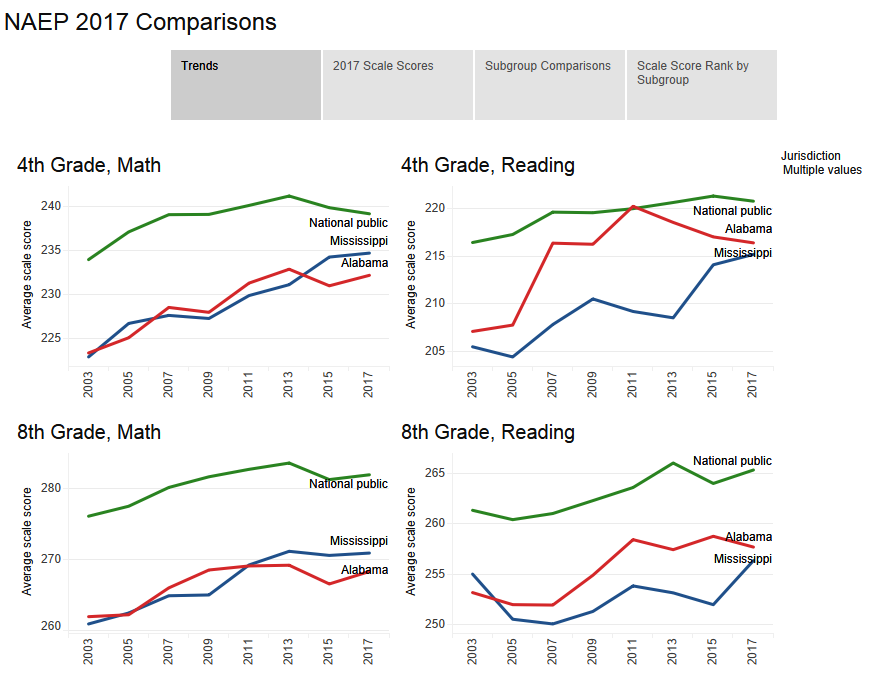
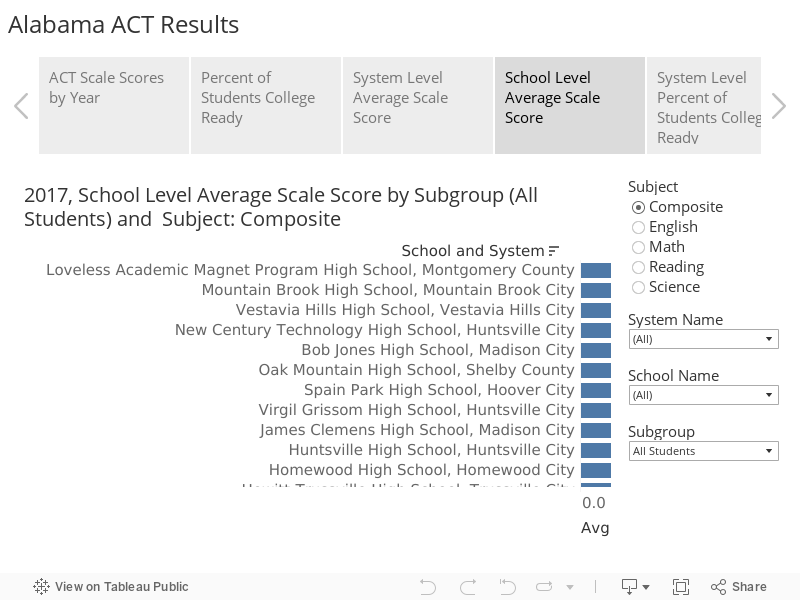
ACT scores are most commonly reported as scale scores, a number on a 36-point scale (a 36 in a perfect score)
The average scale score on the ACT for Alabama was 19.2 in 2017, up from 19 in 2015. While Alabama trails the national average scale score of 21, it is important to keep in mind that Alabama is one of 18 states in which 100 percent of public school students take the test. The state pays for one administration of the test for students in their junior year. In most other states, only those applying for college take the test. Students can take the test multiple times. Their best score is the one counted in the statistics.
Among the 18 states where 100 percent of students take the test, Alabama’s composite score ranks behind 13 states and is tied with North Carolina. Alabama’s average composite score ranks ahead of South Carolina, Mississippi, and Nevada.
Over the past three years, the average composite score has increased for every subgroup of students, except for nonpoverty students. The average composite for nonpoverty students was 20.8 in 2015 and 20.7 in 2017.
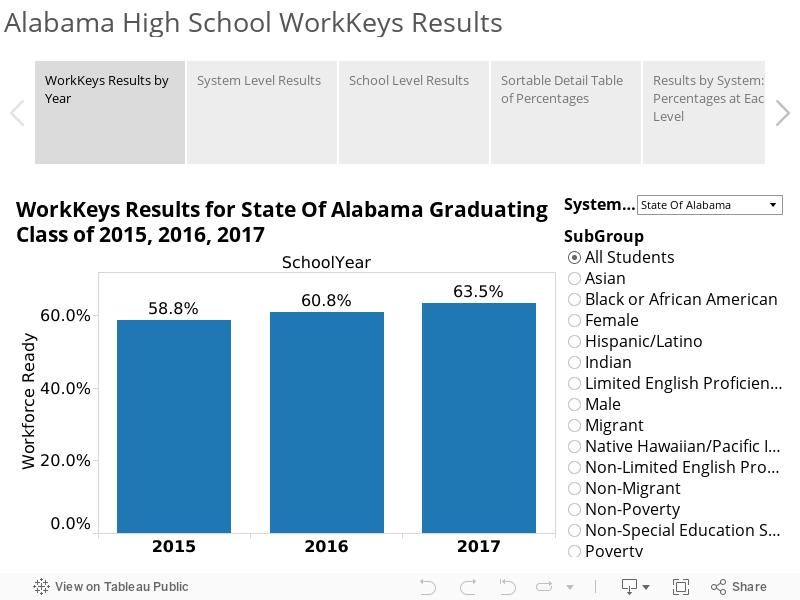
WorkKeys
On the WorkKeys assessment, 64 percent of graduates in 2017 earned a Silver certification or higher, the level needed to be considered college or career ready by the state. That’s up from 61 percent in 2016.
ACT has identified the foundational skills needed to be successful in thousands of different occupations. ACT predicts that students who score at the Silver level have the skills needed for 67 percent of the occupations in their database. Those scoring at the Gold level have the foundational skills needed for 93 percent of jobs profiled. A platinum level certification indicates that a candidate has the skills needed in 99 percent of jobs ACT has profiled.