Help Wanted: Alabama’s Labor Force Participation Problem
Alabama has record low unemployment, one of the lowest unemployment rates in the country.
And yet, the percentage of Alabamians actually
working is lower than almost any other state.
This seeming paradox explains, in part, why Alabama has lower per capita income than most other states and higher rates of poverty, despite those historically low unemployment numbers. To be counted as unemployed, you have to be looking for work, or in other words, participating in the labor force.
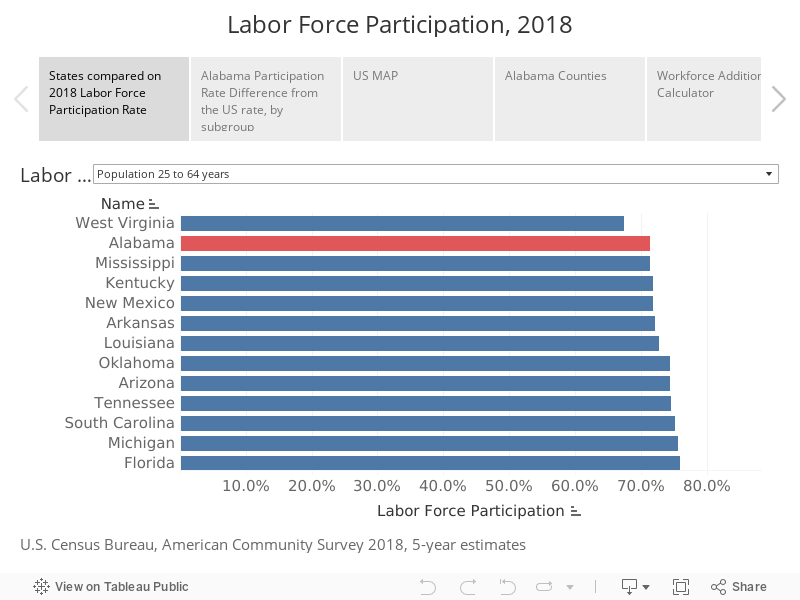
In 2018, Alabama’s labor force participation rate was lower than all other states, except West Virginia (we’re tied with Mississippi). As measured by the American Community Survey, 71% of Alabamians, ages 25-64, were working or looking for work. That compares to the U.S. labor force participation rate of 78% for that age group.
If Alabama’s labor force participation rate equaled that national average, Alabama would have almost 160,000 additional workers in the workforce in that age range.
Low labor force participation is a significant problem for Alabama, one that has been recognized by Gov. Kay Ivey’s Administration and the Alabama Workforce Council in its Success Plus Initiative (for more information on this initiative see Education Matters, a report from the Business Education Alliance authored by PARCA. You can also read the Alabama Workforce Council’s latest update on the effort).
Increasing the state’s labor force participation rate is one of the key objectives identified by Success Plus for helping Alabama meet its goal of adding 500,000 highly skilled workers to its workforce by 2025. The state will not reach that goal without bringing significant numbers of those who have dropped out of the workforce back in, which in most cases means equipping them with supplemental education and skills needed to thrive in today’s work environment.
Who is missing?
Before we can bring people back into the workforce, we have to understand who’s missing in the first place, and which groups of Alabamians have dropped out at a higher rate than residents of other states.
Using data from the U.S. Census Bureau’s American Community Survey (ACS) for 2018, PARCA examined the labor force participation in Alabama in comparison to other states and to the nation as a whole. We used five-year estimates because that survey provides estimates for smaller counties not present in the one-year estimates.
A comparison of one-year estimates yields similar results. However, it should be noted that in the 2018 one-year estimates, labor force participation in Alabama did show an increase over 2017, from 70.5% to 71.4%, after a multi-year downward drift. Whether that is a result or the economy or policy focus, it would be hard to determine, but, hopefully, it is part of a trend. For comparison, before the Great Recession, Alabama’s labor force participation rate was 75% for that age group and the national rate was 80%.
Sharpest differences with the rest of the U.S.: Age, Income, and Disability
Alabama trails the rest of the U.S. labor force participation rate across the board. When you break the population down into subgroups by age, sex, race, economic condition, or educational attainment, in almost every subgroup, Alabama’s rate trails the U.S. rate. However, in some subgroups, the divergence from the national rate is particularly sharp.
In comparison to the same population groups in other states, older Alabamians and Alabamians with lower levels of education are less likely to participate in the labor force, according to Census figures. Alabamians with a disability are also less likely to participate in the workforce than their counterparts in other states. The labor force participation rate for those groups is roughly 10% lower in Alabama than it is for similar individuals across the U.S.
The gap with the U.S is most extreme when it comes to individuals with less than a high school education. In Alabama, only 49% of individuals who lack a high school diploma are working or looking for work. That compares to a labor force participation rate of 61% nationally for those with less than a high school education.
Older workers in Alabama are also disproportionately out of the workforce. The labor force participation rate of those 60 to 64 is 10 percentage points lower in Alabama than it is in the rest of the country: 46% of Alabamians ages 60-64 participate in the labor force compared to 56% nationally. For those between 55-59, Alabama’s labor force participation rate is 63% compared to 72% nationally.
Age remains a factor in those between the ages of 45 and 54; Alabama’s rate is almost 7 percentage points lower than the U.S. average. For those 44 and younger, the gap between the Alabama workforce participation rate is narrower, though Alabama’s rate is still 3 to 4 percentage points lower than the U.S. rate.
You find a similar pattern with educational credentials: the more education an Alabamian has, the more likely he or she is to participate in the workforce. As the education level rises, the gap with the U.S. rate closes: 84% of Alabamians with a bachelor’s degree or higher participate in the workforce compared to 86% nationally.
When it comes to individuals who report having a disability, Alabama also has lower rates of labor force participation than other states, with the labor force participation rate among disabled individuals in Alabama trailing the national average by 9%.
You can explore state and national rates of workforce participation in the map below. Use the selector at the top to choose the population group to measure.
The impact of Alabama’s labor force participation deficit in these subgroups is amplified because Alabama’s population is older, less educated, and more disabled than the country as a whole. Alabama’s median age is 38.7 compared to 37.8 in the US; 25% of Alabamians have a 4-year degree compared to 32% across the country; 11.6% of Alabama’s population reported a disability compared to 8.6% nationwide.
What does not impact our labor force participation rate
Alabama’s racial diversity does not affect the state’s labor force participation rate, though if Alabama was more diverse, our labor force participation rate might be higher.
Non-Hispanic whites (ages 16 and up) have the lowest labor force participation rate of the major racial and ethnic groups, just under 57%, lagging non-Hispanic whites nationally by 5.4 percentage points. Blacks in Alabama have a labor force participation rate of just over 57%, lagging the U.S. rate by 5.2 percentage points. Alabama Hispanics have a labor force participation rate of 67%, which is less than a percentage point difference from the U.S. labor force participation rate for Hispanics.
It is sometimes assumed that Alabama’s supposed preference for traditional gender roles might depress the labor force participation rate for females in Alabama compared to the rest of the U.S. However, if those attitudes produce any effect, it is slight. The female labor participation rate in Alabama is 66.4%, trailing the national average by 6.2 percentage points. That’s only slightly higher than the gap for males. The male labor force participation rate in Alabama, 76.6%, trails the U.S. rate by 5.6 percentage points. In fact, one subset of the female population in Alabama participates in the workforce at a higher rate than the U.S. rate. Alabama females with children under 6 are more likely to be in the workforce than similarly situated women nationwide. According to the Census figures, 71.4% of those mothers participate in the labor force.
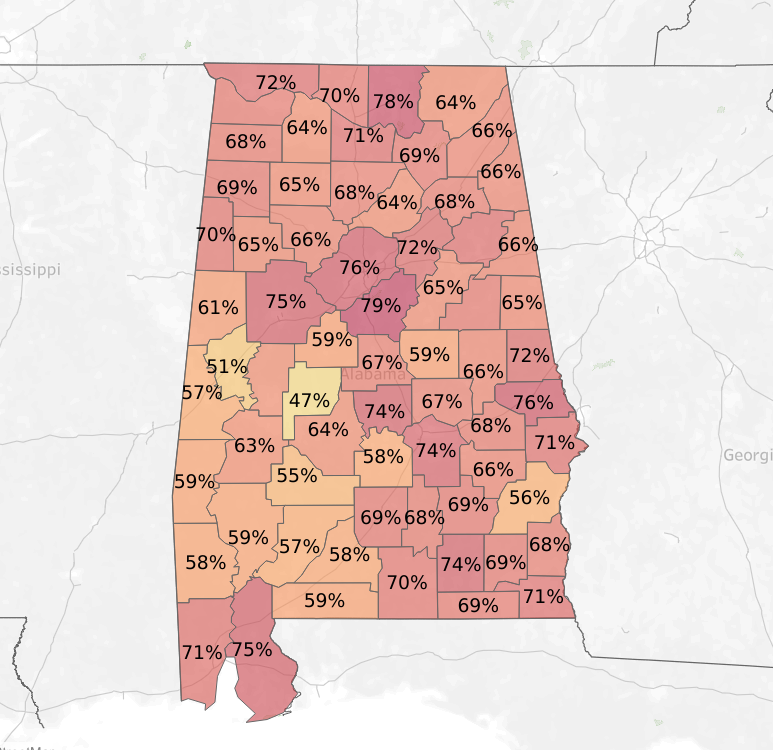
Geography matters
Alabama’s rural counties have the lowest labor force participation rates. Meanwhile, the most urbanized and affluent of Alabama counties have the highest rates of labor force participation.
One might conclude that it would be best to recruit workers back into the workforce by targeting rural counties where labor force participation is lowest. However, this neglects the fact that the largest population of workers who aren’t participating in the workforce are in metropolitan counties. That’s also where unemployment is lowest and jobs are clustered. Both rural and metropolitan counties need strategies for increasing labor force participation.
The visualization below allows you to calculate how many additional workers could be added to the workforce in the selected geography if that geography matched the U.S. labor force participation rate for the selected subgroup. The two subgroups selectors on the dashboard, one for the subgroup population and one for the subgroup labor force participation rate must be set to the same subgroup to produce accurate calculations.
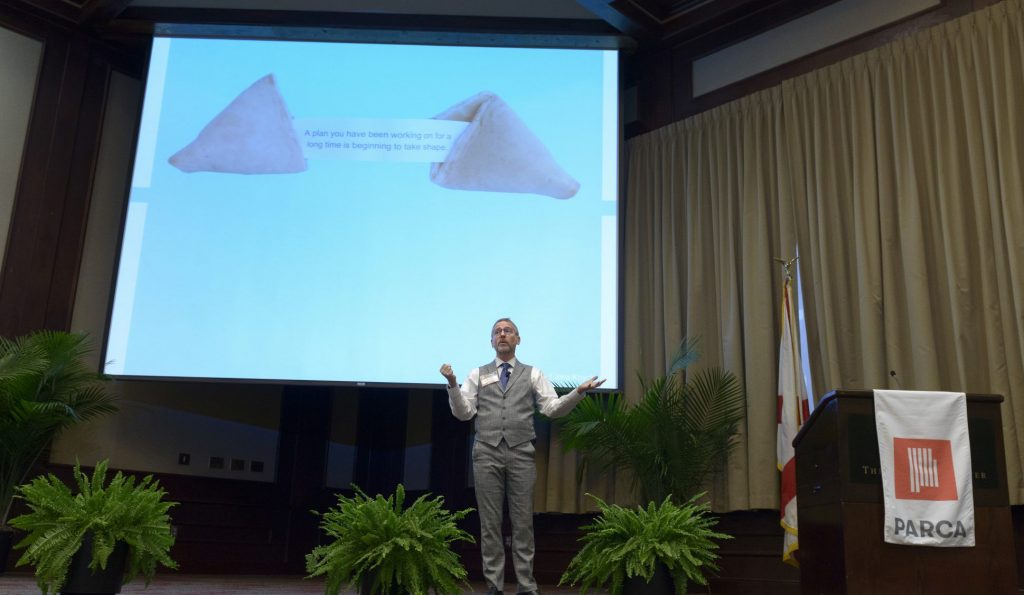
Alabama’s Third Century
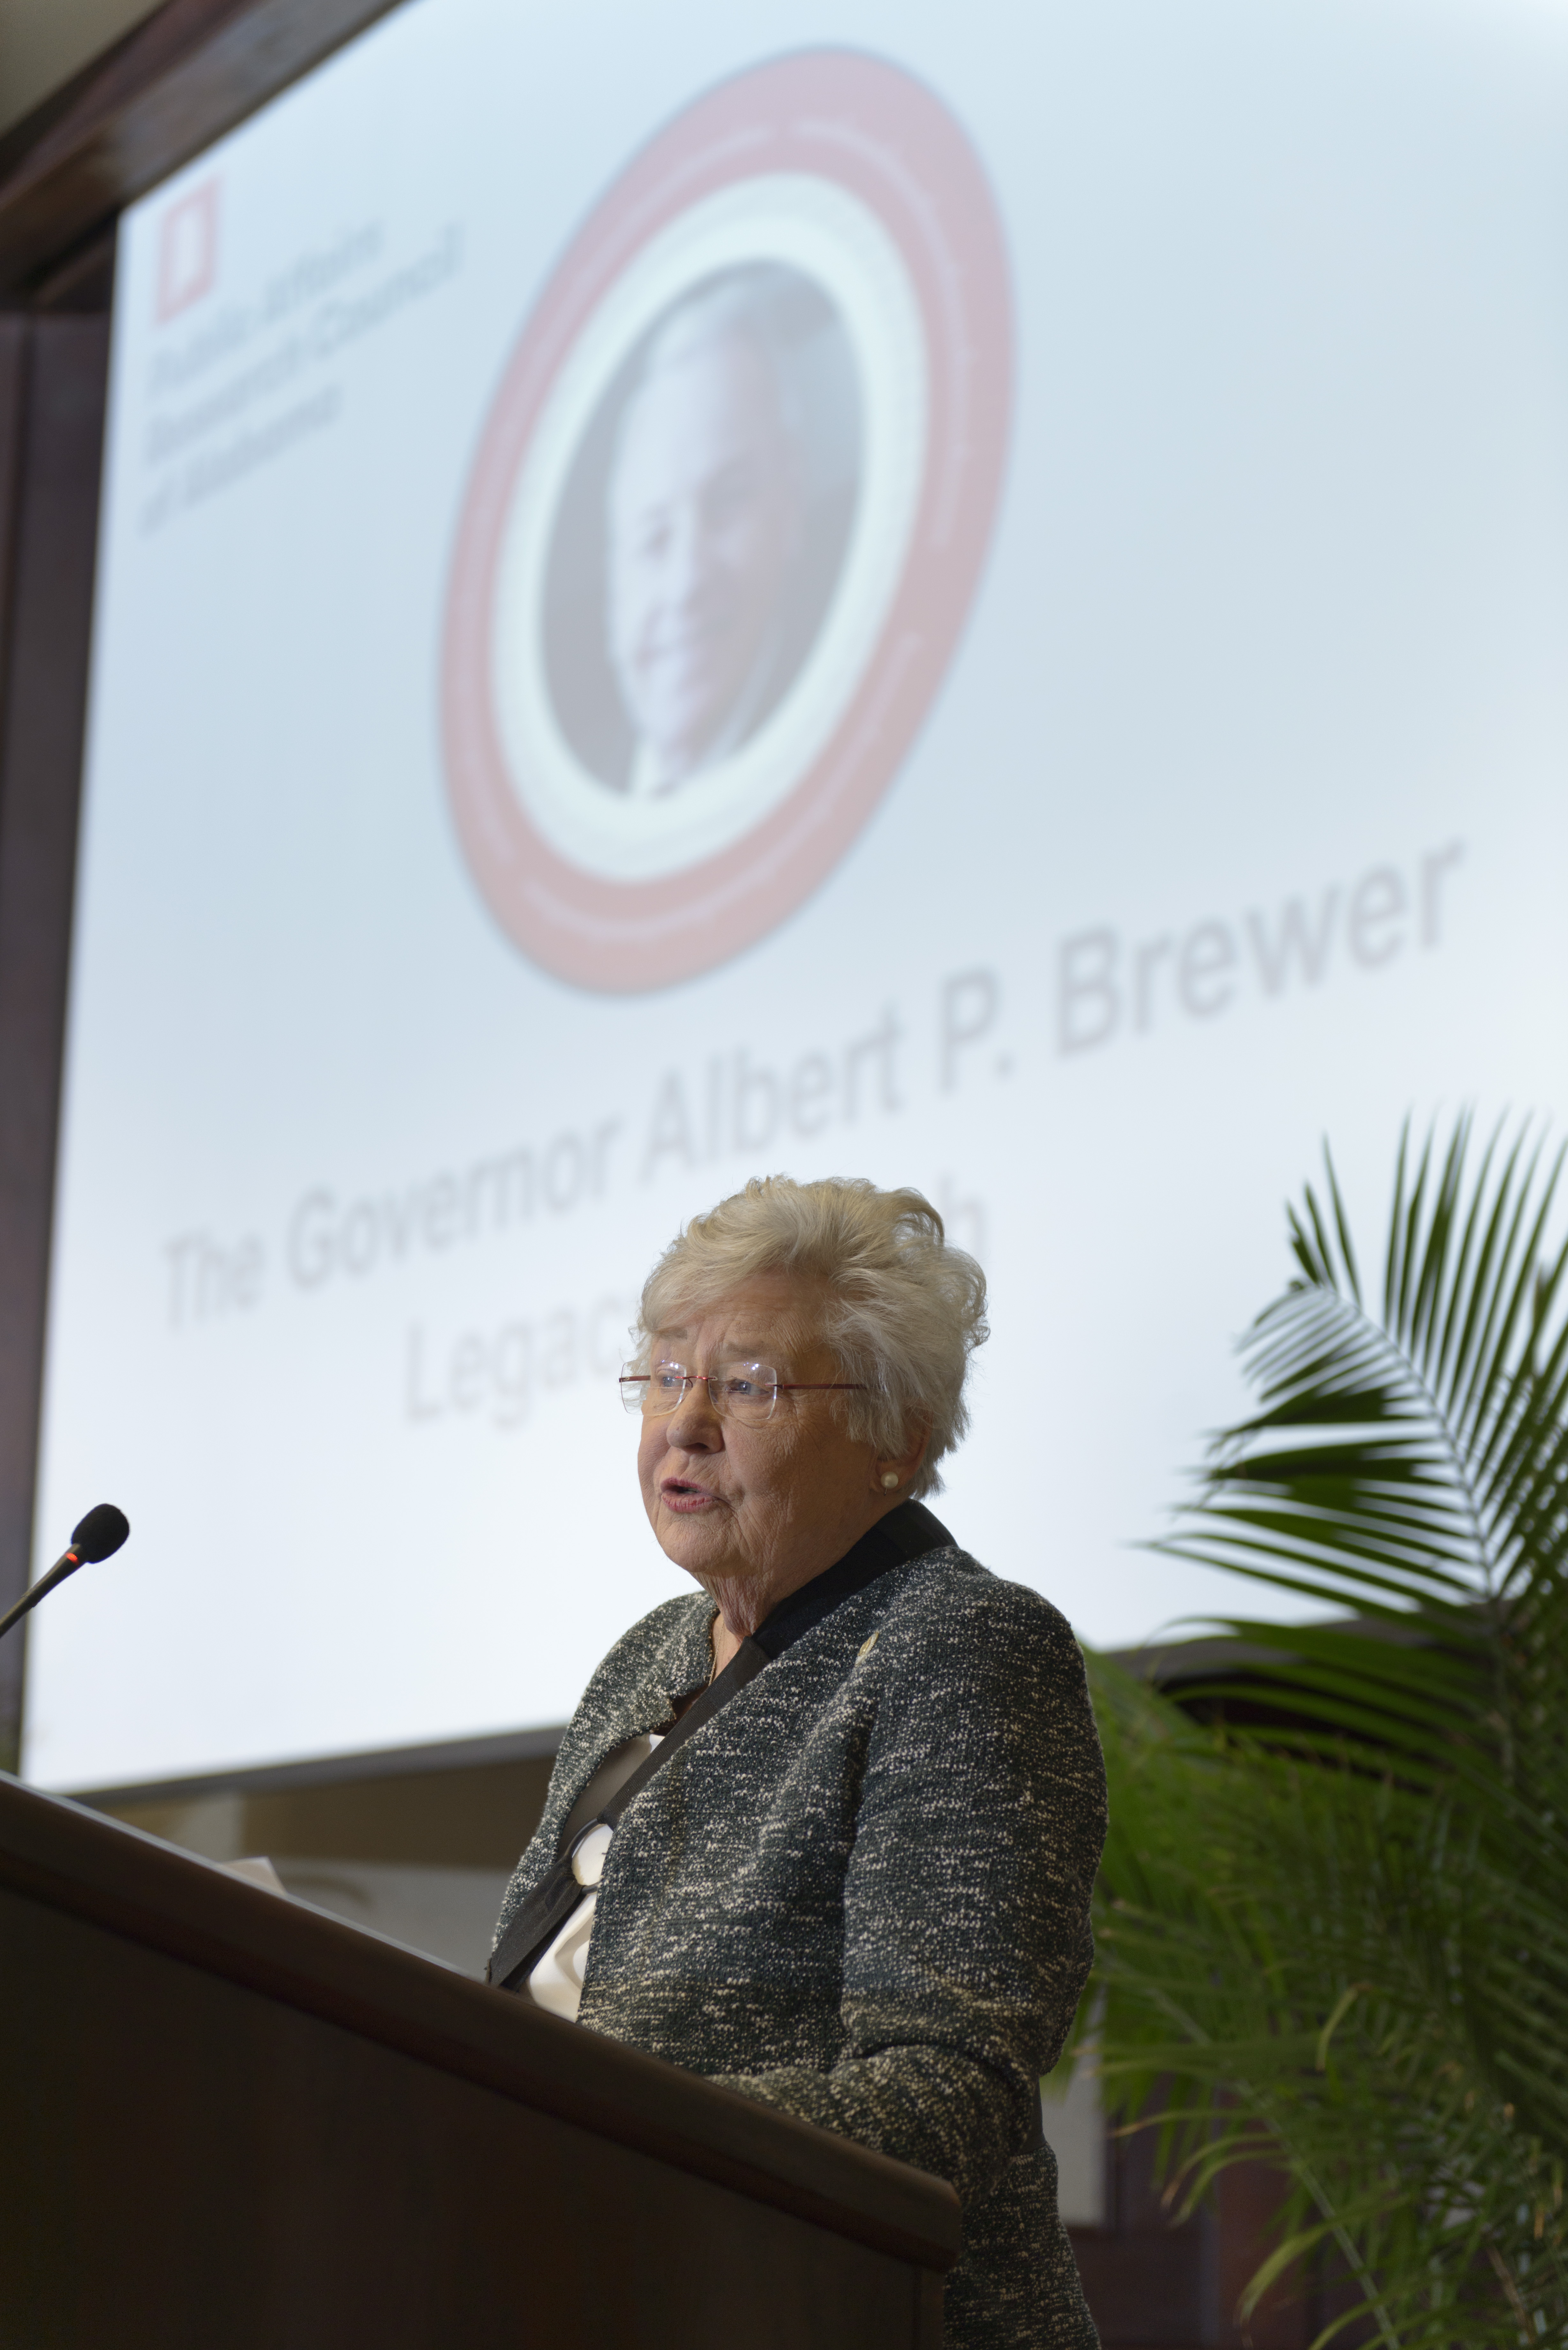
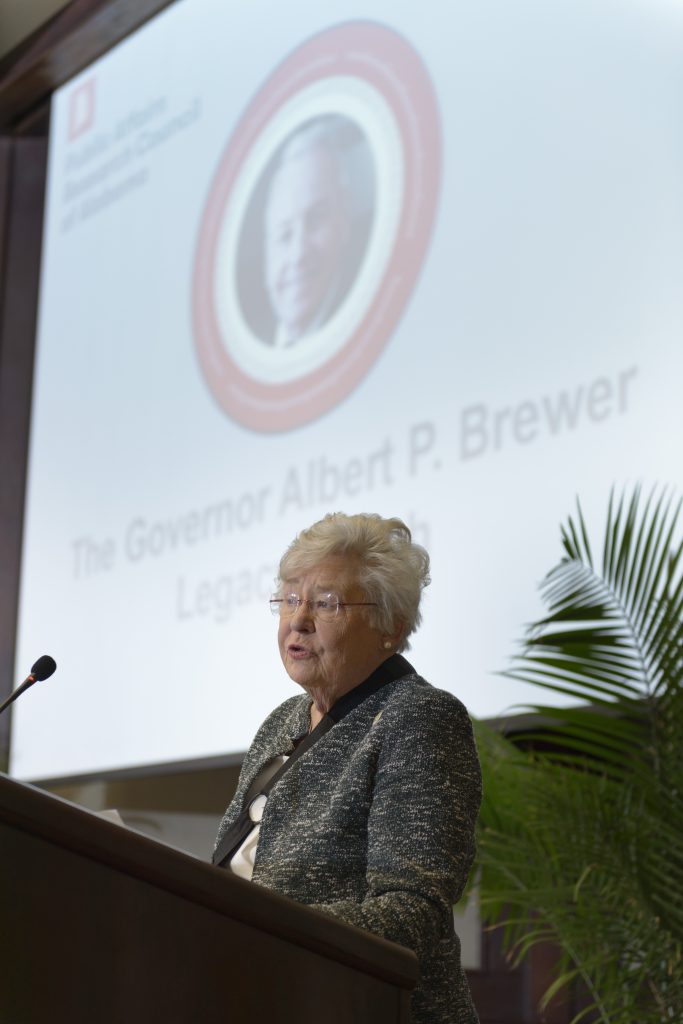
Governor Kay Ivey delivers the keynote at Governor Albert P. Brewer Legacy Lunch at PARCA’s 2020 Annual Meeting.
Alabama spent 2019 looking back at its first 200 years of statehood. In 2020, it seems appropriate to look forward to the next 100.
PARCA’s annual meeting, held Friday at Birmingham’s Harbert Center, was inspired by that theme: Taking lessons from the past in order to chart the way to a better future.
Along with a detailed look at the demographics shaping our state, it also included a series of experts discussing what the future holds for education, corrections, health and opportunity in Alabama.
The meeting featured Governor Kay Ivey describing her administration’s strategic efforts to raise educational achievement and to improve access to and the effectiveness of workforce training to meet the increased demands of the 21st-century economy.
The face of America and Alabama is changing
UNC-Chapel Hill Business professor Jim Johnson points out demographic trends that will reshape the country in the coming century.
James H. Johnson Jr., professor of business and director of the Urban Investment Strategies Center at the University of North Carolina at Chapel Hill, spoke of the demographic changes that are already reshaping the state and the nation. Both Alabama and the nation as a whole are undergoing seismic shifts that will change the country.
Population is flowing to the South.
The country is becoming more diverse.
Marriage across racial and ethnic lines is increasingly common.
The country is aging.
Men’s share of the higher education population and the workforce is declining, while women’s share is rising.
Grandparents are increasingly involved in or responsible for the raising of their grandchildren.
Recognizing and preparing for these changes will be essential if Alabama is going to be competitive in coming decades. A fuller discussion of Johnson’s observations can be found in a paper Johnson published last year in Business Officer, a publication of The National Association of College and University Business Officers
Though Alabama has not grown as rapidly as magnet Texas and the Southern states on the East Coast, it will feel the same shifts. The native-born white population is not reproducing fast enough to replace itself, much less grow in numbers. Meanwhile, Hispanics, blacks and other minorities are younger on average and will constitute a greater share of the population over time.
Technology is pushing the frontiers of education
Neil Lamb of the HudsonAlpha Institute for Biotechnology discusses the future of education at the PARCA 2020 Annual Meeting.
Neil Lamb, the Vice-President for Educational Outreach at Huntsville’s HudsonAlpha Institute for Biotechnology, highlighted factors that will shape education over the next 100 years: the ease of information access, advances in the science of learning, the rise of personalized learning, and the development of data-driven classrooms that allow for in-the-moment shifts in teaching strategy.
Lamb said these innovations offer great promise but they can’t be deployed haphazardly or without adequate support for the teachers that will need to use the tools to help children succeed. There must be attention paid to equity in spreading technology and adequately resourced professional development to support its implementation. Lamb, who served on the Governor’s Advisory Council for Excellence in STEM, pointed the audience to that Council’s recently released report: Alabama’s Roadmap to STEM Success.
The STEM Success report includes the recommendation that an evaluation process be built into the math coach initiative so policymakers will be able to measure its impact and adjust the strategy in pursuit of success.
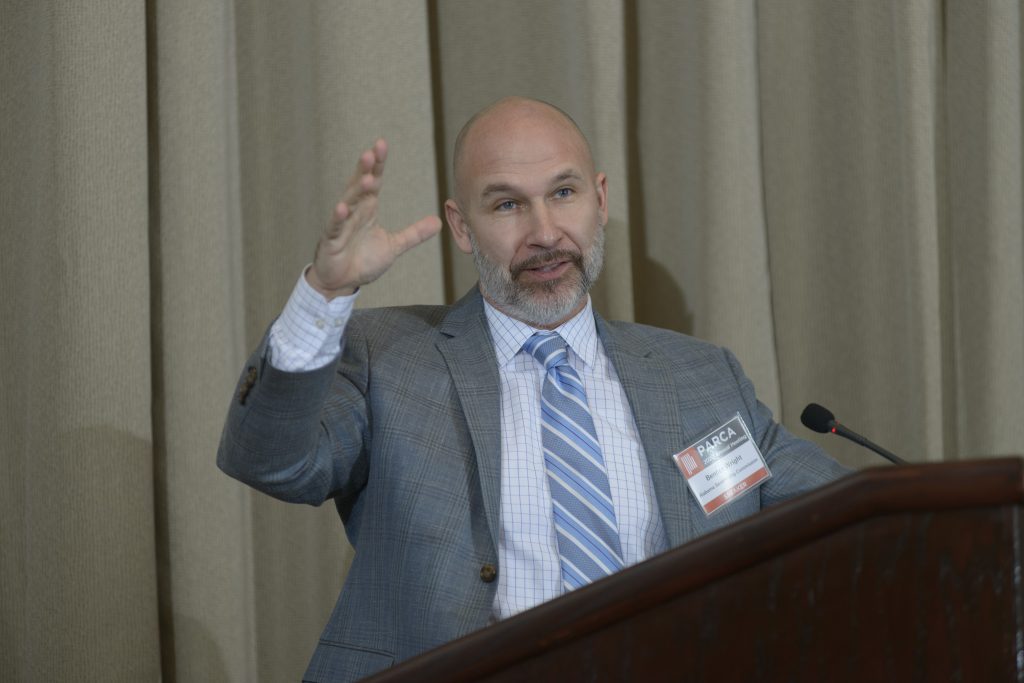
Alabama’s crisis in corrections must be addressed now
Bennet Wright, executive director of Alabama’s Sentencing Commission, speaks on the criminal justice and corrections.
Bennet Wright, Executive Director of the Alabama Sentencing Commission and past President of the National Association of Sentencing Commissions, challenged the audience to think differently about prevailing but largely unexamined assumptions about crime and punishment.
Wright said Alabama has created one of the most complex systems of criminal justice and corrections in the United States. New laws are laid on top of old, but the old are not repealed. A multitude of different agencies and players operating with distinct motivations keep the institutions from functioning together as a system. Wright’s presentation materials can be accessed here.
Governor Kay Ivey’s Study Group on Criminal Justice Policy, chaired by Justice Champ Lyons, released a report and reform recommendations just last week. A letter with recommendations can be accessed here.
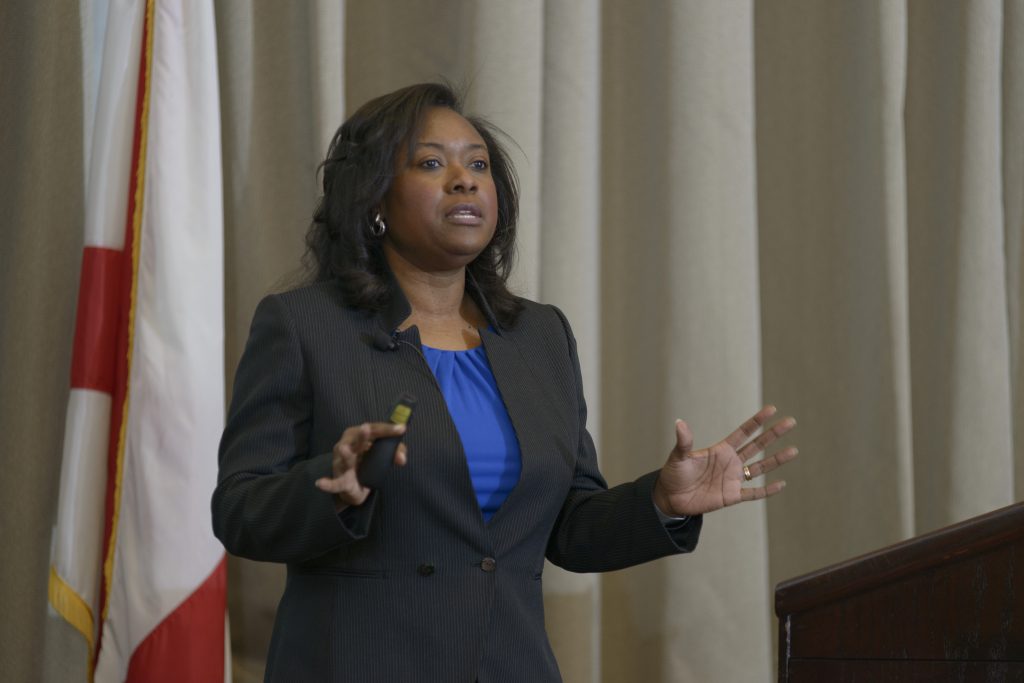
Monica Baskin, a professor in the Preventive Medicine Division of the University of Alabama at Birmingham School of Medicine, discusses Alabama’s health challenges and possible promising approaches to improving health.
Monica L. Baskin, Professor of Preventive Medicine and director for Community Outreach and Engagement at the O’Neal Comprehensive Cancer Center at UAB, described the tremendous cost borne by Alabama as a consequence of poor health and pointed to opportunities to address health problems and health disparities before they become issues.
According to estimates by the Milken Institute, the direct and indirect costs of chronic disease in Alabama total more than $60 billion a year, more per capita than any other state except West Virginia.
In her presentation, Baskin cited several promising initiatives aimed at preventing the development of chronic disease, and encouraged partners statewide to increase innovation, collaboration, and equitable dissemination in order to get information to the people and places that need it most.
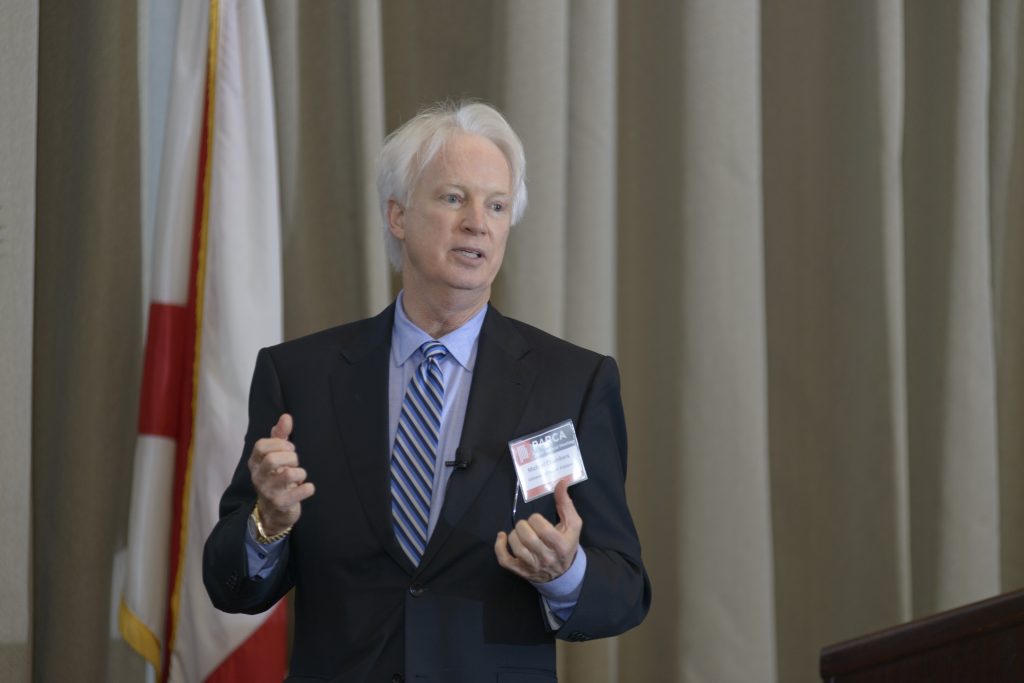
Time to speed up innovation in pursuit of opportunity
University of South Alabama Associate Vice President of Research Michael Chambers urges the state to adopt a more nimble and rapid approach to innovation and problem-solving.
And Michael Chambers, Associate Vice President of Research at the University of South Alabama, argued that we, as a state, need to speed up our pace of experimentation and change. Chambers, an experienced businessman, entrepreneur, and attorney, said businesses have had to learn to act quickly, be flexible, be competitive, to avoid complacency, and to plan on change. If Alabama’s leadership and citizens expect to be competitive, Chambers said, we should do the same.
Looking back to look forward
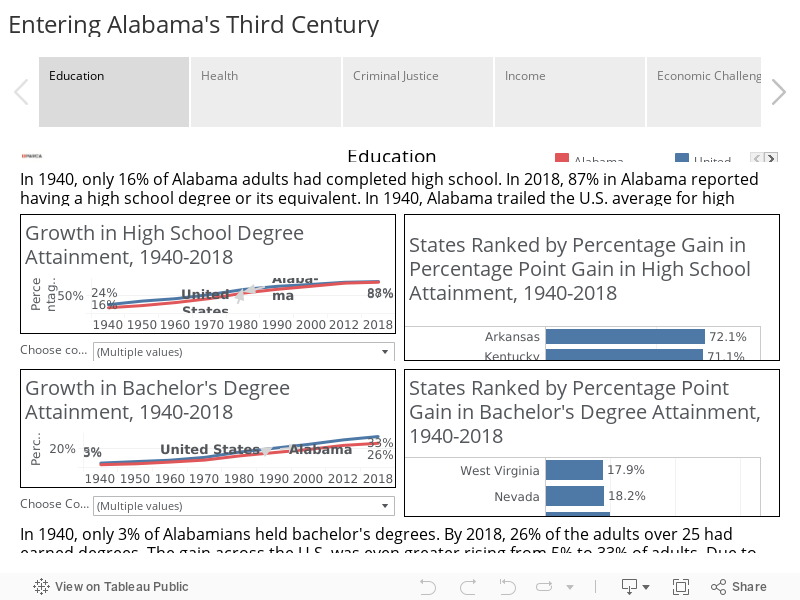
In preparation for the program, PARCA produced a series of charts that present key indicators of the economy, health, education, and criminal justice over a long time span. Interactive versions of those charts are available below. The charts compare Alabama to the U.S. average or to other Southeastern states. In the interactive version, you can change comparison states.
Alabama May be Catching on but Not Enough to Catch up
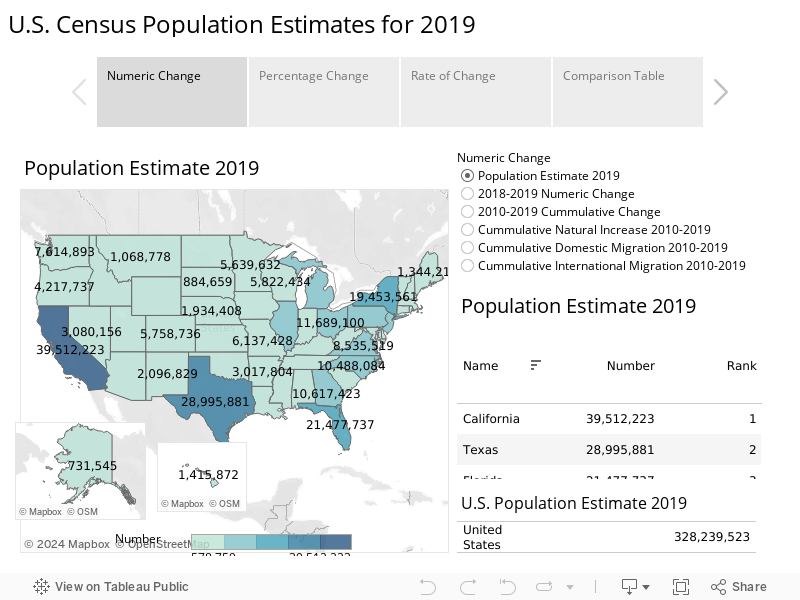
New estimates from the U.S. Census Bureau show Alabama attracting
more migrants from other U.S. states, but the state likely doesn’t have enough
population momentum to avoid losing a congressional seat after this year’s Census
count.
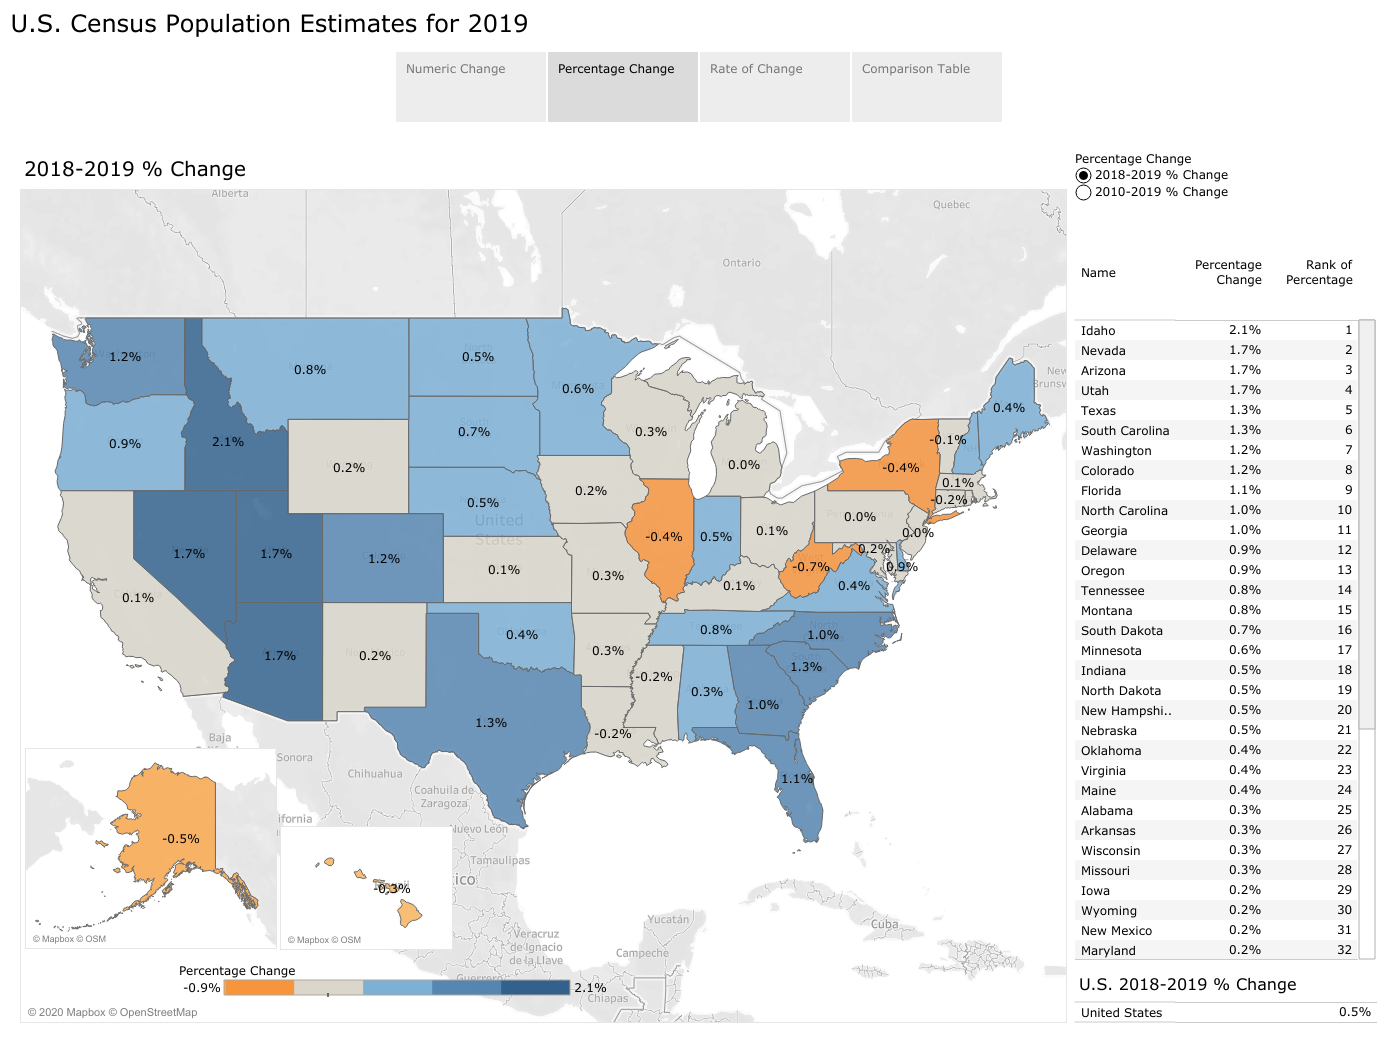
Alabama added 15,504 residents between July 1, 2018, and July 1, 2019, the period covered by the estimates. Only one other year this decade, 2012, did Alabama add as many new residents. Since the 2010 census, Alabama is estimated to have added 123,060 new residents. PARCA’s interactive charts allow you to explore the new statewide estimates. The button on the bottom right allows for a full-screen display.
That 2019 performance ranks Alabama 20th in numeric change and 25th in percentage change among the states. Ten states, including Mississippi, Louisiana, and West Virginia lost population in 2019, according to the estimates.
The net number of residents moving to Alabama from other states was 9,387, by far the highest total in domestic migration since 2010. During the middle years of the decade just-ended, Alabama was losing residents to other states.
Alabama’s birth rate, 11.7 per 1,000, is also slightly
higher than the national average of 11.6 per 1,000. Census estimates that 57,313
new Alabamians were born in 2019.
However, Alabamians die at a higher rate than people in other states. Among U.S. states, only West Virginia has a higher death rate. Alabama saw 53,879 deaths in 2019, according to the estimates. That’s a rate of 11 deaths per 1,000 population, compared to 8.7 per 1,000 nationally. As the population ages, the death rate in Alabama and across the U.S. has increased over the course of the decade, while the birth rate has declined.
Alabama is also in the bottom 10 states when it comes to attracting international migrants. The Census Bureau estimates Alabama had a net gain of 2,772 international immigrants in 2019, compared with a gain of 3,379 the year before.
The 2019 net gain was the smallest gain through international immigration for Alabama since 2010. Before 2016, the state saw several years in which international immigration was contributing a net of 5,000 new residents to the state each year. Alabama is not the only state to see a drop-off. Nationwide, the number of new residents moving to the U.S from abroad was estimated to be 595,348 in 2019. That compares to more than 1 million immigrants moving to the U.S. in 2016.
While Alabama is seeing modest population growth, its growth
rate is under the average for the South.
The Census South region includes many of the fastest-growing states in the country: North and South Carolina, Florida and Texas, Georgia and Tennessee. Overall, the states in the region grew by 9.6% since 2010. Alabama’s population grew by 123,060, or 2.6% over the same period.
North Carolina, which has added almost 1 million people since the last Census, and Florida, which has added almost 2.7 million, are expected to gain additional representation in Congress.
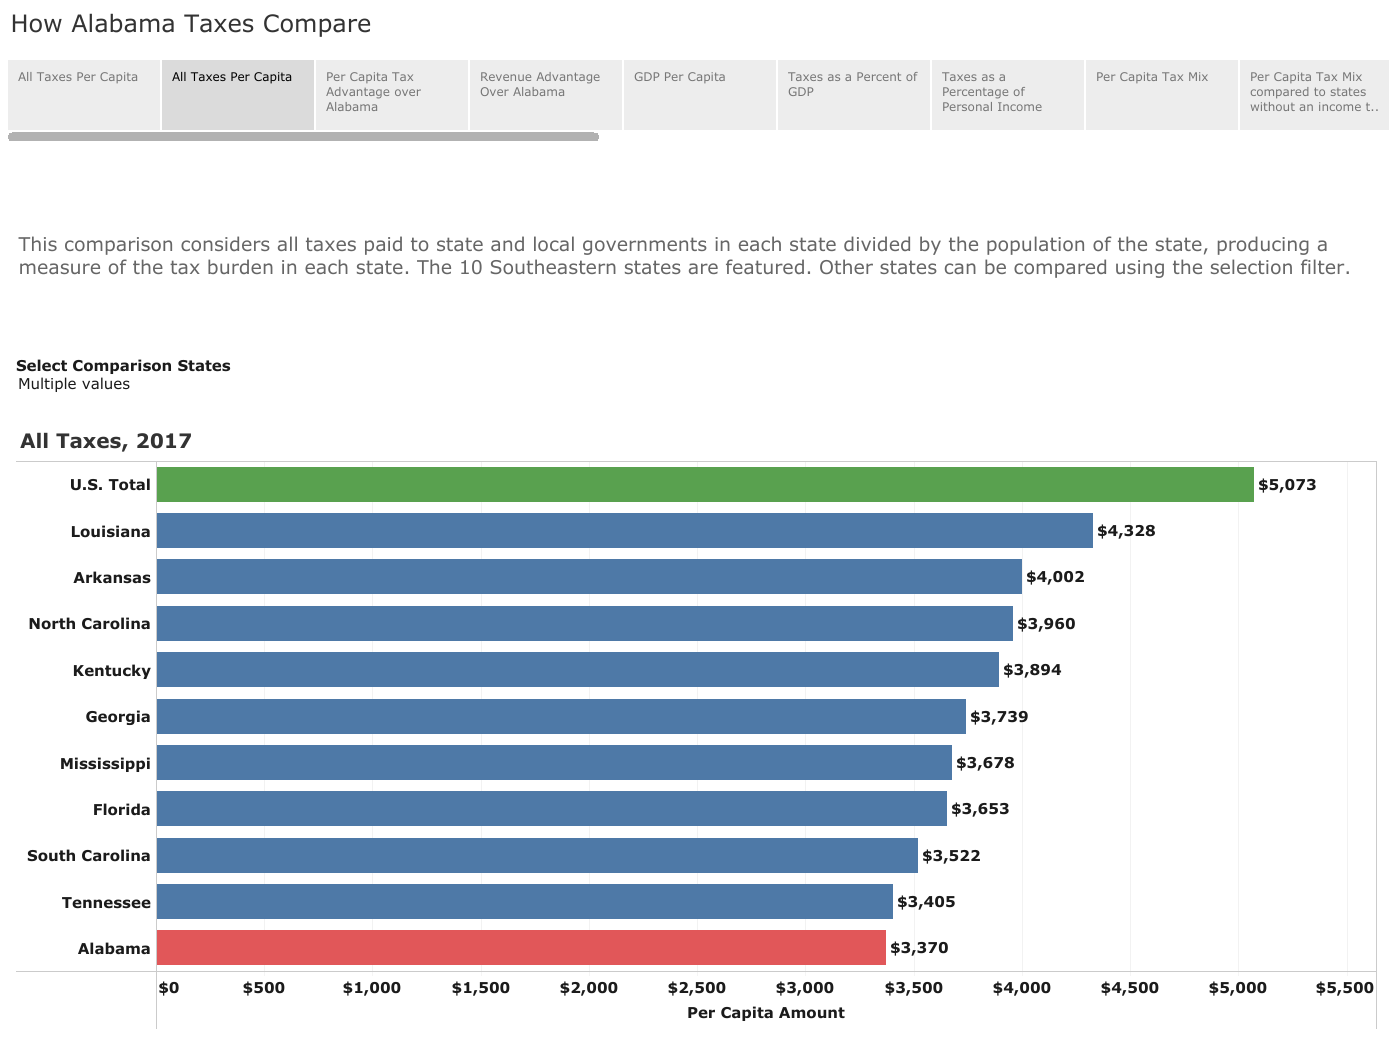
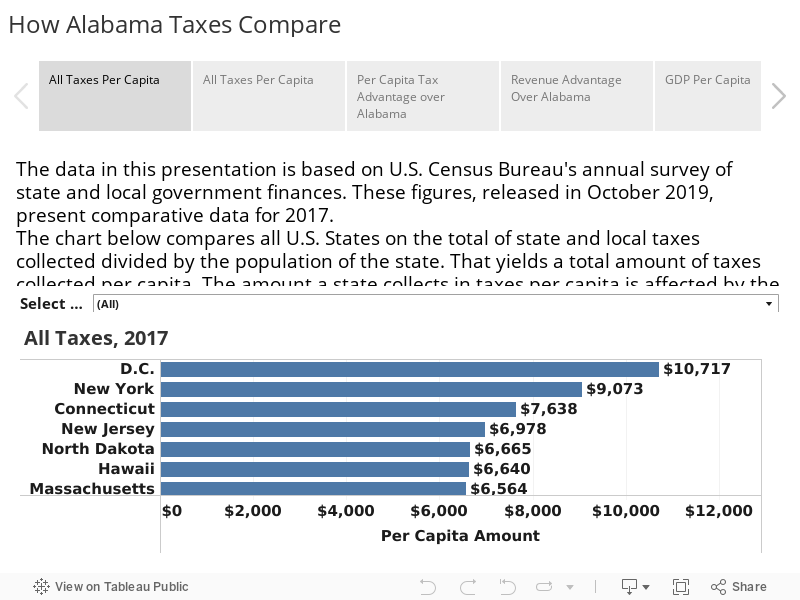
How Alabama Taxes Compare, 2019 Edition
Despite gaining some ground in 2017, Alabama state and local governments still collected less in taxes than state and local governments in any other state on a per capita basis. That’s been true since the early 1990s and partially explains why Alabama struggles to provide the same level of public services as other states.
PARCA’s 2019 edition of How Alabama Taxes Compare describes Alabama’s tax system and how it compares with tax systems in other states, based on the latest data available from the U.S. Census Bureau and the Bureau of Economic Analysis.
In addition to the PDF version of the report, the interactive charts below allow you to explore the data on your own. For better viewing, expand to the full-screen view by clicking on the button on the bottom right of the display below. Navigate through the story of Alabama taxes using the tabs at the top of the interactive display.
Mississippi’s Progress Not a Surprise; It was Part of a Plan
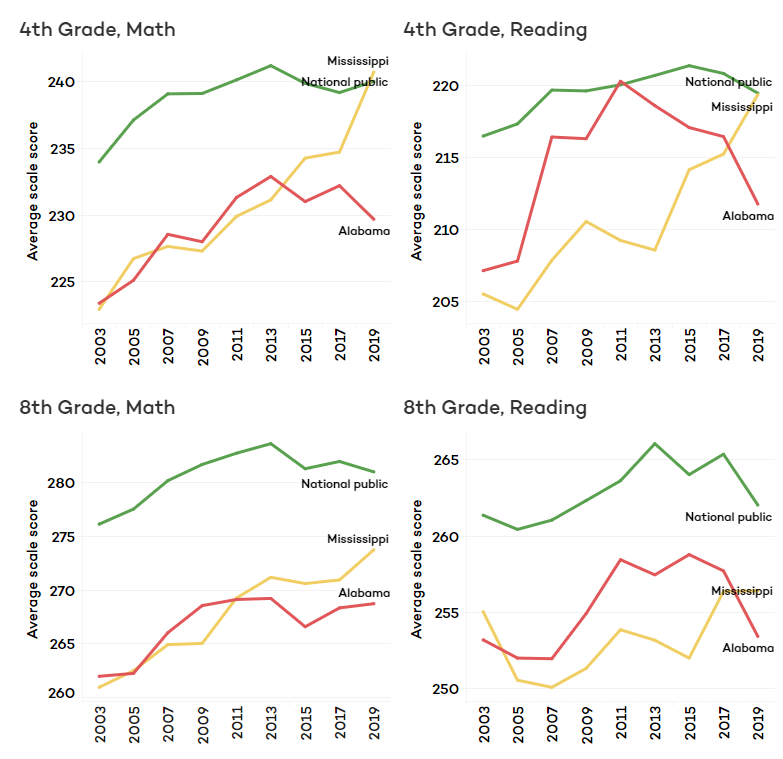
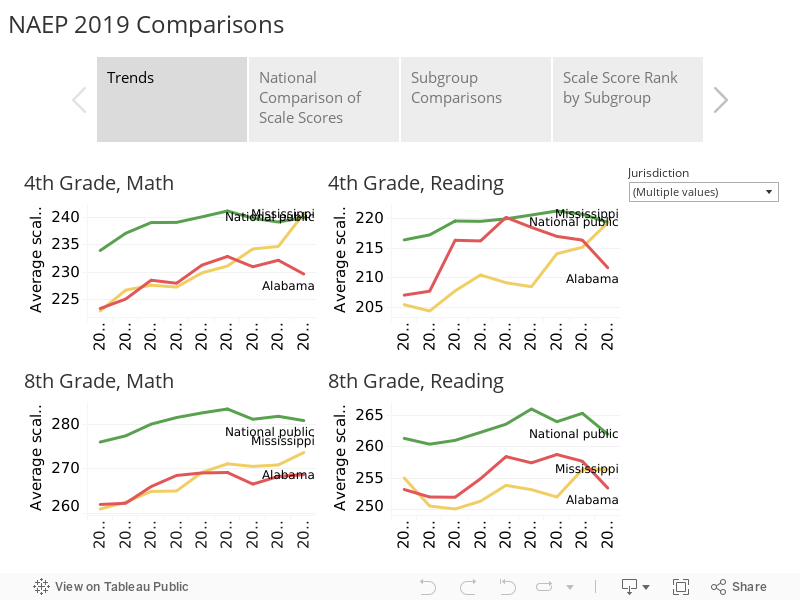
When the 2019 results of the National Assessment of Educational Progress (NAEP) were released last week, the good news was that fourth-grade students in our neighbor state, Mississippi, scored at the national average in both reading and math and that eighth graders there made significant gains in reading and math as well.
On all four measures, the average score for Mississippi students exceeds those of Alabama students, despite Mississippi’s higher level of poverty and higher percentage of students of color. The interactive chart below traces the average scale scores for Alabama and Mississippi students on the NAEP since 2003 on each of the four measures. The green line represents the average of public school students nationally. Other tabs in the chart allow you to explore other ways of looking at the data, including comparing demographically similar groups of students across states. In each of the main demographic and economic categories, Mississippi students are outperforming Alabama’s. The NAEP reading and math assessments are given every two years to a sample of students in each state, the sample representing the demographics of the state. It is the same assessment from year to year, and it is administered nationally. Known as the Nation’s Report Card, NAEP serves as the principal national measure of academic proficiency for U.S. education.
Mississippi has had a consistent and cohesive educationally-focused leadership in the Governor’s office, the State Legislature, and at the Mississippi Department of Education. Current superintendent Carrie Wright was recruited in 2013 from a leadership position in the District of Columbia’s rapidly improving public schools. Under Wright, and with the backing of an appointed state school board, Mississippi has operated under a plan that includes goals, objectives, and clearly articulated strategies aimed at meeting those goals. To track progress on the implementation of strategies and progress toward goals, the superintendent delivers an annual update that details actions taken to advance toward those goals.
Mississippi borrowed some aspects of its approach to improving reading from Alabama’s Reading Initiative. And more recently, Alabama borrowed from the Mississippi model. Earlier this year, the Alabama Legislature adopted a Literacy Act, similar to a Literacy-Based Promotion Act Mississippi adopted in 2013. Mississippi developed its own student assessment test for grades 3-8, MAAP, which was first deployed in the 2015-2016 school year. Alabama hopes to deploy its own state-developed assessment in the spring of 2020.
Over the long term, both Alabama and Mississippi have made progress in both reading and math. However, during Superintendent Wright’s tenure in Mississippi, Alabama has had five different superintendents. The State Department of Education did develop a state plan for education, Plan 2020, in 2012, but it was never fully developed and implemented and was shelved as subsequent superintendents came and went.
Reading
In 2011, just eight years ago, Alabama enjoyed the national spotlight when NAEP was released. Alabama fourth graders scored at the national average, having made the largest improvements in the U.S. That growth coincided with and has been generally attributed to the Alabama Reading Initiative (ARI). ARI emphasized a schoolwide commitment to getting all students reading at grade level, with an emphasis on Kindergarten through third grade. ARI placed a reading coach in every Alabama elementary school and required intensive professional development to teachers on research-based approaches to teaching reading.
However, after that achievement, and in the face of a constrained budget, funding for ARI was reduced, and schools were allowed to repurpose the state-funded reading coaches for other purposes. Reading scores on NAEP began drifting and in 2019 dropped sharply in both fourth and eighth grades.
Earlier this year, the Legislature adopted the Literacy Act, which will require that third graders be able to read, or they will be held back to repeat third grade. The Literacy Act, modeled after similar legislation in Mississippi and other Southeastern states, is expected to add urgency to reading instruction and to addressing reading challenges like dyslexia. ARI’s funding was also increased by $6.5 million, though at $51 million per year, that’s still far from the $64 million it received at its peak in 2008. Education leaders say the program will be restored to fidelity.
Math
While the 2019 reading results on NAEP were distressing for the severity of the drop, the math results for Alabama students were equally disturbing. Alabama school children in both the fourth and eighth grade had the lowest average test scores in the United States. It’s a familiar position for Alabama. Alabama ranked behind all other states in 2015. In 2017, Alabama students climbed a couple of notches in the rankings, but slipped back into last this year.
The state’s strategy for addressing math is less clear. In March of 2019, Gov. Kay Ivey put on hold new math standards, which had been developed by a statewide panel of educators. Ivey postponed adopting the changes to the math course of study after some conservative groups, who are opponents of the Common Core state standards, voiced their objections. In a letter to State Superintendent Eric Mackey, Ivy asked that Alabama’s new proposed math curriculum be compared to the math course of study for the top six performing states on the NAEP: Massachusetts, Minnesota, the Department of Defense’s educational system, Virginia, New Jersey, and Wyoming.
Considering Mississippi’s results, its approach to math should be examined as well. Mississippi did adopt the Common Core standards. Judging by national results, it safe to say that Common Core did not cause NAEP scores to leap. But it’s also true that states that did not adopt the Common Core have seen declines on the NAEP as well. Other factors may be contributing to an overall stagnation in educational progress. However, with Mississippi bucking the trend, Alabama would be well served to take note and inspiration from our neighbor’s progress.
Another Year of Strong Growth in Alabama Tax Collections
The thriving economy produced another year of surging tax collections for Alabama’s General Fund and Education Trust Fund (ETF), the two primary accounts that provide state funding for government operations. The better-than-projected results put the state in a good position to meet current obligations and weather a downturn should it arise.
It also appears that budgeting changes made by the Legislature in recent years have created more balance in revenue growth between the two funds.
According to the state’s financial reports for the fiscal year that ended on Sept. 30, the taxes and revenues that feed the General Fund were up 8% over 2018. Revenue to the ETF increased by 7% over the previous year. It is unusual that the General Fund’s rate of growth exceeded the ETF’s. Historically, the ETF, which contains major growth taxes like the income and sales taxes, grows faster than the General Fund.
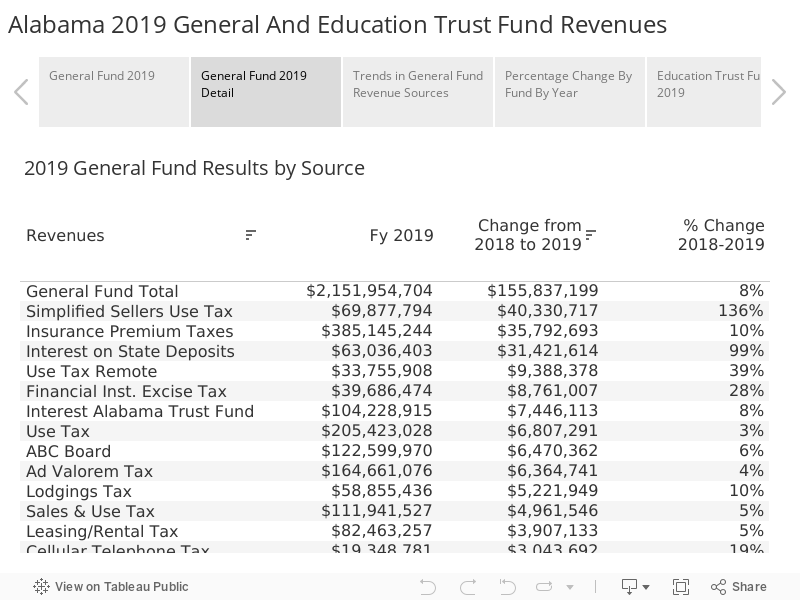
In dollar terms, General Fund revenue increased by $155,837,199.45
to a total of $2,151,954,704, while ETF collections rose by $461,710,824 to $7,215,276,202.89.
Collections in both funds exceeded projections.
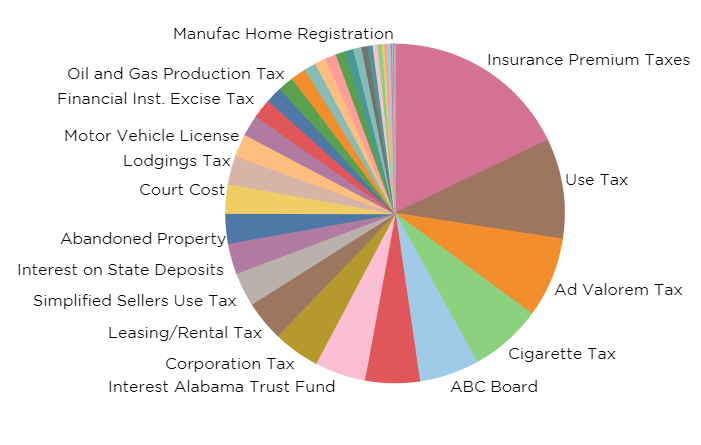
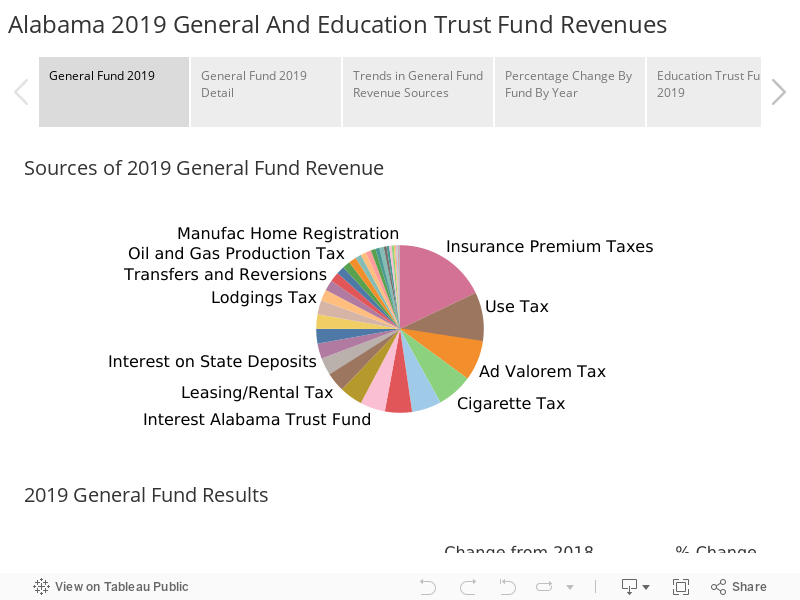
General Fund
Alabama’s General Fund revenues are derived from a hodgepodge of taxes, most of which moved in a positive direction. General Fund spending supports health programs, like Medicaid and the Departments of Health and Mental Health, as well as law enforcement, the judicial and corrections system and other public safety agencies, plus a variety of other non-education programs.
In dollar terms, revenues from insurance premium taxes are the biggest contributor to the General Fund, providing $385 million or 18% of total collections. Those taxes, which are applied to the premiums paid by insurance policyholders, grew 10 percent over 2018, putting an additional $35 million into the General Fund.
There may be several reasons why this tax is growing at a faster rate than the overall economy. Since more people are employed and have more stable resources, more of them might be buying insurance in contrast to tougher economic times. At the same time, insurance companies may be charging more in premiums as they rebuild reserves needed to cover storm events and rising costs.
The Insurance Premium Tax is set to become an even bigger contributor to the General Fund in future years. A fixed amount of the tax, $31 million, had flowed into the Education Trust Fund. That division of the tax will end, and the total tax will flow into the General Fund. However, the transfer of this revenue comes with the understanding that the General Fund will have to cover the cost of the ALL Kids Children’s Health Insurance Program in future years, an expense that will rise over time.
In percentage terms, the tax that experienced the biggest jump in both its contribution to the General Fund and its rate of increase was the Simplified Sellers Use Tax. This is a tax paid on purchases made over the Internet and delivered to Alabama. Originally established in 2015 as a voluntary method for out-of-state sellers to remit sales tax to the state, the law has been increasingly tightened to require businesses that have significant online sales to participate. A 2018 decision by the U.S. Supreme Court, known as the Wayfair decision, gave further authority to collect taxes on online sales.
As more online retailers came aboard in 2019, General Fund revenue from the source jumped by 136% or $40 million to a total of $70 million for 2019. The General Fund gets 75% of the Simplified Sellers Use Tax. The remaining 25%, amounting to $23 million in 2019, went to the Education Trust Fund. So, the total revenue from the Simplified Sellers Use tax in 2019 rose to $93 million compared to $40 million the year before.
Growth in this tax will likely continue as online sales continue to rise, but the rate of increase should not be nearly as high in the future.
Also helping boost the General Fund were higher interest rates. The interest paid to the state on its cash deposits jumped by $31 million in 2019 to a total of $63 million. Interest rates have subsequently fallen so this revenue source may not be as robust in 2020.
The Use Tax, the General Fund’s second-largest source of revenue, saw a respectable 3% growth, bringing in an additional $6.8 million for a total of $205 million. The Use Tax is collected on out-of-state purchases or leasing of equipment or machinery.
Revenues contributed by the state-regulated alcohol sales were up by 6.5% to $123 million. Property taxes were up 4% to $165 million. The lodging tax jumped 10% to $59 million. Analysts believe a strong year at Baldwin Counties beaches provided a boost, assisted by increased tourism to Montgomery with the opening of the National Peace and Justice Memorial.
Some tax sources declined. Cigarette taxes continued their long slow decline, down 4 percent or $5.6 million. Still, cigarette taxes, which contributed $149 million in 2019, are the 4th largest tax source in the General Fund. Tax collections on vaping products increased 62% but are a very small source of revenue at $2.3 million for the General Fund in 2019.
While the $19 million contributed by the Cellular Phone tax appears to be an increase, base collections actually declined in 2019. The total collections for 2018 were depressed by a refund of the tax paid out as a result of a lawsuit. For the most part, mobile telephone companies no longer charge customers for calls but instead charge for data. Calling plans are taxed; data plans are not subject to tax.
Taxes on automobile titles dropped 6% after several years of gains. The decline could indicate a slowdown in auto sales, a development that would introduce a dark cloud to Alabama’s otherwise sunny economic horizon.
In the interactive chart below, you can compare trends in taxes since 2015. The menu on the right of the chart allows you to decide which taxes appear in the view.
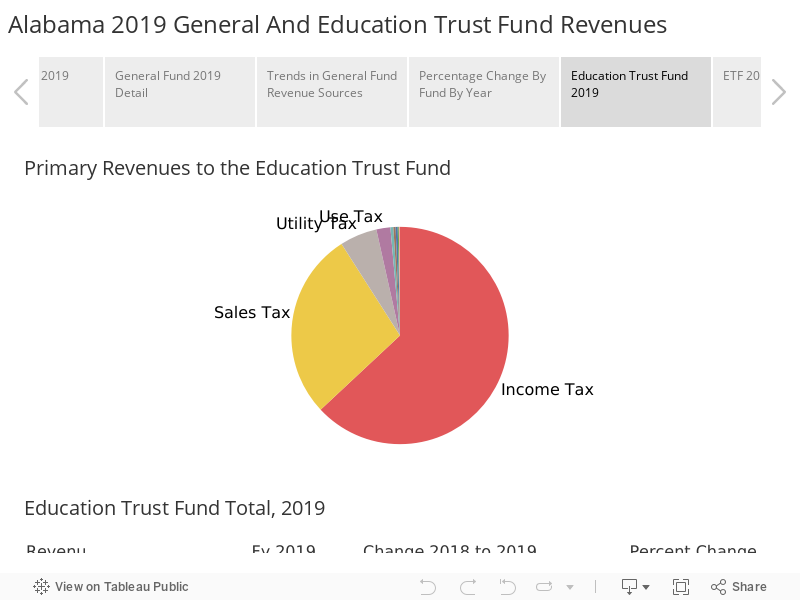
Education Trust Fund
Strong growth in income and solid sales tax growth powered another year of growth in the Education Trust Fund. Those two taxes, both of which are earmarked for education, supply over 90 percent of the education budget. In 2019, income tax collections made up 63% of ETF deposits, while sales taxes contributed 28%.
Income taxes were up $340 million, or 8%, for a total of $4.5 billion. According to financial reports, individual income tax receipts were up 6%, while corporate income taxes increased 15% over 2018. When refunds are taken into account, individuals paid $4.2 billion and corporations $455 million in income taxes.
Along with the general economic growth, the sharper rise in corporate tax collections was likely spurred by the cut in federal corporate income taxes, enacted in December of 2017. Federal income taxes are deductible from Alabama income taxes. With corporations paying less in Federal income taxes, that meant corporations kept a greater share of profits, leaving more corporate income for Alabama to tax.
Sales tax collections rose 6%, to $2 billion, contributing an additional $105 million to the ETF. Total sales tax receipts increased 4%, while the amount held back to pay state agencies decreased. The Department of Human Resources received a smaller sales tax refund because DHR is paying out less in SNAP benefits. The Alabama Department of Revenue also decreased the amount it assessed the state for sales tax collection.
Beyond the income and sales taxes, as noted above, the ETF portion of the Simplified Seller’s Use Tax grew by 136%. In the case of the ETF, that provided an additional $13 million for a total contribution of $23 million. The third-largest contributor to the Education Trust Fund is the utility tax, which brought in $401 million, which was a $5 million or 1% increase over 2018.
Implications of Better-than-Expected Growth
According to Finance Director Kelly Butler, the General Fund ended with a $275 million balance that will be available to appropriate in future budgets.
For the ETF, it’s a little more complicated, due to rules set up under the Rolling Reserve Act, a budgetary control measure designed to curb unsustainable spending and to generate a cushion for use during economic downturns.
According to Butler, the ETF generated an “overage” of $579 million in 2019. Of that, $66.5 million, or 1% of direct budgeted spending in the ETF, will be shifted to the ETF’s Budget Stabilization Fund.
The remaining $512 million will be shifted into the Advancement and Technology Fund. That money will be available for appropriation during the next legislative session to K-12 schools and colleges and universities for spending on non-recurring expenses such as deferred maintenance, school security measures, and educational technology or equipment.
The 7% growth rate for the 2019 ETF will be added to the calculation of the Rolling Reserve’s built-in cap on the growth of education spending. That budget cap is calculated by taking the ETF’s growth rate in each year of the past 15 years, dropping the year with the lowest growth rate, and then finding the average rate of growth for the remaining 14 years.
Despite the good results this year, that overall average will be down slightly. Thus, the allowed rate of growth in spending will be slightly lower in the 2021 budget than it was in the 2020 budget.
That’s because the year dropped from the 15-year window, 2004, was one of the extremely high growth years that preceded the Great Recession. In those years, recurring revenues to the ETF were increasing around 10 percent per year.
The average growth rate will be declining for the next couple of years as those high-growth years drop out of the calculations.
While a final calculation hasn’t been made, it is expected that the spending cap on the 2021 Education Trust Fund Budget will be somewhere between $300 and $400 million over the 2020 Education budget, which totaled $7.1 billion.
It’s important to remember that the Rolling Reserve Act creates a cap on increased spending. The Legislature is in no way obligated to spend up to the cap.
The Bigger Picture
Both the $2 billion General Fund and $7 billion Education Trust Fund are only part of the picture when it comes to paying for the operation of state government agencies. Beyond the tax sources detailed above, other state taxes are earmarked for certain purposes and sent directly to a designated agency.
There are also huge inflows from the federal government, particularly supporting Medicaid and other health programs, road construction and maintenance, and education. The federal contribution is a similar amount to what is generated by state taxes.
Other state agencies generate revenue. Colleges and universities charge tuition. Hunters and fishermen buy licenses that help fund the Department of Conservation and Natural Resources. Companies buy permits that help pay for inspections by the Alabama Department of Environmental Management. Those federal and state revenues are then spent supporting the agencies.
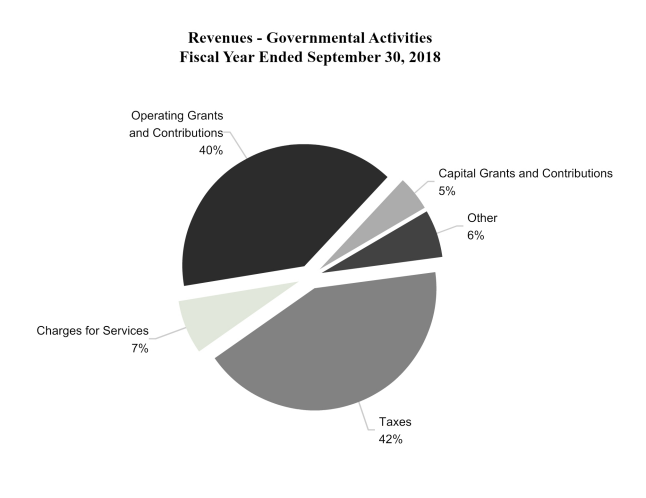
Alabama’s most recent Comprehensive Annual Financial Report (CAFR) details revenues and expenditures for Fiscal Year 2018. In terms of revenue, the CAFR indicates that total revenue was a little over $22 billion, more than double the tax collections deposited into the ETF and General Fund. The CAFR provides the chart below to illustrate the sources and proportion of all the revenues supporting the state governmental activities.
Source: Alabama 2018 Comprehensive Annual Financial Report, State Comptroller’s Office
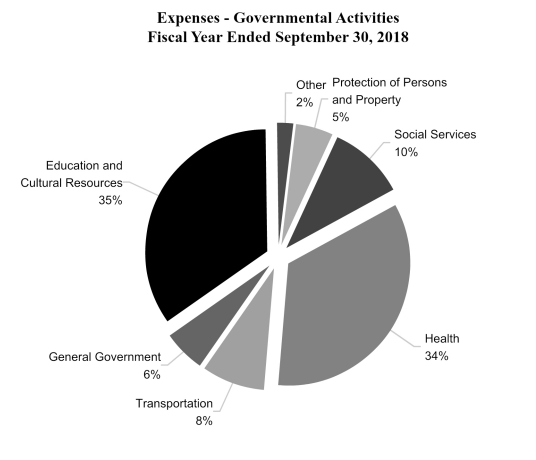
The CAFR also presents the government’s expenses for 2018, broken down by category of spending. On the surface, comparing the sizes of the General Fund and the ETF, it appears that we spend significantly more on education than we do on other functions of government. However, when federal funds and other earmarked taxes and revenues are taken into account, there is a more equal distribution of spending, with about one third spent on education and culture, about one-third spent on health, and one third spent on other functions: roads, law enforcement, the courts, prison, general government.
Source: Alabama 2018 Comprehensive Annual Financial Report, State Comptroller’s Office.
Cooperating for the Sake of Self-interest
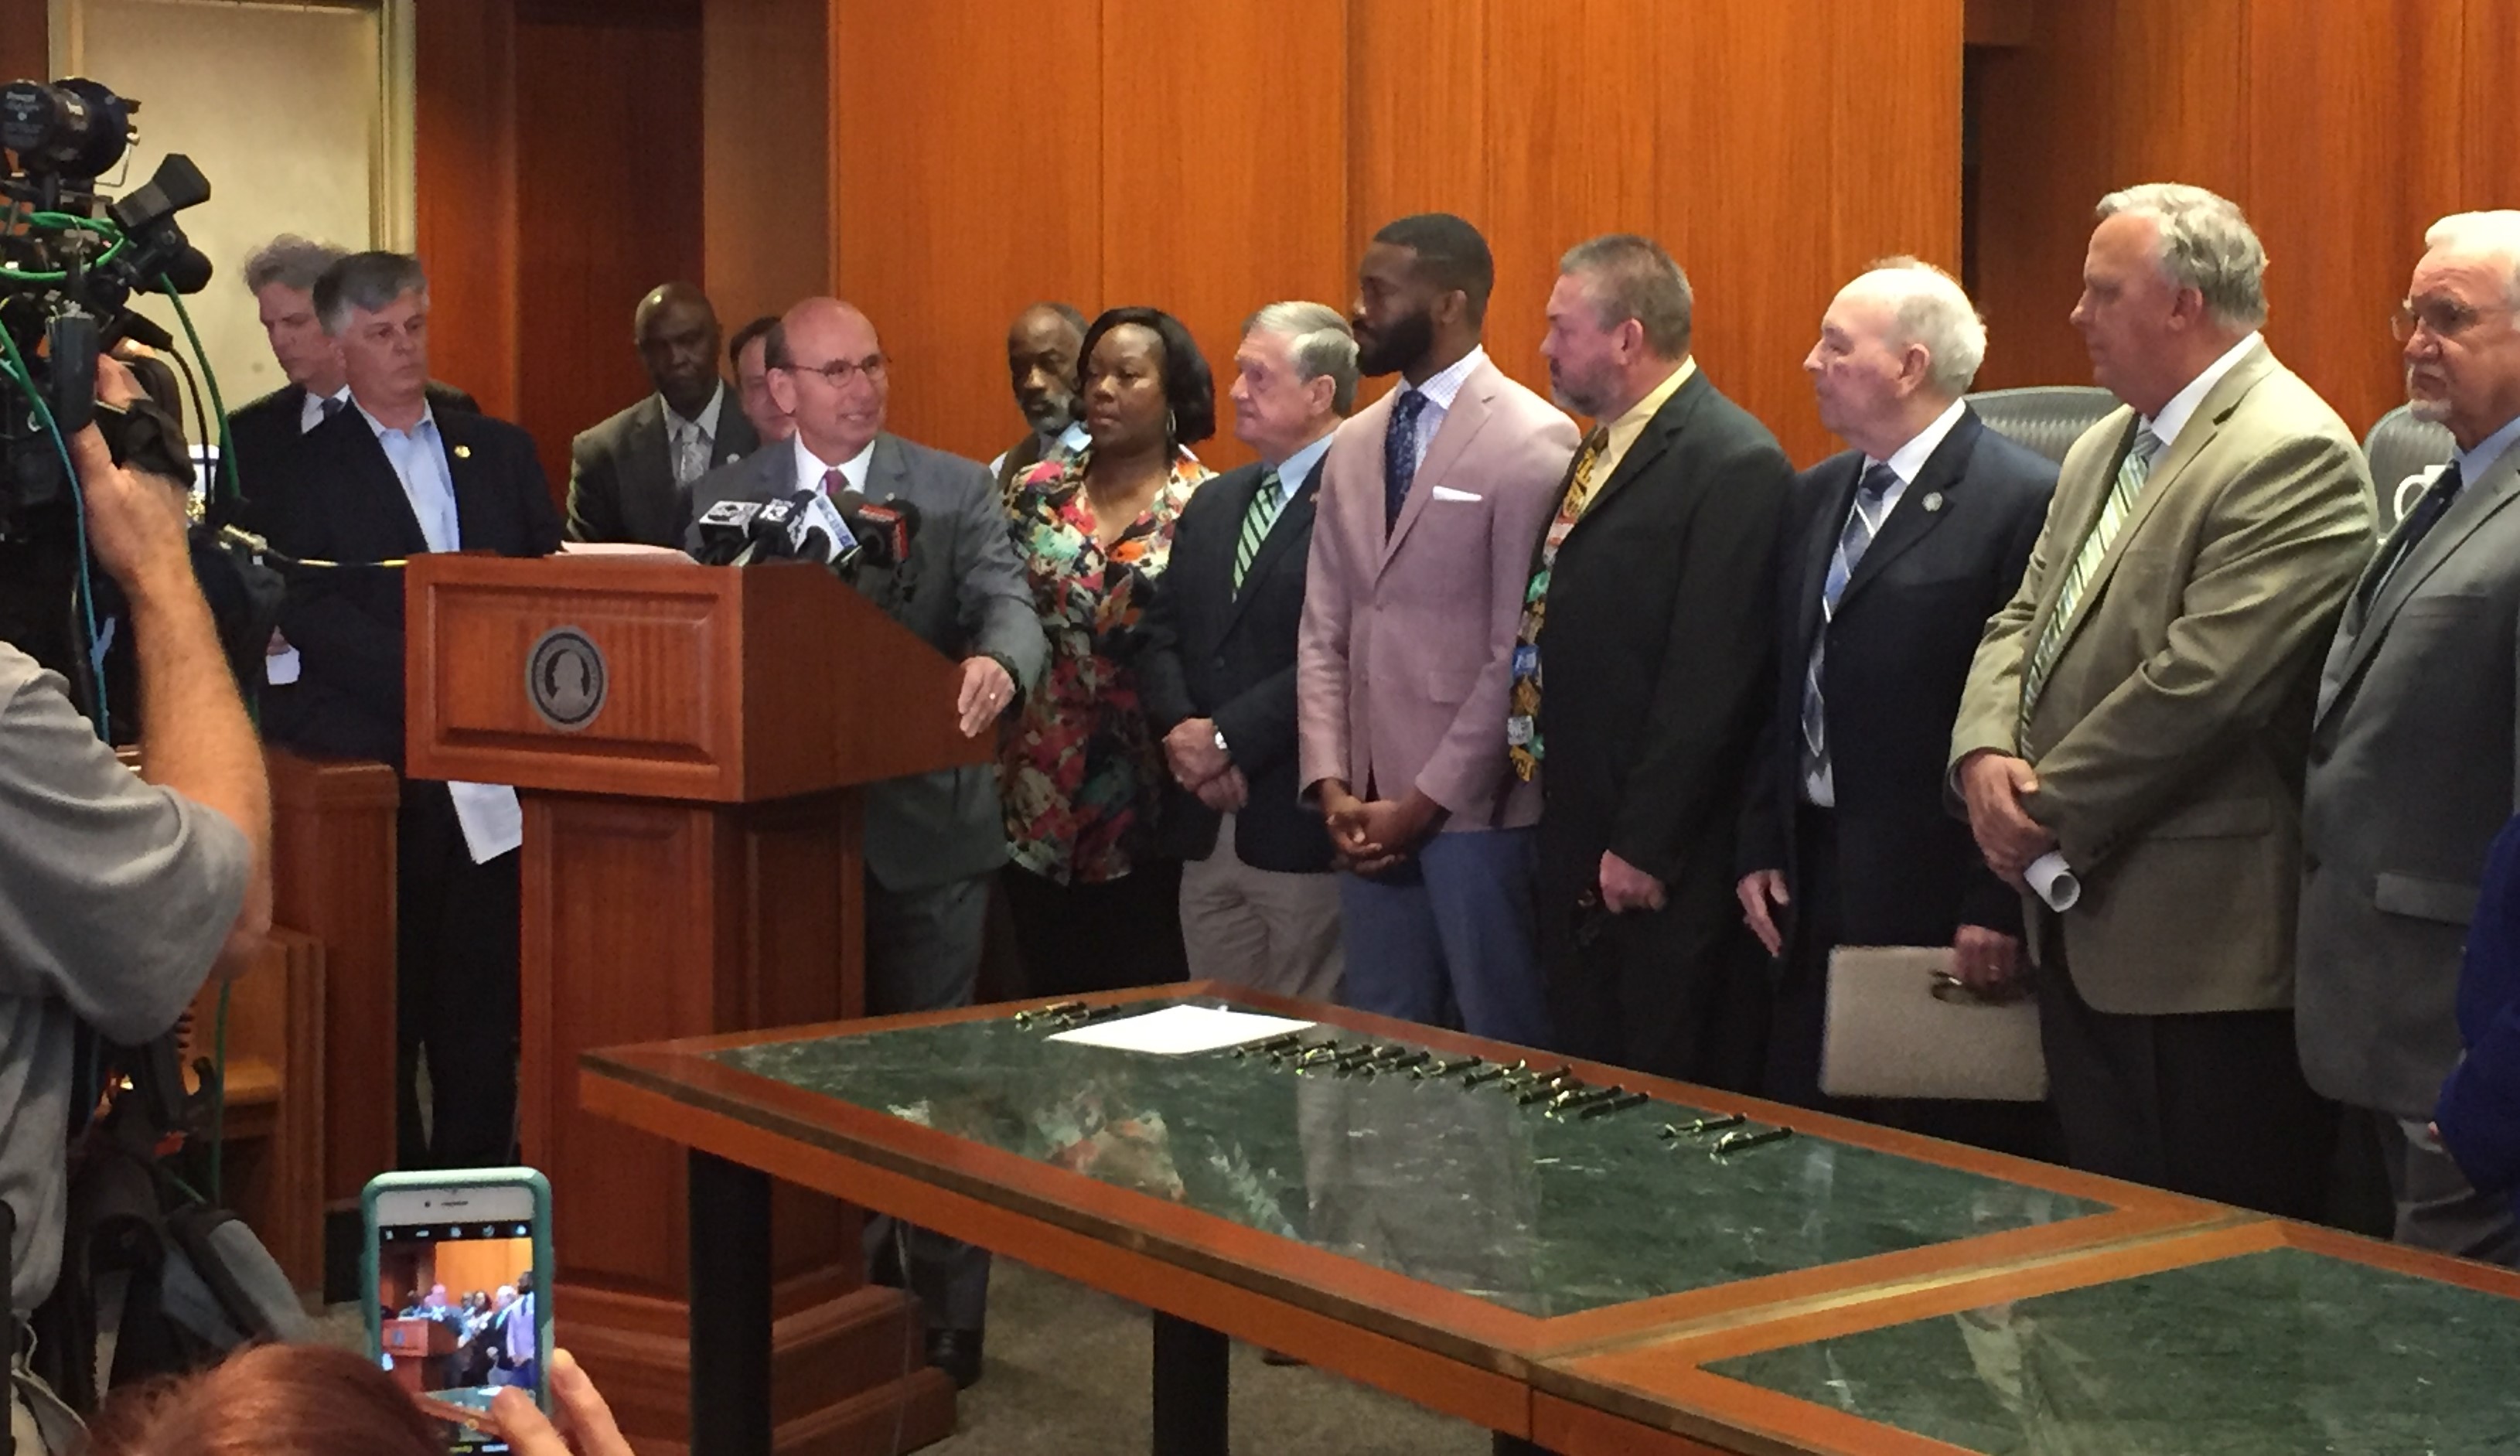
Hoover Mayor Frank Brocato speaks to fellow mayors and Jefferson County Commissioners as they prepare to sign Good Neighbor Pledge, a non-poaching agreement forged by Jefferson County’s mayors.
Any effort to promote cooperation between governments quickly
runs into skepticism.
Cities and their citizens are self-interested, the thinking goes. They are not going to give up their advantages. They’re not going to be charitable to a neighboring community, just for the sake of being nice.
And
the skeptics are right.
However,
that doesn’t foreclose opportunities for cooperation. In fact, self-interest is
the starting point for cooperation.
That’s one the lessons learned on the way to the Good Neighbor Pledge, an agreement signed earlier this year by about two dozen mayors in Jefferson County. Under the agreement, mayors pledged not to encourage or incentivize the relocation of local businesses from neighboring cities to their own. In so doing, the mayors hope they’ve solved a problem all of them were facing: a growing demand and expectation that local governments provide tax incentives to retain or attract businesses.
On the surface, signers of the
Pledge appear to be giving up advantages and competitive tools in economic
development. However, because almost all the key governments participated, the
pledge resets the rules of the game, short-circuiting counter-productive and
mutually damaging competitive battles that were costing all cities time,
attention, and tax dollars while providing no net benefit to the region.
This feature is part of an occasional series on creative cooperation between local governments and other civic partners. Through the series, we hope to identify, share, and spread best practices and lessons learned.
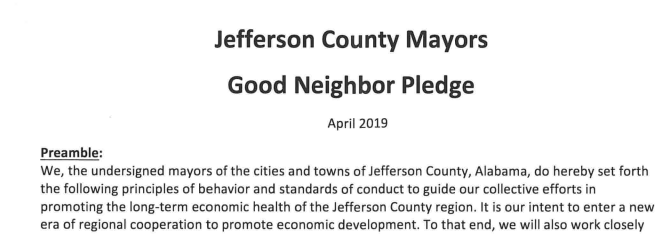
The opening text of Jefferson County Mayors’ Good Neighbor Pledge
Laying the Groundwork
The Good Neighbor Pledge grew out
of an effort by the Community Foundation of Greater Birmingham (CFGB) to understand
regional challenges and to identify options for addressing those challenges. If
not for the background research and dissemination of the findings, the Good
Neighbor Pledge likely would not have come about.
After arriving in Birmingham in
2014, CFGB president and CEO Chris Nanni kept hearing from Birmingham-area
leaders that the fragmented nature of the region, 35 municipalities in
Jefferson County alone, was interfering with the region’s ability to
effectively address problems or pursue an over-arching vision for the
community.
With funding from a key circle of
the Community Foundation’s Catalyst donors, the Community Foundation
commissioned PARCA to research whether Greater Birmingham’s lack of cooperation
was negatively affecting its ability to compete and if so, how other cities and
metros have overcome fragmentation and moved toward a more unified approach to
community progress.
To help frame the issues and provide response and guidance to the study, CFGB formed a broadly-representative strategic advisory group of Birmingham area leaders who were consulted throughout the research process. After the report, Together We Can, was published, the leaders from that Strategic Advisory Group were also essential in carrying the information and conclusions out to the community.
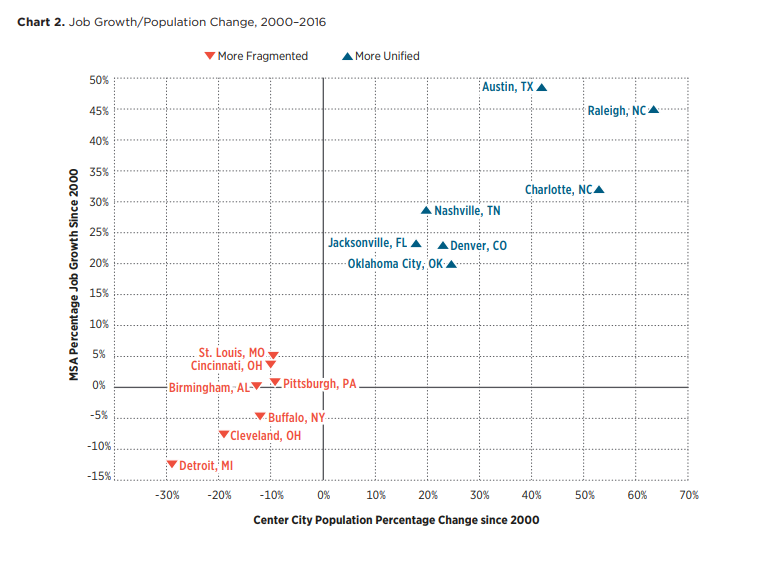
Published in June 2017, Together We Can concluded that Birmingham and other similarly fragmented cities consistently performed more poorly on economic and social measures than more unified metros. Cities around the country have long worked to overcome the challenges presented by fragmentation, and the report described four organizational models used by cities to counter fragmentation and increase cooperation.
After releasing the report, the Community Foundation and representatives of the strategic advisory group hand delivered copies to community leaders, spoke to civic clubs, and participated in radio and newspaper interviews and panel discussions. Neither the report nor the CFGB argued for a particular approach to increase cooperation. Nor was the cooperation conversation centered around a particular project or issue. It instead described approaches other cities took and encouraged Birmingham citizens and leaders to find a response that fit local circumstances.
“The education piece was
essential,” Nanni said
That neutral approach was
important because the prevailing climate among elected officials in Greater
Birmingham was suspicion. That was clear during an early presentation to the
Jefferson County Mayor’s Association.
“The first time we presented to them there was a lot of tension in the room, particularly among the incumbent mayors. For so long, the atmosphere was one of suspicion and competition. Zero trust. But as they came to see we weren’t trying to force them into something, they started warming up,” Nanni said.
The publication of the report preceded an election cycle in which several mayors’ races were on the ballot. Regional cooperation became an issue talked about in mayoral and council races that took place across the metro in 2017.
And
it just so happened that among the new crop of mayors, there were several new
faces who were open to new ways of doing things.
You Don’t Have to Reinvent the Wheel
When attempting to break old negative patterns, it is
tempting to propose starting from scratch, inventing a new organization or
governmental authority to shape a new reality.
However, it’s sometimes best to put existing institutions to work solving problems rather than inventing a new one. In Jefferson County’s case, Together We Prosper proponents looked foran existing cooperative structure that could be repurposed, energized, or motivated to drive cooperation.
The Jefferson County Mayors’ Association emerged as a candidate. It had some legal standing and functionality, but, in the opinion of many of the participating mayors, it wasn’t living up to its full potential. The mayors had a monthly meeting that was paid for by a rotating cast of lobbying groups who got an audience with the mayors in exchange for paying for their lunch. Mayors got to network and casually discuss common experiences, but there was no push to collaborate, innovate, or address common problems.
Let it be their idea
The Community Foundation encouraged and sponsored a half-day summit for the Association, during which it was hoped that the mayors could find an issue they could rally around addressing.
The Community Foundation provided a facilitator to get the conversation going, but the mayors chose the topics to explore.
So it was the mayors themselves who coalesced around a challenging initiative: ending the bidding wars for local businesses. And since they chose it, they felt ownership of the initiative.
Identify Mutual Self Interest
Local governments across the
country are waking up to the fact that offering economic incentives for local
business relocation is ultimately a losing proposition.
In 2004, communities
in the Metro Denver areas enacted a Code of
Ethics
designed to end business poaching and promote regional cooperation around
economic development. Many others have
followed suit. Just this year, Missouri and Kansas found a way to end an incentives arms
race that was allowing companies to
reap incentives by moving between the Missouri and Kansas portions of Kansas City.
According to
research, in at least 75 percent of cases, businesses would have made the same decision
to relocate or expand whether or not incentives were offered by governments.
If a business is considering equally appealing sites and they know that in the local market municipalities play the incentives game, the richer offer might make a marginal difference. However, the deal doesn’t produce a net gain for the region. The attracting jurisdiction forgoes taxes that may actually be needed to offset the increased traffic or demand for public safety protection. Granting one business tax incentives arguably gives that incoming business an advantage over existing local businesses.
Identify a Champion
To forge consensus and push the process, the Mayor’s Association needed to identify a champion. They found it in Mountain Brook Mayor Stewart Welch. Welch had only been in office two years. He came out of an investment advising and management business. He wasn’t invested in the prevailing political order of things, and he had credibility when talking about business and economics.
Welch reached out to each mayor and worked toward a proposal. The first part of the pledge was easy. The mayors would pledge not to solicit a local business located in a neighboring municipality to move.
It was harder to ask the mayors
to give up their tactical weapon.
Welch kept working to convince
his fellow mayors that a widely accepted agreement would short-circuit what
seemed to be an increasing problem. Expanding
businesses within the region were actually motivated to move across municipal
lines, because it was expected that they could get incentives to move or, when
those incentives were put on the table, they’d get an incentive offer to stay where
they were.
Welch worked to convince mayors that it was a counterproductive and unnecessary exercise to incentivize moves that were going to happen regardless. It was a losing proposition for each city and the region, he argued. It diverted resources, time, and attention that should have been spent on bringing in businesses from outside the region, a business that would result in a net gain in employment and population for the region.
Do your Homework
While the initial report included
a description of the Denver area’s no-poaching Code of Ethics, the Community Foundation
provided Welch and the other mayors with additional research support. They
helped locate five other similar agreements from around the country and arranged
phone conferences between mayors and the individuals in Denver who were involved
in crafting the no-poaching agreement there. The mayor of Birmingham provided a
staff member’s assistance with the drafting process.
Welch began circulating drafts, and with the other
mayors’ input, they moved toward mutually agreeable language. And they came up
with a catchy name: “The Good Neighbor Pledge.”
Declare Victory
Eventually, 23 cities agreed to sign on, including the eight largest. In sum, the signatories represent about 85 percent of the county population. Even though three sizable suburbs — Irondale, Fultondale, and Gardendale — declined to sign, the “coalition of the willing” moved ahead.
The mayors gathered at the Jefferson County Courthouse to formally sign the agreement with the Jefferson County Commission looking on. The event drew favorable press coverage and continues to inspire further conversation about additional cooperative ventures.
Success Begets Success
The Good Neighbor Pledge is not a
legally binding agreement. It doesn’t have “teeth.”
The mayors are still working on a dispute resolution process that could handle conflicts over the Good Neighbor Pledge if they were to occur.
Going forward, the mayors have discussed increased cooperation on 9-1-1 services. They’ve also discussed creating a comprehensive countywide or even regional listing of available office and commercial space and industrial parks.
Regardless of what is next, it is hoped that the mayors have taken a step toward communication and cooperation in a local landscape that has traditionally been marred by distrust and competition. And they continue to look out for self-interested opportunities to help improve conditions for all.
Local Government 3.0
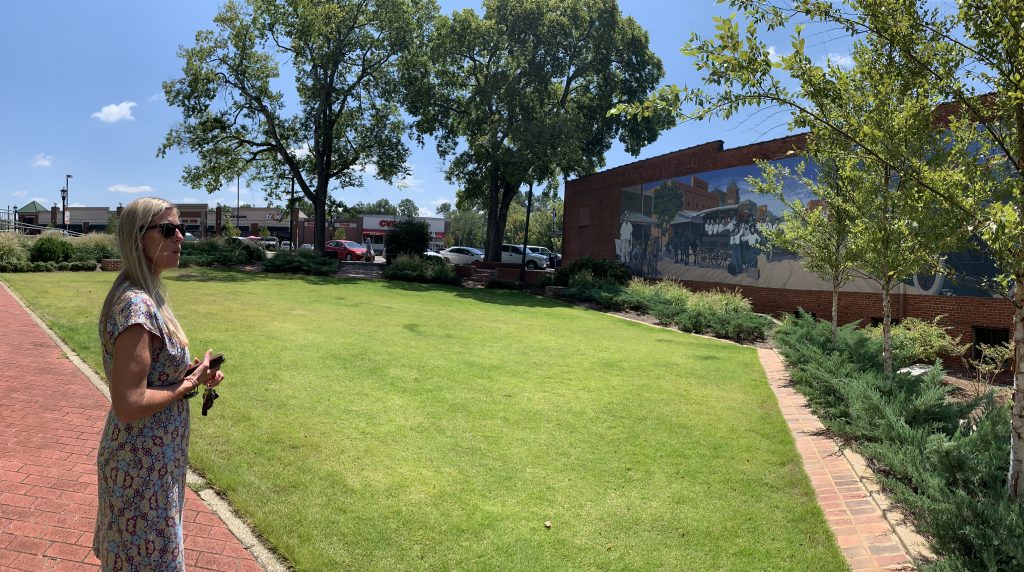
Montevallo Mayor Hollie Cost explains the function of Owl’s Cove Park, a part of the broader downtown revitalization and partnership project with Shelby County and the University of Montevallo.
The following feature, which describes an alliance between the City of Montevallo, The University of Montevallo (UM), and Shelby County, marks the launch of an occasional series on creative cooperation between governments and other civic partners. Through the series, we hope to identify, share, and spread best practices and lessons learned.
Why We’re Writing This
Neighboring communities are inextricably linked in metropolitan or regional economies. Traditional ways of operating can lead to siloed thinking, inefficiencies, and, in some cases, counterproductive competition. Increasingly, neighboring governments and agencies are looking for ways to partner to achieve common interests. In recent years, PARCA has engaged in studying issues of municipal fragmentation and efforts to overcome its effects through cooperation among local governments in Greater Birmingham and in north Alabama’s Shoals region.
In April 2019, Greater Birmingham saw progress on cooperation with the crafting and signing of a Good Neighbor Pledge by members of the Jefferson County Mayors’ Association. Developed with the support of the Community Foundation of Greater Birmingham, the Pledge seeks to increase trust and prevent incentive bidding wars between local municipalities over business relocations.
Meanwhile, the Committee for A Greater Shoals used PARCA’s report on its local government landscape to launch an array of civic improvement working groups, involving hundreds of citizens. Those working groups have now identified opportunities for further progress on intergovernmental cooperation, joint efforts on tourism, digital infrastructure upgrades, and increasing investment in higher education and training.
Montevallo’s Shared Investment in Shared Vision
Cooperative efforts in Montevallo between the county, the city, and the university which have been brewing for a decade, have in recent year produced a significant transformation.
For most of its history, Montevallo (current population 6,674) has been a trading center for the surrounding area. Area residents have worked at the university and local schools, in some small-scale manufacturing, in coal mining, timber, and in farming. If you visited Montevallo about a decade ago, you would find a typical Alabama small-town downtown, going through the usual struggles such towns face as retail and travel patterns shift to Interstate corridors.
Meanwhile, the university was something of a separate bubble. Founded in 1896, as the Alabama Girls’ Industrial School, the school grew into a respected college for women, and, after going co-ed in the 1950s, was re-christened the University of Montevallo in 1969. UM evolved into an unusual school: a public college, but one with qualities of a private college, due to its small class sizes and liberal arts concentration. While the university was obviously important to the town as an employer, there was an odd sense of separation from the downtown, despite the fact the two were only a few short blocks apart. Students tended to commute rather than live and spend in town.
Now, the lines between town and campus are deliberately blurred. The small town with a small college is beginning to have the look and feel of a “college town,” a place where campus life and energy animates the town and the town embraces and enlivens the college.
A $4 million project for reconfiguring, landscaping and repaving Main Street has recently been completed.
The downtown is updated, with new signage, lighting, and sidewalks, plus a couple of pocket parks and new greenery. What had been a long-shuttered, modernist Alabama Power office building on Main Street has been transformed into the University of Montevallo on Main, a classroom building that draws students and professors off the campus and into town for at least some of their classes. Another Main Street storefront has been renovated to serve as the University of Montevallo Bookstore.
The view of Owl’s Cove pocket park and the University of Montevallo on Main in downtown Montevallo.
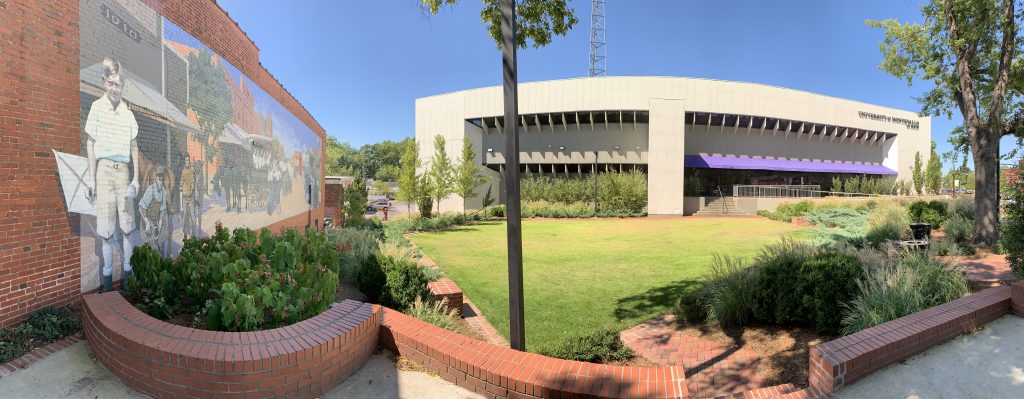
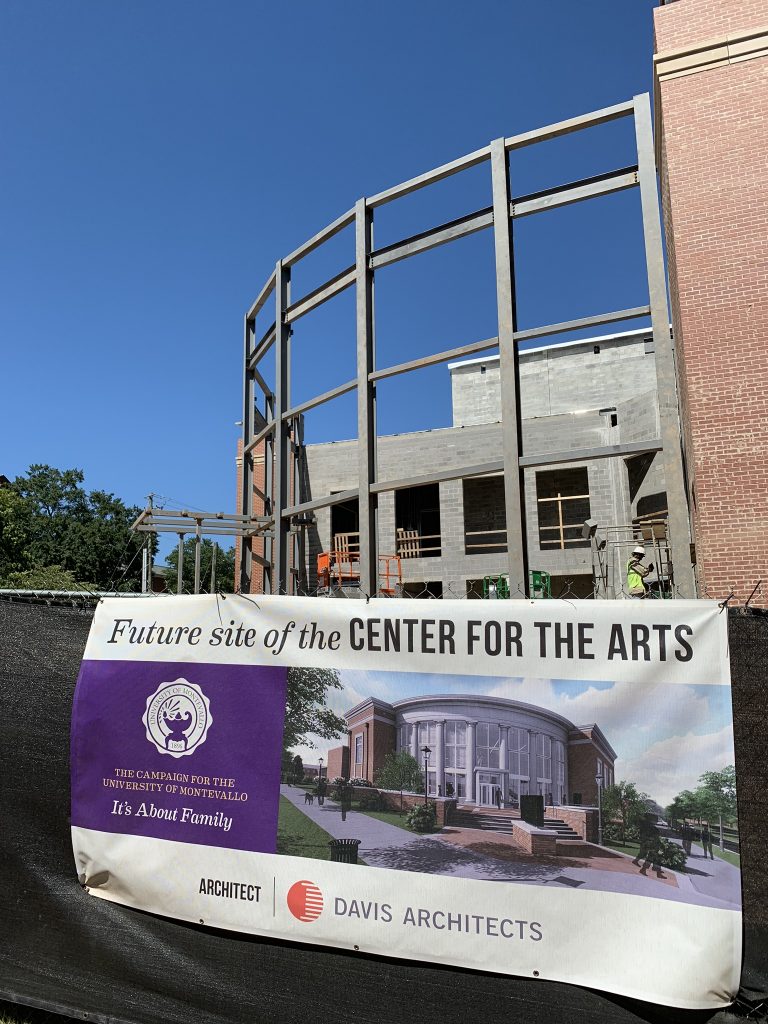
On the edge of campus closest to downtown, a $25 million, 36,000 square-foot Center for the Arts building is rising. According to the University, the Center will include a 350-seat theater with state-of-the-art acoustics and technology for music concerts and theater performances, a 100-seat black box theater, and a courtyard suitable for outdoor performances and receptions. The building is expected to build on UM’s traditionally strong arts and theatre program, while also serving as a venue for drawing events and competitions from K-12 schools throughout the year.
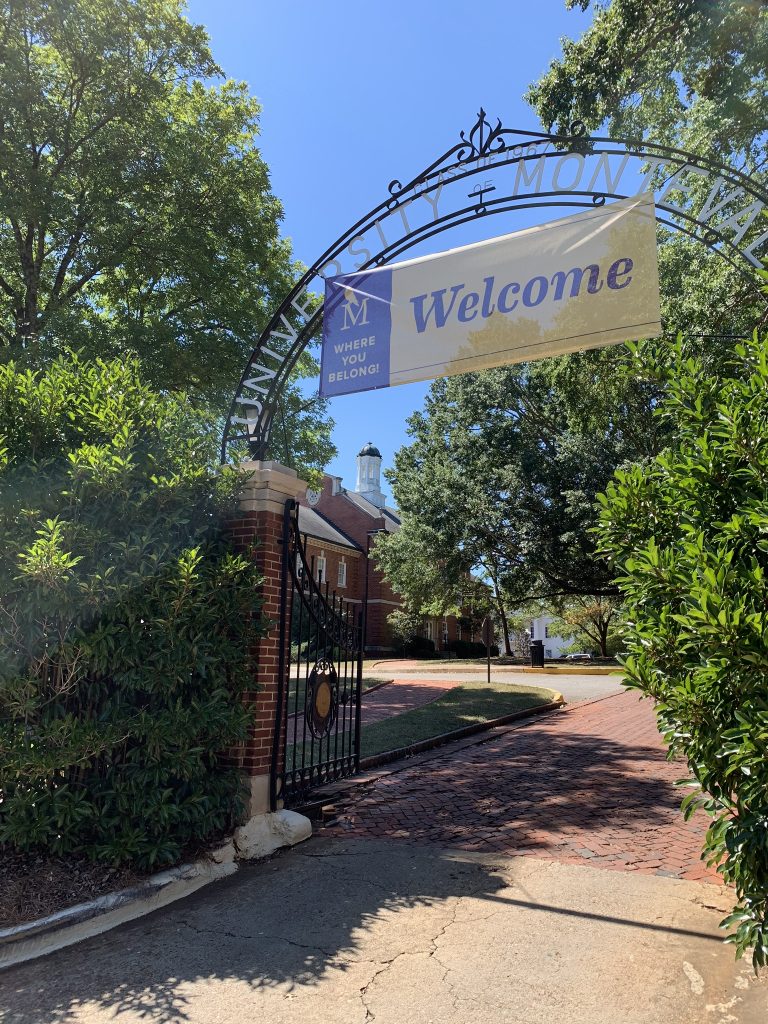
The blocks between downtown and the University of Montevallo campus have been reworked with sidewalks and landscaping, an inviting pedestrian connection. The wrought iron gates to the university are open wide, and from them, a University of Montevallo purple “Welcome” banner hangs.
A new $25 million University of Montevallo Center for the Arts is rising at the edge of campus near downtown.
New sports venues have been added, strategically placed to intermix the college and the town. A new women’s softball field was built on city property across Main Street, adjacent to K-12 schools and the public library. Meanwhile, the school’s running track, developed with investment from the county, is open for use by the Montevallo public.
Blurring the Lines between Town and Campus
This mixing of university and town life is deliberate. It flows out of a strategy developed by the partners to bolster the University of Montevallo, the town’s biggest asset and one of the largest employers in Shelby County, and to build it into a more productive engine for the town’s economy and culture.
Big employers are valuable in Shelby County. The county is one the most affluent and fastest-growing in the state, but about half its residents work outside the county. UM employs almost 500 full-time employees with gross wages for non-student employees totaling $29.35 million in 2018. Campus and dining operations employ another 70, approximately 40 full-time, with gross wages of around $1.5 million.
Even before the three-way collaboration came about, Shelby County, recognizing the strategic importance of the University, began investing lodging tax revenue in University projects that would help the university recruit and retain students. Shelby County uses its lodging tax revenue to promote tourism and economic development. In those investments, the county looked for projects that would provide benefit to the local community as well.
A comprehensive plan for the City of Montevallo, developed in 2008, sketched a vision of a revitalized downtown, complete with interconnection to the University. However, progress toward realizing that vision began in earnest in 2012, with the City’s passage of a 1 cent sales tax and with the formation of a Montevallo Development Cooperative District (MDCD). Organized as a Capital Improvement Cooperative District under AL Code § 11-99B (2016), MDCD is a partnership between the city, the county, and university. MDCD can act like a corporation. It can buy, sell, or lease property, and enter into contracts.
The City of Montevallo pledged 90 percent of the revenue from that 1 cent tax to the MDCD, which, in turn, used that pledged revenue stream to issue $5 million in bonds. Overall, the city has invested about $6 million through the MDCD, about $1.75 million in joint projects and $4.25 million in city projects including paving, relandscaping, and the construction of a new city hall. Both within and outside the MDCD, the county has invested $4.5 million with another $900,000 pledged for projects now underway. Meanwhile, the University of Montevallo is providing $21.7 million of the funding needed for the new Fine Arts Center and has invested more than $1.1 million in other projects with MCDC and the county. Investment by local partners on transportation projects also drew in close to $5 million in federal funding.
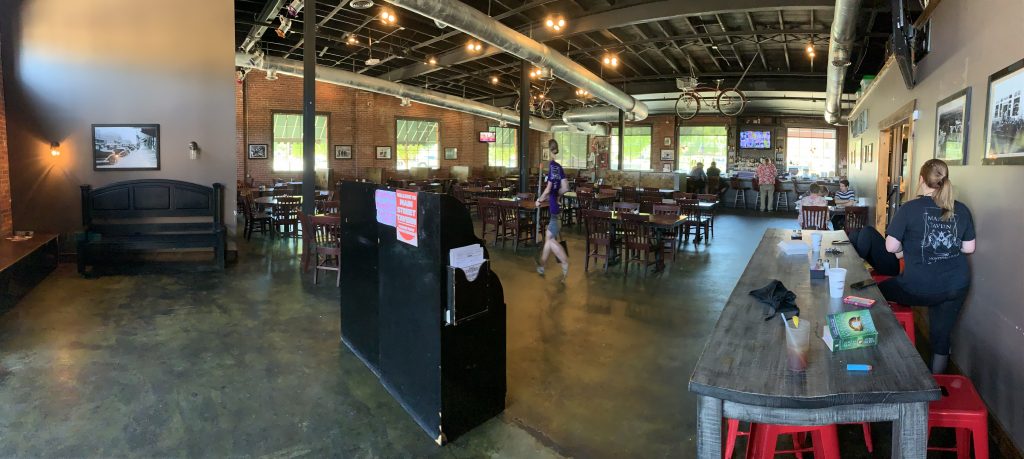
Not every project flows through the MDCD and not every MDCD project involves more than one partner, but the District keeps communication constant between the partners, and when one or more of the partners want to engage in a joint venture, the mechanism is there and waiting. It also serves as a vehicle for operating ongoing cooperative ventures like the jointly-owned buildings Montevallo on Main and The Main Street Tavern, another MDCD-restored building now leased to a restaurant.
Main Street Tavern operates in a building restored and leased out by the MCCD.
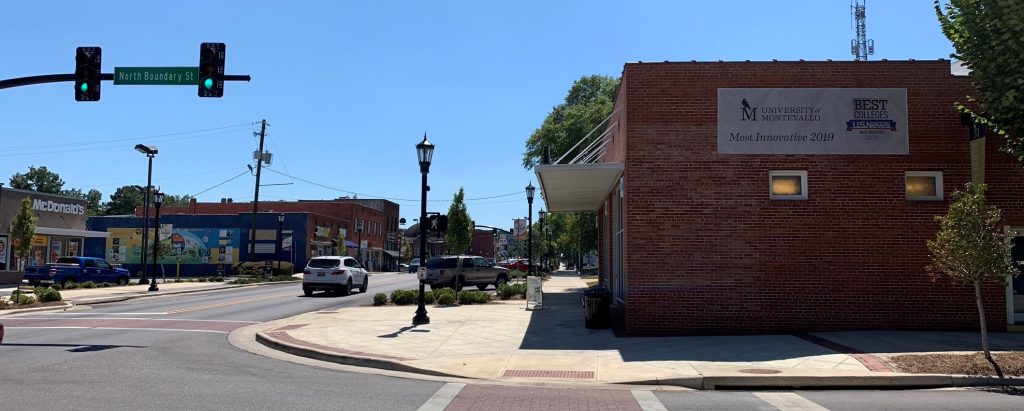
The public investment has spurred private interest and investment. A Montevallo chapter of Main Street Alabama has been formed, supported by local businesses. That group has spearheaded a grant program that has repainted building facades in the historic core of storefronts. Some of those storefronts are occupied with businesses new and old, and some are in the midst of cleaning or restoration. They share Main Street with chain stores like McDonald’s, KFC, Taco Bell, and CVS, but the chains have new urban signage and design, which blend better with the appearance of the historic core.
Dee Woodham, a former Montevallo councilwoman who continues to serve as Montevallo’s representative to the MDCD, said the vision for a revitalized college-oriented Montevallo formed over a decade ago, but it was not until the county, the city and the university joined together and committed resources to the vision that things started to happen. “This is an impactful way of doing nice things in a small town,” she said.
Challenges
The investments made at UM and in Montevallo are not just feel good improvements. They are strategic responses to challenges. All parties recognize that the University of Montevallo has been, and will be, facing stiff competitive headwinds.
In the early 2000s, the University of Alabama launched an aggressive effort to grow its enrollment from 20,000 to its current total of over 38,500. Colleges and universities across Alabama felt the effects of UA’s well-resourced recruitment efforts, sparking increased competition for in-state students.
And because the rising generation is smaller and because the state hasn’t seen much in-migration, the pool of in-state, college-age students has been relatively constant and may actually decline in coming years.
While the University of Montevallo’s historic dedication to the liberal arts is a selling point, the current fashion in higher education, considering the cost of college, is to emphasize programs that more obviously and directly lead to careers. UM’s annual tuition and fees of over $13,000 are the highest among Alabama public colleges. However, its 13 to 1 student to faculty ratio is lower than any Alabama public college, and its tuition is lower than the private liberal arts colleges with whom it competes.
The University’s current enrollment of about 2,600 is down from about 3,000 several years ago.
With pleasantly landscaped promenades now connecting downtown and campus, the walk between the two is much more inviting.
Responding to Challenges
As a recruitment tool and to broaden its appeal, the University is adding sports teams, with the county aiding in that investment. The county helped develop the lacrosse field, allowing UM, which participates in NCAA Division II athletics, to become the second public university in Alabama to offer men’s and women’s lacrosse. That’s a draw for both in-state and out-of-state students who want to continue playing in college and don’t have many options in the Deep South.
The county also helped with the construction of a stadium for women’s softball, which was built on land provided by the City of Montevallo.
The University has also expanded other sports offerings hoping to attract scholar-athletes. It added a swimming team, taking advantage of an existing Olympic-sized pool at the student center.
On the slightly offbeat note, UM has a nationally-ranked collegiate bass fishing team, taking advantage of Montevallo’s proximity to the fertile lakes of the Coosa chain. UM also added an “Outdoor Scholars” program to showcase its proximity to the Black Belt’s fishing and hunting grounds.
And starting this fall, UM will field a competitive eSports team, with the aim of recruiting students who are interested in electronic gaming, in particular, a game called, League of Legends.
While UM’s investments haven’t yet produced a surge in enrollment, the University believes it has positioned itself for growth through its recruitment efforts, expansion of sports, and other investments like the Fine Arts Center and a new home for its School of Business. And the joint investments with the city have created an atmosphere more conducive to having students who will enroll in and live in Montevallo rather than commute.
Defining Goals and Expectations
For the partnership to thrive, all parties agreed that it was important to spell out their objectives, define the organizational structure, operate transparently, and come to a written understanding of expectations. The Shelby County Commission’s detailed resolution that endorsed the partnership describes underlying motivations and history of the partnership. Together, the parties agreed to articles of incorporation. Another practice followed by Shelby County when it commits to joint ventures is a performance contract, like the one adopted by Shelby County and the UM as a condition of the county’s support for the new fine arts center.
The county agrees to provide up to $1.2 million over seven years to support the project in order to aid the University’s recruitment and retention of students and the attraction of visitors to the community. But that contribution is conditioned on UM developing a schedule of events, performances, conventions, and competitions, targeting not only university students but also high school and middle school students. The University agrees to set goals for attendance, track it, and report back its results. UM has already laid out a draft calendar of more than a dozen proposed events each year through 2025. Depending on how well UM does in meeting performance expectations, the Shelby County Commission can decide to accelerate, slow down, or terminate its support to the project.
The MDCD has three members, one appointed by each entity. Within the parameters set out for it by its authorizing bodies, MDCD can operate more nimbly than a government. However, in MDCD’s case, the District functions as a public body under the open meetings law. Advance notice of meetings are posted. Decision-making takes place in public meetings. Minutes are taken and published on the web, as are financial reports and audits.
Caveats
While collaboration has clear advantages, it is not without risks.
In any partnership, questions can arise over whose interests are being served. For example, some townspeople worry that the town’s relationship with the university is too close. The mayor and two council members are university employees. A third council member is married to a university employee.
Janice Seamon, a Montevallo realtor involved in historical preservation causes, said cooperation is important and has produced positive, tangible results. But in her opinion, in any town, if the largest employer directly or indirectly employs the majority of the council, that has the potential to create conflict. “Having the major employer in control of city government is not good practice,” Seamon said.
Also, one of the virtues of the MDCD — its nimbleness and lack of bureaucratic structure — can lead to questions about accountability. Montevallo Councilman Rusty Nix points out that many of the projects that have run through MDCD are really city projects and don’t involve the other partners. Why, he asks, are these public expenditures run through MDCD, an alternative body on which the city’s representative is not an elected official? Why aren’t at least those solo projects reviewed for approval by the elected City Council?
Woodham, the former councilwoman and the current City of Montevallo representation to the MDCD, acknowledged that the potential for a conflict of interest exists with university employees serving on the council, but at the same time the town needs the interest and input from the university community. Woodham thinks that so far officials have been able to pursue mutually beneficial projects under terms fair to all parties. Ultimately, voters will pass judgment on that.
As for her representation of the city on MDCD despite no longer being an elected official, that’s up to the city council. Neither the county nor the university representatives are elected, but all are accountable to their appointing authority.
Measuring Success
The partnership effort of the county, the university, and the city has already achieved undeniable results. Time will tell to what extent success will fully flower.
The City of Montevallo is showing population and revenue growth, above and beyond the extra revenue produced by the increased sales tax rate. The accumulation of improvements is creating a sense of new possibilities. There are still vacant storefronts to fill, but almost two dozen new businesses have opened in the past three years, including a bakery, a bar, a cake and coffee shop, a Taco Bell, and a popsicle shop. Coming later this fall, Slice Pizza plans to open in Montevallo, its third location in the metro area.
At the same time, the aggressive changes at the University of Montevallo have not yet yielded a surge in enrollment. UM is well short of its Fall 2019 goal of 3,000 undergraduates. Officials hope that as the new sports teams become established and as UM’s new full-time student recruiters in Georgia and Tennessee spread the word, interest and enrollment will gather steam and the investments made by the partners will pay long-term dividends for all parties.
This partnership may be a model that other colleges and communities in our state can explore.
Population Change in Alabama Cities 2018
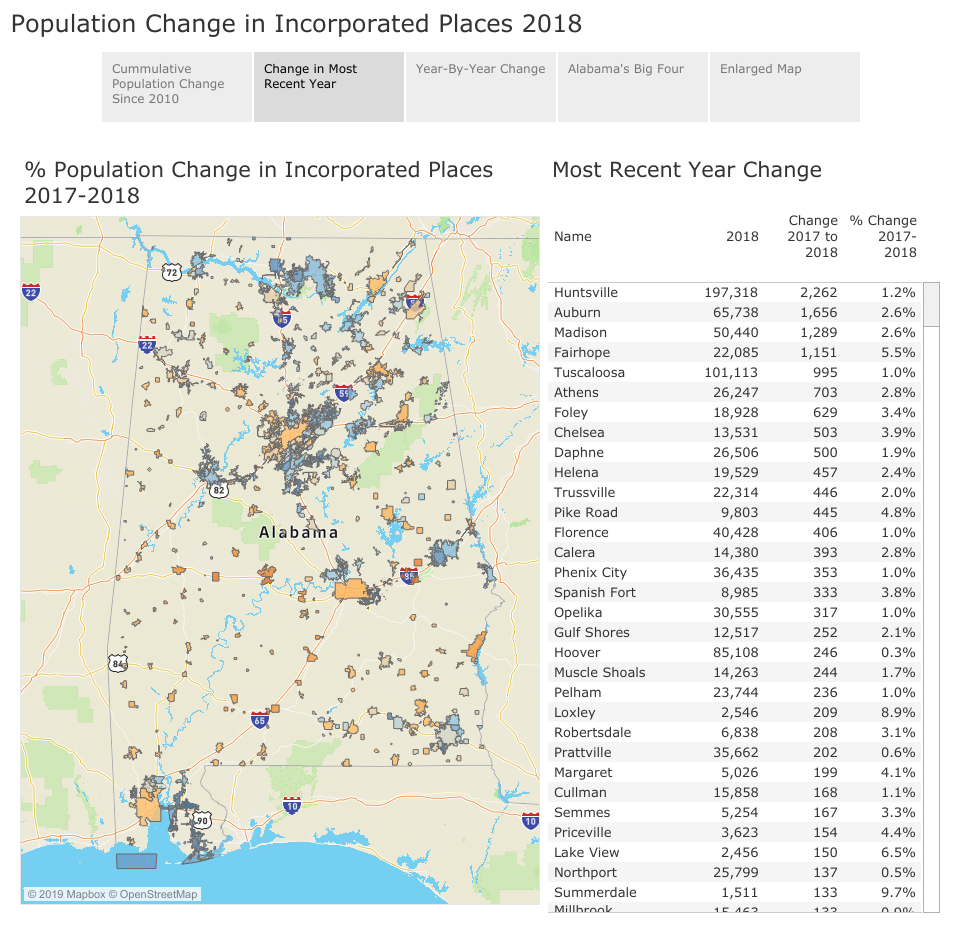
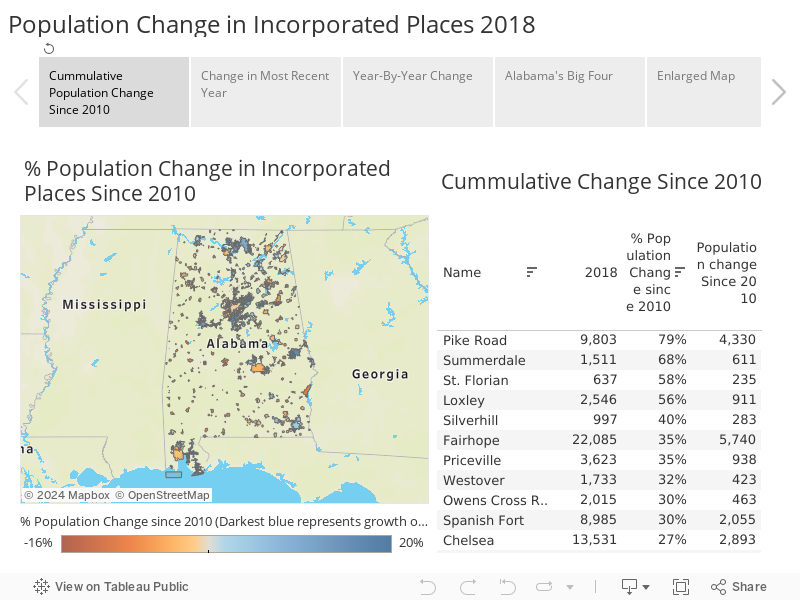
Huntsville continues its trajectory towards becoming Alabama’s largest city, while Birmingham, Montgomery, and Mobile continue to drift lower, according to the most recent city population estimates released by The Census Bureau. The two major college towns Auburn and Tuscaloosa continue to grow, as do several cities in Baldwin County.
The new estimates cover the time period between July 1, 2017, and July 1, 2018, and also look back to 2010, the year of the last official Census. Data from the same time period has already been released for state level, metro areas, and counties, and PARCA has published analyses and interactive tools exploring that data. The new cities data is below. Use zoom and drag tools to explore a particular area. Use the button in the bottom right corner if you want a full-screen display.
Huntsville and North Alabama
The city of Huntsville added more residents than any other Alabama city with an estimated 2,262 gain in 2018. If current trends continue, Huntsville (197,318) will surpass Birmingham (209,880) as Alabama’s largest city within the next several years. However, Birmingham’s metropolitan area population (1,151,801) is more than twice as large as Huntsville’s MSA (462, 693).
The Huntsville suburb of Madison ranked third in numeric gain adding 1,289. Huntsville has avoided the dilemma faced by many center cities: becoming hemmed in by and losing population to newer suburbs. In fact, Huntsville, through strategic annexation, has now completely surrounded Madison. While Madison can continue to add residents in its current footprint, it will not be able to spread out by annexing contiguous territory.
Though Madison County cities are capturing most of the North Alabama growth, nearby Athens in Limestone County appears to be receiving some of that inflow. In the farther reaches of the Huntsville orbit, Florence and Muscle Shoals had bigger gains in population in 2018 than in any year other in the decade.
Birmingham Area
In the Birmingham metro area, the core city of Birmingham was estimated to have lost over 1,000 residents between 2017 and 2018. Birmingham has bobbed up and down through the decade, but this most recent year saw the steepest decline.
However, there is population growth south and east of the core city, and the most recent estimates indicate that growth is shifting to suburbs farther south. In the most recent year, the suburbs immediately south of core city, Homewood and Mountain Brook show slight population losses, and Vestavia a slight gain. Hoover, while it did add 246 residents, is growing more slowly now than smaller cities to the south like Chelsea (+503), Helena (+457), and Calera (+393). Meanwhile, to the east of Birmingham, Trussville added 446 residents, according to the estimates.
Montgomery Area
The estimates show Montgomery losing 1,674 residents in 2018, while its emerging suburb of Pike Road gained 445. Suburbs to the north, like Prattville (+202), Millbrook (+133), and Wetumpka (+37) saw gains, but the Montgomery metro area as a whole has seen a population outflow.
Some of the population loss in the Montgomery area may be due to the strong growth being seen in Lee County, home to Auburn University. A separate Census survey tracks residential migration across county lines. A look at that data reveals that Elmore County had a net loss of 352 residents to Lee County. Nearby Tallapoosa and Macon County, which are not officially part of the Montgomery metro area, are also losing residents to Lee County.
Meanwhile, Lee County’s two larger cities have been among the state’s biggest gainers in population, according to the estimates. Auburn is second to Huntsville in numerical gain, having added an estimated 12,000 residents since 2010. Over the same period, Opelika ranks No. 10 in the state with an estimated gain of 4,000.
Mobile Area
The 2018 estimates have the City of Mobile declining in population by 953 residents. Census estimates the city has lost about 5,000 people since 2010. Some nearby communities in Mobile County like Semmes and Saraland have gained population over the past decade, but the growth in those communities isn’t enough to offset Mobile’s population loss. One might assume that the rapid growth just across the bridge in Baldwin County is being fed by residents moving out of Mobile. However, other Census data sets indicate that isn’t necessarily the case. While there is some movement from Mobile to Baldwin County, there is also a considerable residential movement back and forth between Baldwin County to Mobile. When moves to and from the county in question are accounted for, Jefferson County had a net gain of about 500 people from Mobile County, compared to a gain for Baldwin of about 250.
Other Urban Centers and the Rest of the State
Like Auburn and Opelika, Tuscaloosa and Northport both continue to grow, though at a slower pace than the rival towns to the east. Tuscaloosa remains substantially larger than Auburn, about 100,000 vs 65,000. Opelika is larger than Northport: about 30,000 vs. 25,000.
As mentioned, Florence and Muscle Shoals showed slight growth in 2018, according to the estimates, as did Phenix City. Dothan was flat, and Anniston and Gadsden both experienced net out-migration.
A scattering of smaller towns in northeast Alabama and southeast Alabama showed population growth. However, most smaller cities in rural counties lost population. Selma was particularly hard hit, with a net loss of almost 500 people in 2018. Since 2018, Census estimates Selma’s population has declined by 2,898 dropping from around 20,000 down to 17,000, a 14 percent population decline. Small towns in Black Belt counties, cities like Tuskegee, Eufaula, and Demopolis, continue to experience population declines, but so do towns in east central and northwest Alabama like Jasper, Alexander City, and Sylacauga.
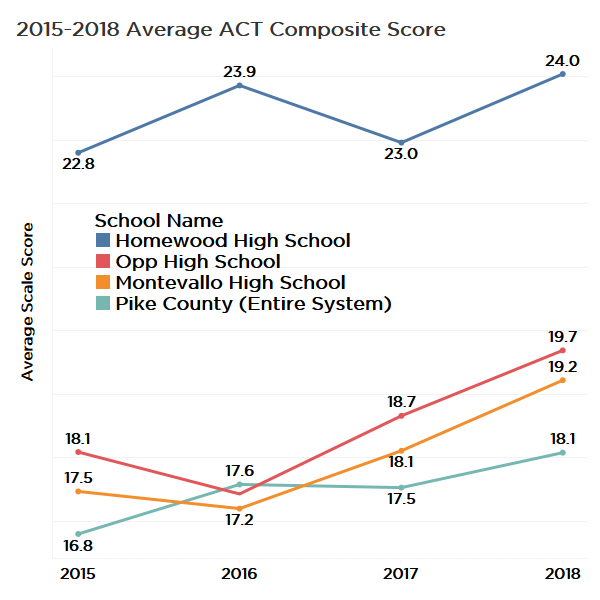
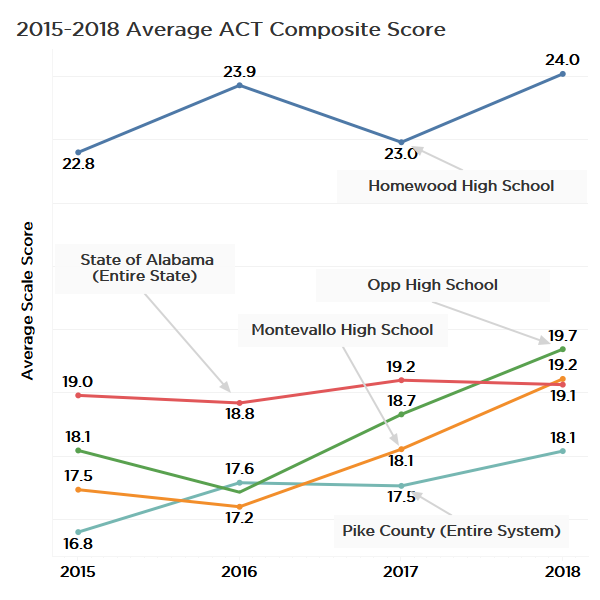
Practices of Top Gaining Schools on the ACT
After publishing ACT results for the graduating Class of 2018, PARCA contacted several of the schools and systems in Alabama that showed the largest improvement in average composite ACT scores between 2015 and 2018. PARCA wanted to know what, if anything, the schools did, either specifically for the ACT or in general, to improve students’ college readiness levels.
We received responses from the Pike County School System, from Montevallo High School, Opp High School, and Homewood High School and System.
The schools are across the spectrum when it comes to the economic composition of the student body. Using the percentage of students qualifying for a free school lunch as a measure of economic disadvantage, Homewood (20 percent) and Opp (41 percent) have lower levels of economic disadvantage than the state average (46 percent). Meanwhile, Montevallo High School (54 percent) and the Pike County School System (73 percent) have a higher percentage of disadvantaged students than the state at large. In terms of per-pupil spending, Homewood and Pike County are in the top 20 in per-student funding, while Opp and Shelby County are closer to, but still above, the state average.
Statewide, the average composite score has been basically flat since 2015, rising from 19 to 19.1 in 2018. That tenth-of-a-point gain statewide contrasts with improvements at the responding schools of between 1.2 and 1.7 points on a 36-point scale.
In response to PARCA’s query, school officials described the factors that they believe led to improvement. These are only observations and no underlying studies were performed to prove a cause and effect. However, the approaches described, while not uniform, had common characteristics that have been shown by educational research to lead to improved student performance.
Common Approaches
While the details varied amongst the responding schools, the common themes would not come as a surprise to anyone familiar with education research:
Setting high expectations for all students.
Focusing on the delivery of strategic, high quality, standards-based instruction, not teaching the test.
Monitoring of student progress, providing aid for students who struggle and resources for students who want an additional challenge.
Teaching students to a level of depth expected at the college level, a level that goes deeper than recalling facts.
Emphasizing to students the importance of the ACT and providing access to ACT preparation materials and courses.
Critical Thinking Skills
While all four respondents, to varying degrees, provided targeted preparation for the ACT itself, all emphasized that the real foundation for success was an across the board dedication to a robust standards-based approach to instruction, an approach that challenged students to think beyond surface level of recall of facts, dates, and formulas, and to develop a depth of knowledge and the ability to apply what they learned.
Engaged Faculty
All four viewed the adoption of the Alabama College and Career Ready Standards, standards that included input from the nationally-aligned Common Core standards, were a positive development. The adoption of the new standards provided each system an opportunity to engage faculty in a deep review of what should be taught at each grade level and whether the school curriculum was aligned with the standards. Professional development was provided to ensure teachers were prepared to deliver the content and level of depth called for in the standards.
College-Level Courses
Both Homewood and Opp pointed to the high quality of Advanced Placement (AP) courses. Both systems have added courses and increased access to AP, which are college-level classes delivered in high school. School officials said the high-quality course content and the training teachers receive in order to teach AP classes results into a richer experience for students. That experience prepares them for the more complex level of thinking required to perform well on the ACT. The ACT is, after all, a test that seeks to measure student readiness for college-level work, and AP courses are designed to reflect college-level learning. Homewood emphasized that AP classes at Homewood are open-enrollment rather than selective. Their enrollment continues to grow, as do success rates on the AP test.
Pike County has adopted a different strategy for exposing students to college-level coursework: send them to college. Pike County will have 24 seniors graduating this year with over 60 hours of college credit earned at Troy University or through community college programs. That means those students enroll with enough credit to have earned an associate degree and plenty of experience with college-level work. Beyond the quantifiable results produced for students, the system is spending more efficiently, according to Pike County Superintendent Mark Bazzell. In a small school system, it is difficult to generate the numbers of students participating in AP offerings to justify the investment, especially when college-level courses are already available in the community at the local colleges. Because some national ranking systems look at AP participation as a marker of quality sometimes Pike County receives lower rankings than it deserves considering the opportunities it provides students through the dual enrollment option.
Below are observations from each school or system.
Pike County System
The Pike County School System continues to exceed expectations and draw attention with its attitude of high expectations, no excuses, and its methodical and creative approach to improving outcomes for students. Pike County has been featured in two Business Education Alliance (BEA) reports, Exceeding Expectations (2016) for exceptional performance on the ACT Aspire and in Leadership Matters(2018) for the system’s innovative approaches to improving college and career readiness. PARCA authored those reports, with support and consultation from A+ Education Partnership.
Pike County’s superintendent began the path to the current level of success more a decade ago. When he took over as superintendent, he began a campaign to build a faculty that uniformly believed that all children were capable of high performance. The second step was helping the faculty understand what students needed to know according to the national standards and providing teachers with the training in how to effectively teach those standards.
Bazzell found ACT Aspire, ACT’s suite of standardized tests for elementary and middle school students, to be a valuable tool for accessing student progress. The State used Aspire as its standardized test for accountability purposes but dropped it before the 2018 school year. Pike County now pays on its own for Aspire and uses data from the test to inform instruction. Continuing to use the Aspire exposes Pike County students early and often to ACT-designed standardized test, a test that predicts achievement levels on the actual ACT college readiness test.
Considering its level of student economic disadvantage, Pike County now generates consistent high performance. Bazzell provided the most detail on specific ACT preparation measures the two high schools in the system have adopted.
Encouraged students to start taking ACT earlier (9th grade)
Increased awareness of the importance of ACT through posters in the hallway, data analysis with students, parent meetings, etc.
Teachers’ use of bell ringers (quick questions to open class) that are aligned with ACT questions
Implemented Saturday ACT study sessions with content-area teachers
Utilized a Discovery Block (time set aside during day) for ACT and PreACT practice, with a schedule that rotated by content area
Utilized actcademy.org to create individual study paths based on a student’s PreACT score.
Encouraged students to put various ACT prep Apps on their phones and use them during free time at school and at home
Included ACT prep materials into a Southern Research Education Board-designed college readiness course, which is now mandatory for students who score lower than a 19 on the ACT
Montevallo High School Principal Brandon Turner, who arrived at Montevallo in 2015, emphasized that his faculty and staff function as a team. Learning targets are set by subject and grade level and formative assessments are administered to track student progress toward the targets.
Turner said a central emphasis for the school is improving instruction and adding depth of knowledge. There is a concept in education called the four levels of knowledge. The first is simple recall, the second level is connecting facts together as concepts or patterns. The third level, strategic thinking, applies concepts learned to novel situations, and the fourth level of knowledge is demonstrating the ability to draw from multiple sources to identify problems and construct solutions.
Questions on the ACT often go beyond recall, simple connections between points of data, and challenge students to think about the bigger picture.
“The depth of knowledge has to be embedded in all your classes,” Turner said. “If we aren’t practicing those things, they won’t succeed.”
Montevallo also offers a guided practice period during lunch that juniors are able to take advantage of, and the week before the administration of the ACT, all the junior classes focus on preparing for the test.
Opp High School, Opp City System
Standards and Active Learning
When Alabama adopted new learning standards, the Opp City System made a systemwide concerted effort to support teachers in understanding and teaching the standards. And it paid off. Opp was featured in 2016’s Exceeding Expectations report for showing the most improvement in math on the ACT Aspire.
Principal Aaron Hightower said the high school continues to focus on teaching that is grounded in learning standards and objectives but is also challenging teachers to innovate in how they teach in order to keep students engaged. For example, teachers at Opp Hike School are encouraged to compress lectures into the first 20 minutes of class and assign group projects to work on for the remainder of the period.
Faculty collaboration
The faculty coordinates across grade level so each grade level subject matter team builds on what has been taught in the previous year and prepares students for the next year.
Course Rigor
For Opp, AP courses have been especially beneficial in increasing the rigor and quality of courses. And, according to Hightower, all courses are supposed to challenge students to think beyond surface level learning.
Diagnostic Tools
To make sure all students stay on pace, Opp uses a diagnostic tool called Edmentum, which measures student skill level and identifies specific areas of weaknesses that need to be addressed. For struggling students, it then prescribes a personalized learning plan to address those weaknesses.
ACT Specific Preparation and Incentives
Opp started offering the PreACT to 10th graders the year before the State made it a requirement. That has allowed students to build familiarity with the kinds of questions the ACT asks.
And finally, to encourage all kids to put in the effort on the ACT, Opp offers incentives. If a student can document a two-point gain on the ACT, they qualify for a school trip to the new water park in Baldwin County.
“Now that creates a buzz,” Hightower said.
Homewood High School, Homewood City System
Instructional Leadership
As with the other responding schools and systems, Homewood school officials first pointed back to the fundamentals of preparation that put students in a position to succeed. Patrick Chappell, the system’s director of instructional support, pointed to the academic focus created in the system by each school in the system having an assistant principal for instruction. Those principals regularly meet with each other and with their faculties during embedded professional learning time to ensure educational continuity classroom to classroom.
Learning Targets
The system has teacher-developed learning targets for students, by grade and by subject. Those targets reflect but often exceed the state’s Alabama College and Career Ready Standards. Despite this tight definition of intended outcomes for students, Chappell said, teachers and students are given latitude on the style and pace of learning. They are not bound by pacing guides, for example. The emphasis is on mastery of standards, not flying through every bit of material.
AP Courses
Homewood offers an array of AP classes and, in recent years, has seen a continuing rise in the number of students and the percentage of students choosing to take those courses.
Teachers have received additional professional development to prepare for teaching AP classes, and the system also pays for students to take AP exams.
Access to AP classes is not restricted by GPA or participation in an “honors” program. Any student who wants the rigor and challenge of a college-level course can take AP classes. Even with the rising participation levels, the percentage of students earning a successful score on the AP exams continues to climb as well. With more students succeeding in college-level coursework, it stands to reason that ACT College readiness rates would rise as well.
Credit Recovery For Struggling Students
Students facing academic challenges have also received targeted attention through an enhanced credit recovery program, promoted by Homewood High School (HHS) principal Zack Barnes. Instead of simply issuing failing grades and having students repeat courses in summer school, the school directs students to online credit recovery programs that allow students to go back and address the specific standards they failed to master.
Test Taking Experience and ACT Prep
HHS Assistant Principal Amanda Esslinger added that Homewood pays for all 9-11 graders to take the PSAT, another college readiness test. This increases students’ comfort level with multiple standardized and timed tests. The multiple measures also create a greater awareness of each student’s strengths and areas of needed growth. That’s useful both to the individual student and to teachers and administrators evaluating the effectiveness of instruction.
Homewood offers an ACT prep class during the school day that any junior or senior can take, giving all students access to preparation that used to be only available to families who could pay for private courses.
Conclusion
Increasing student success on the ACT is important for individual students and can be an important measure of academic effectiveness for schools as well. Schools that generated improvement pointed to some measures that were directly aimed at the ACT such as raising student awareness of the importance of the test and providing access to ACT preparation resources. However, those schools and systems that improved first emphasized a commitment to delivering instruction that allows students to meet and exceeds expected standards of learning for their grade level. They also emphasized exposing all students to the deeper levels of learning expected for college level academic performance.