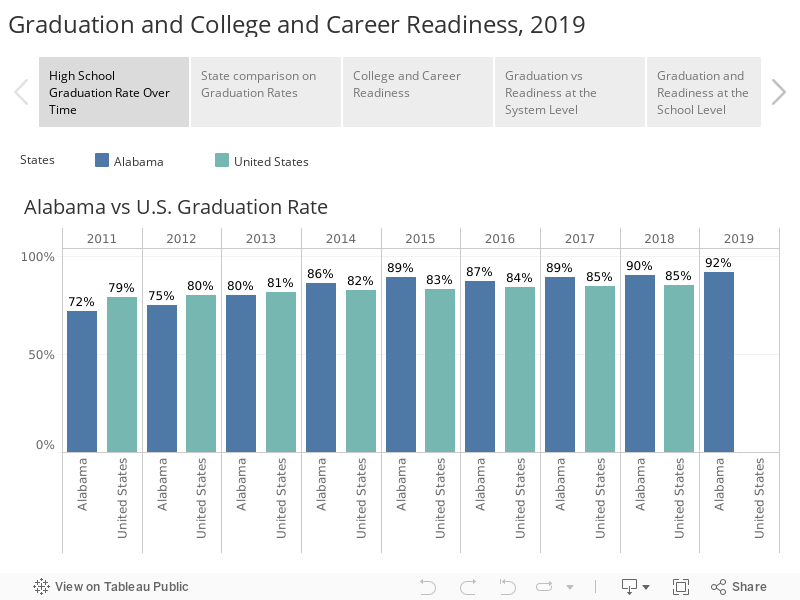
Alabama’s high school seniors of 2019 graduated at the highest rate the state has ever reported, 92%. And, a greater proportion of those students, 80%, were rated college and career ready than ever before. Search results for local systems and schools. Alabama’s reported high school graduation rate now ranks No. 7 among U.S. states.
The rapid rise in graduation and readiness is cause for celebration, but it also leads to questions.
- Are rising graduation and readiness rates due to academic progress or easier-to-meet standards?
- Do the established measures accurately gauge whether a student is ready for college or the workforce?
- Are some schools and students seeking out shortcuts to generate higher rates of readiness?
A high point and a moment for reflection
The high school graduation rate measures the number of ninth-grade students who earn a diploma four years later, the cohort graduation rate.
The graduation rates and readiness levels recorded in 2019 aren’t likely to be matched in the short term. Schools shutdown in March of 2020, and the semester was finished online. That potentially interfered with some seniors catching up on credits or earning the certifications or scores needed to graduate or achieve readiness. Some students likely fell behind in accumulating credits for graduation, certifications from Career Technical Education courses, and other markers of college and career readiness. The altered learning experiences brought on by the pandemic will likely have effects for the next several years.
So, considering this period of uncertainty for on-time graduation and college and career readiness rates, the state and its public schools have an opportunity to make sure both a high school diploma and college and career readiness are meaningful and credible measures of achievement, that the credentials earned by students are valuable and meaningful to colleges and employers.
How goals were set and met
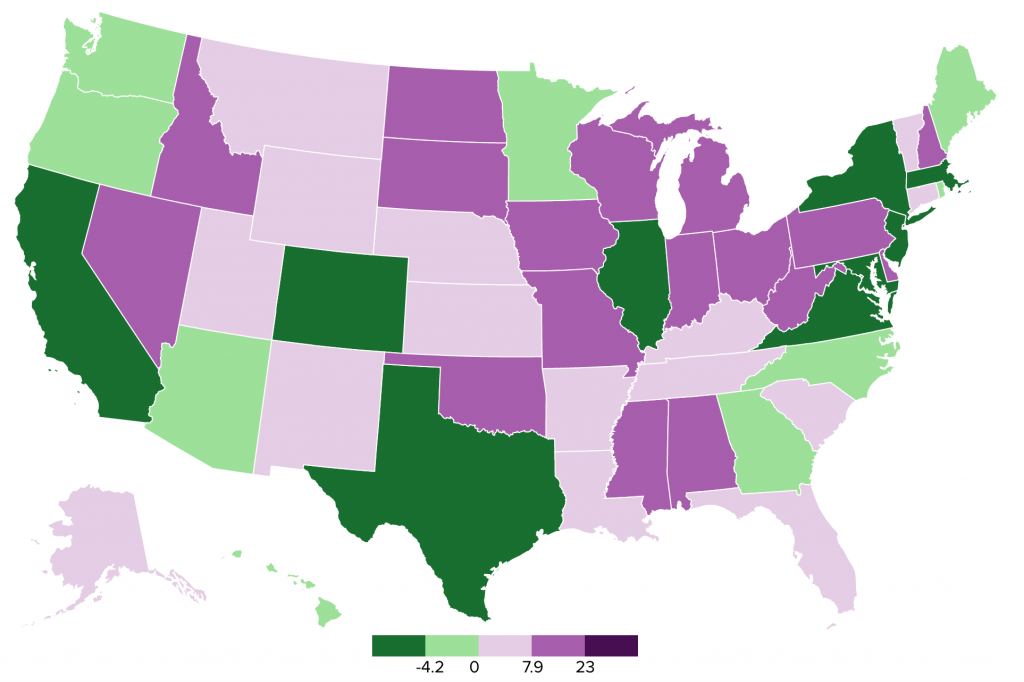
Alabama’s high school graduation rate has been on the rise since at least 2012. It has now topped the announced goal of 90%, set by the state plan for educational improvement, Plan 2020. By 2018, the most recent year for which national comparisons are available, Alabama’s high school graduation had risen 18 percentage points since 2011. Only Nevada’s graduation rate showed more improvement over the period.

The graduation rate’s rise coincided with several changes. First, the state’s graduation exam was scrapped. Second, alternative diplomas that had been available to special education students were eliminated and all completion pathways pointed to a regular high school diploma. Third, the state implemented a credit recovery system that allowed students who failed a course to continue working to master the material, rather than having them take the entire course again. And, finally, the graduation rate, and later the readiness rate, became an accountability measures, motivating faculty and administration to find ways to improve on those metrics.
As the graduation rate rose sharply, so did concern that schools were issuing diplomas to students who weren’t prepared for entry into the workforce or college. In 2018, then-State Superintendent Ed Richardson pointed to the wide gap between the graduation rate and the percentage of seniors who met the state’s definition of college and career-ready. For the class of 2016, for example, the graduation rate was 23 percentage points higher than the college and career readiness rate. Richardson called on schools to focus on closing that gap, demonstrating that graduates were ready.
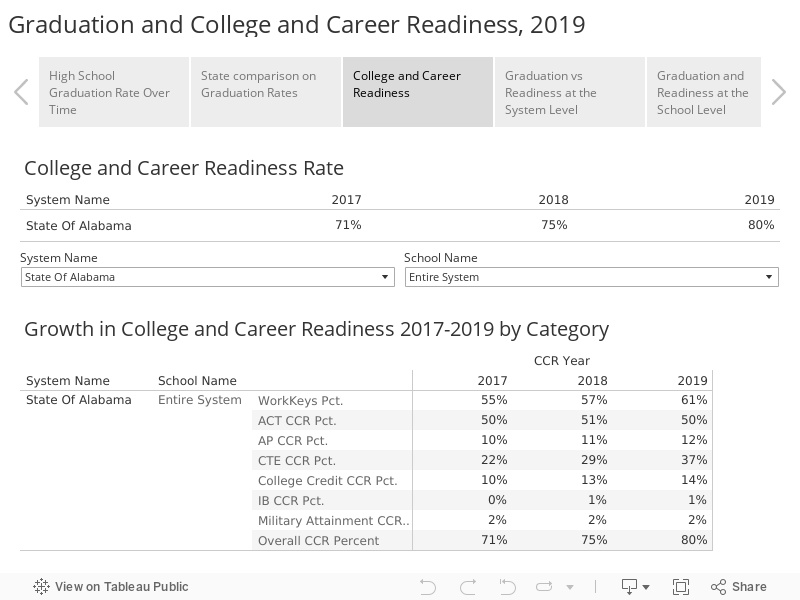
With the release of the 2019 numbers, the gap has closed to 12 percentage points, with 92% graduating and 80% of seniors demonstrating college and career readiness, according to the measures established by the Alabama State Board of Education.
How students are rated college and career ready
The Alabama Board of Education has adopted six ways for high school students to demonstrate that they are ready college and/or career ready.
- Score at or above the college-ready benchmark on at least one section of the ACT’s college readiness test
- Score Silver or above on ACT’s WorkKeys Assessment
- Earn a qualifying score on an Advanced Placement (AP) or International Baccalaureate (IB) test
- Earn College Credit through a dual enrollment course
- Earn an Industry Recognized Credential prepared for through a Career Technical Education (CTE) Course
- Pass the U.S. military’s test for enlistment
A detailed discussion of the individual measures follows, but progress on the measures can be summarized.
College-oriented measures of readiness haven’t improved much. ACT scores and the percentage of students passing them are flat.
The percentage of students earning Advanced Placement is up by 2 percentage points, correlating with the wider availability of courses.
College credit through dual enrollment, usually through community colleges, is up 4 percentage points. Some of those courses are academic and others are CTE classes.
On the other hand, workforce readiness measures have grown more steeply. That makes sense considering the increased emphasis on Career Technical Education in recent years.
Some of those large gains on the work-oriented measures will receive additional scrutiny in the future, as state officials work to ensure that the work credentials align with courses of study and available employment opportunities.
The chart below tracks the growth between 2018 and 2019 on the various readiness measures.
ACT
From 2017 to 2019, scores on the ACT, the widely known college entrance test, have remained flat among Alabama seniors. About half of students earn a benchmark score on one of the ACT subjects: English, reading, math, and science. Students are most likely to score at or above the benchmark in English, indicating that they are ready to take English 101 and pass. According to ACT, a student scoring at the benchmark has a 75% chance of making a C or better in a college-level course in that subject. The ACT is administered in the public schools in the junior year. However, a student can take the ACT before or after that and continue to take it to improve their score.
WorkKeys
ACT also produces a test of applied knowledge called WorkKeys. WorkKeys has been a growth area. In 2017, 55% of seniors scored high enough to be considered ready for the workforce. By 2019, that percentage had climbed to 61%.
WorkKeys is a test of reading, writing, and graphical comprehension as those skills might be used in the workplace. A student’s performance on the test can earn a certificate at one of four levels: bronze, silver, gold, or platinum. Students earning silver or above are considered ready for the workforce, demonstrating a level of skill required by 69% of jobs in ACT’s database of profiled jobs.
As schools have become more familiar with WorkKeys, some have instituted training sessions for the test, recognizing that some students may be better able to earn a qualifying score on WorkKeys than on the more academically-oriented ACT.
AP/IB
AP and IB courses and tests are designed to reflect college-level learning, both in course delivery and rigor. Alabama has steadily increased its investment in AP courses in particular, spreading these nationally-recognized and benchmarked courses and tests to more school systems. To demonstrate college readiness on this measure, a student has to score 3 or above on the end-of-the-year AP test. A score at that level can allow a student to claim college credit at many colleges.
The percentage of seniors earning a qualifying score through the AP test has increased, from 10% of seniors to 12%. Credit through IB, which is offered at far fewer schools, has also increased slightly.
Due to the pandemic, AP success is likely to be negatively affected. The shut down of school in the final weeks before the tests damaged preparation. The tests were offered, online, in modified form, but it is unclear what the participation and success rate will be due to the alteration.
College Credit
This category measures the percentage of seniors who earned college credit by taking and passing a college-level course while still in high school. For the most part, these are courses offered through the state’s network of community colleges. The percentage of students earning dual enrollment credit has climbed from 10% to 14% of high school seniors, thanks to a boost in investment from the state to expand these offerings, as well as a greater effort on the part of K–12 and community colleges to make these opportunities available to students.
These dual enrollment courses can be academic in nature, but more often, are career-oriented, giving students a jumpstart on college or training for workplace certifications and licenses.
Career Technical Education
This area, which has been an area of expanded focus for schools, saw the biggest gains between 2017 and 2019.
The percentage of students earning credit through CTE rose from 22% of seniors in 2017 to 37% of seniors in 2019, the largest gain among all the measures. Some CTE credit is hard-won, the product of months or years of training and education resulting in a valuable credential or certification that can be used to secure a job upon graduation.
However, some of the fastest-growing credentials are of questionable value in the marketplace and can be earned through brief coursework and short online examinations. PARCA research for the Business Education Alliance found that some of the fastest-growing credentials included certifications such as adult beef quality assurance and certified guest professional. Thousands of additional credentials have been issued along these lines. While the certificates may reflect useful knowledge, they don’t require extensive coursework or knowledge to earn. Beyond that, the volume at which these credentials are being issued doesn’t match available employment opportunities.
According to data provided by the Alabama Department of Education, credentials issued in Adult Beef Quality Assurance and Certified Guest Service Professional constituted almost 40% of the 30,040 credentials issued in the 2018-2019 school year for students 6th – 12th grade.
State Education Department officials as well as officials in colleges, workforce agencies are working with the governor’s office and industry to provide schools more guidance on how to define an industry-recognized credential. Going forward, an industry-recognized credential that counts for career readiness should be one that is linked to a rigorous course of study, one that confirms a student has mastered the material. Further, the credential should qualify its holder for a legitimate job opportunity in an in-demand field.
Conclusion
Educators have shown that they can respond to a performance goal. Over the past decade, Alabama has seen a dramatic rise in its high school graduation rate from among the lowest in the nation to among the highest.
In an even shorter time frame, the percentage of students designated college and career-ready has also climbed significantly. Progress toward goals should be applauded. At the same time, we should ensure that the pursuit of goals should produce meaningful results for students and the broader public.
The pandemic will undoubtedly lead to some erosion in immediate measures of educational progress, but it also affords an opportunity to focus measurement and goal setting on valuable ends.
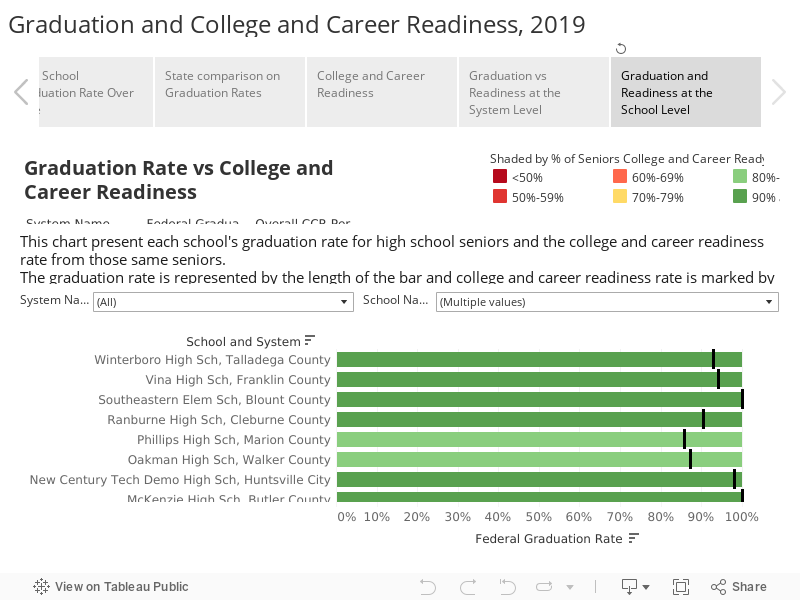
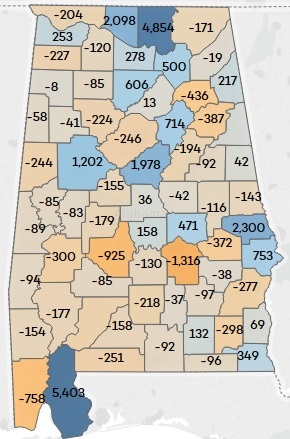
The visualizations below allow you to compare systems individual schools on graduation rates and college and career readiness. Use the available menus to select schools and systems you want to focus on. Remember, the socio-economic composition of the student body tends to affect performance.
Performance by System

Performance by High School