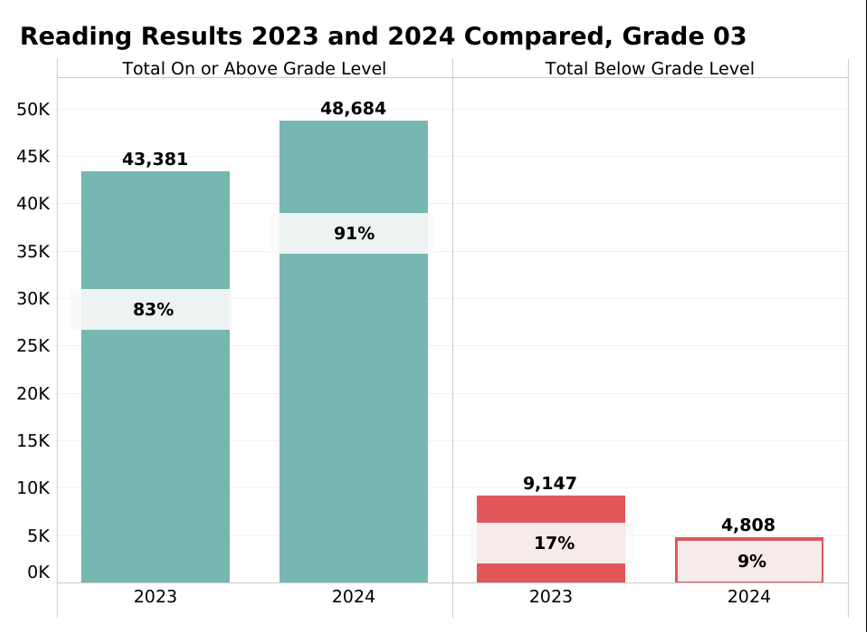
Alabama third graders showed major improvement in reading performance in 2024, as the percentage of Alabama students reading sufficiently by the end of third grade jumped by 8 percentage points compared to the previous year. The number of 3rd graders scoring “below grade level” on reading decreased from over 9,000 in 2023 to under 5,000 in 2024, from 17% to 9% of third graders, according to results released earlier this month by the Alabama State Department of Education.
The Department contracts with PARCA to evaluate the Department’s implementation of the Literacy Act. PARCA’s evaluation and public research divisions operate separately.
Figure 1. ACAP reading performance 2023-2024 compared

Investments in Better Instruction and Support
The improving reading performance comes after significant investment and effort in improving reading instruction, a push launched after the passage of the Alabama Literacy Act of 2019. Funding for the Alabama Reading Initiative has more than doubled to over $100 million annually. That spending supported:
- Thousands of teachers trained or retrained in reading instruction grounded in the “science of reading.“
- Every school with grades K-3 having a dedicated reading coach, focused exclusively on grades K-3, working with teachers to improve reading instruction.
- A corps of state-trained reading specialists deployed to support teachers and coaches, with a particular concentration on struggling schools.
- Schools identifying struggling readers as early as Kindergarten, informing parents, and developing reading intervention plans to bring the child to reading sufficiency.
- Struggling students being screened for learning challenges and receiving the support of specialists.
Other factors (see below) also may be influencing the gains, but the initiative appears to be yielding positive results.
Big Gains by Schools with High-Levels of Economic Disadvantage
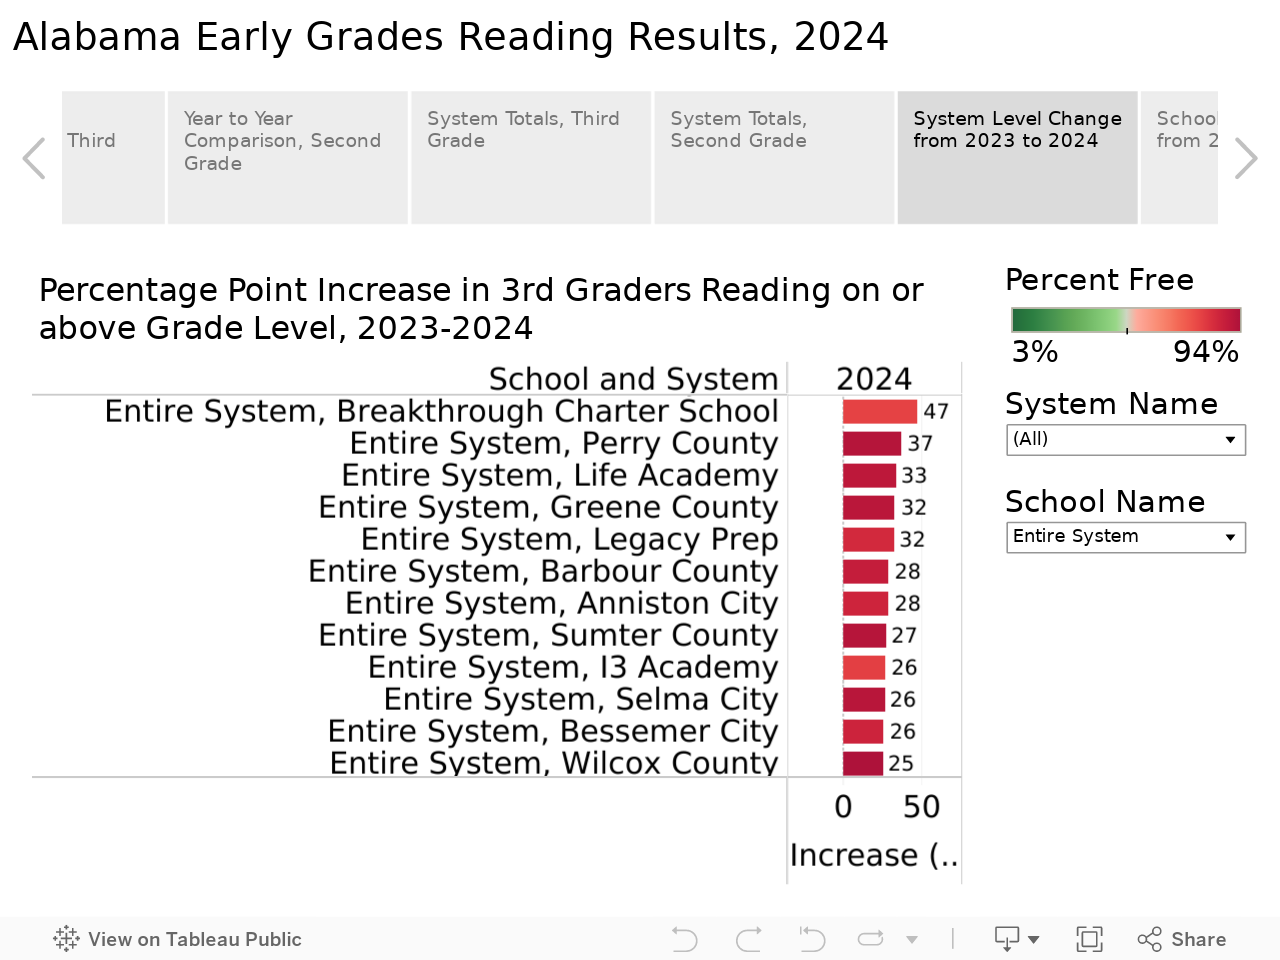
This year, the biggest improvements were among high-poverty, high-academic-challenge schools. Yes, those schools had more room for improvement, but the gains were substantial, and only a handful of systems lost ground. Top improving systems included smaller rural systems like Perry and Greene counties, plus Anniston City Schools. Charter schools like Breakthrough Charter School in Perry County, and Legacy Prep and i3 Academy in Jefferson County also showed improvement. Life Academy also shows up as a top gainer, but in percentage terms, the school still trails most districts, with 25% of its students not reading sufficiently, according to the ACAP.
Figure 2. Gains in performance, 2024 and 2023 compared
Among large systems, Birmingham City Schools was the top in percentage point improvement, cutting the percentage of its students reading below grade level in half. Montgomery County School System was close behind with an 18-percentage point improvement. However, both systems, which have higher concentrations of economically disadvantaged students, still have almost 20% of students below the reading sufficiency threshold.
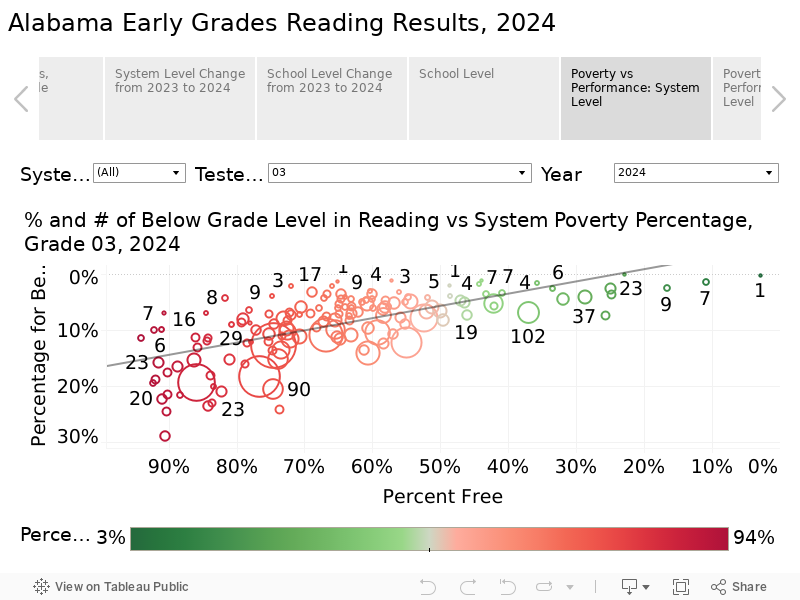
Because of their size, Montgomery County ranks No. 2 and Birmingham City No. 3 in the number of students below grade level. Birmingham had 319 students who failed to hit the mark, and Montgomery had 393. Mobile, the state’s largest school system, had 476 students below the threshold, representing 13% of tested third graders. Figure 3 positions school systems on the graph according to two measures. Systems with a high percentage of students reading on grade level are higher on the chart. Systems with low rates of student poverty are to the right of the chart and are shaded green.
Systems with higher poverty rates are shaded red and are arrayed on the left side of the chart. The size of the circle and the number represent the number of students not reading sufficiently. In general, systems with higher rates of poverty have higher numbers of students who aren’t testing on grade level for reading.
While a system’s poverty rate is somewhat predictive of its reading performance rate, this chart shows a good deal of variance among systems, indicating that high-quality teaching can overcome economic disadvantage.
Figure 3. Performance in the context of economic disadvantage, by system
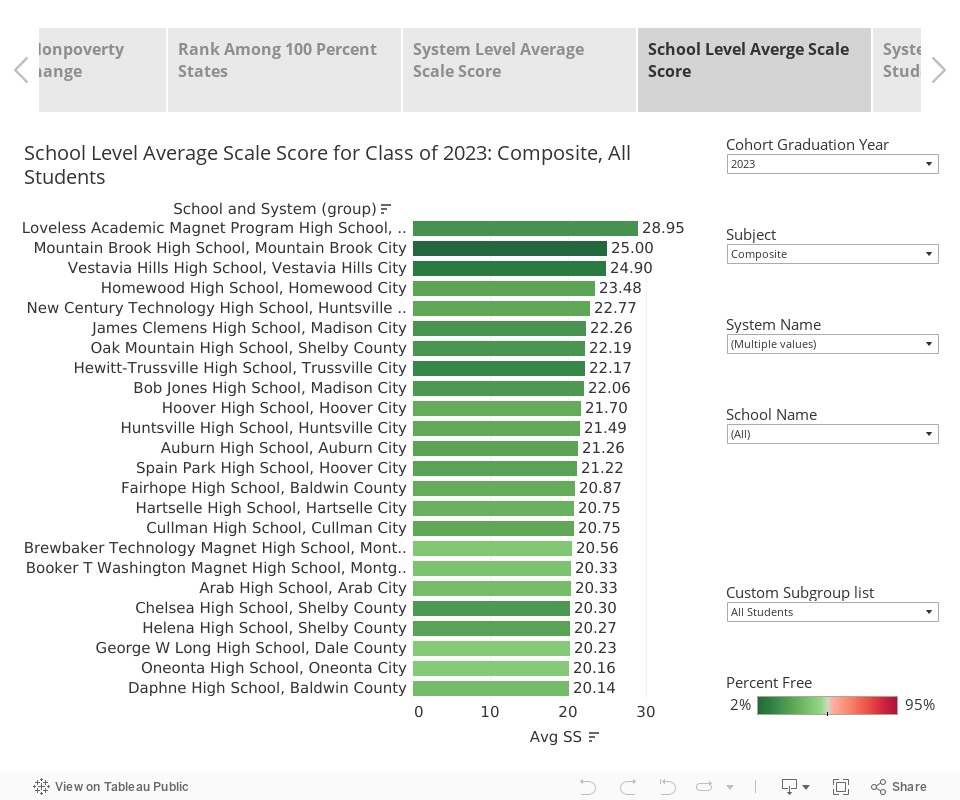
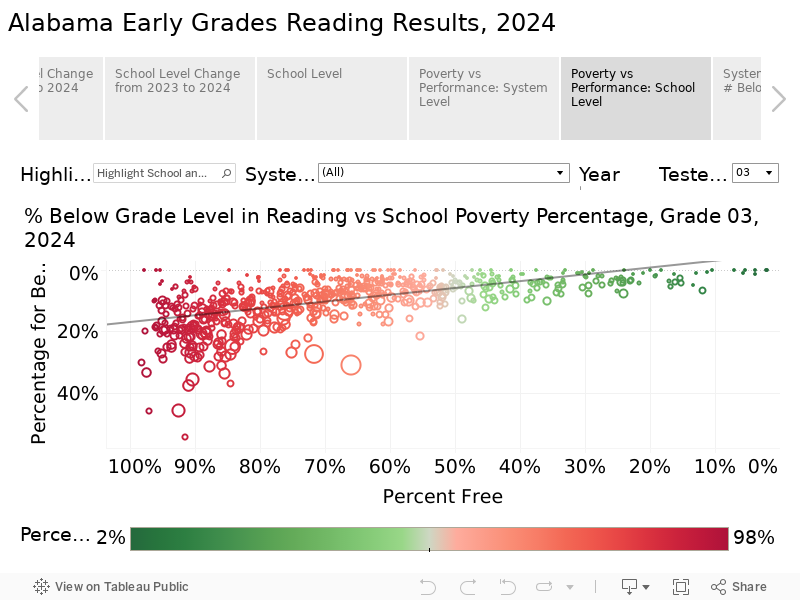
School-level results show an even wider spread, and poverty levels are even less predictive of performance. Use the tabs and menus to explore and narrow the results to focus in on schools and systems of interest.
Figure 4. Performance in the context of economic disadvantage, by school
Other factors: Pandemic Recovery
One factor that may have contributed to higher success rates among students is the increased recovery time since the outbreak of the COVID-19 pandemic. This year’s third graders were in Pre-K when COVID-19 hit, and for many, their Kindergarten year was at least partially disrupted by pandemic-related school closures or modified schedules. However, those children have now had three full years of regular instruction by teachers with up-to-date training in reading instruction.
This year’s second graders also scored better than last year’s second graders, which suggests the combination of stable school conditions and improved instruction could lead to further improvement in subsequent years.
Other Factors: Consequences Spur Urgency
Another factor likely influenced improved performance was a greater sense of urgency. This spring, the final prong of the Literacy Act went into effect. Students who didn’t clear the reading sufficiency bar on the ACAP may be required to repeat the third grade. Affected students can attend a summer reading boot camp at the end of which they can be retested. In addition to the retest, there are some exceptions and alternatives that can result in the child going on to the next grade.
Regardless, school systems, parents, and students had extra motivation to clear the sufficiency benchmark. Students and parents were motivated to avoid retention. Schools wanted to avoid having high numbers of students repeat third grade.
Even though the retention provision wasn’t in effect, the number of students repeating Kindergarten, first, or second grade has risen starting in the 2020-2021 school year. Some of that might be related to lost learning due to the COVID-19 pandemic, but it may also be due to schools and parents becoming more aware of the need for students to master grade-level material before advancing to the next grade. Education researchers find benefits for students retained in the earliest grades, but negative consequences for retention in middle school.
Other Factors: Practice Makes Perfect
The state also provided schools with access to ACAP practice tests this year, which allowed teachers and students to get more comfortable with the format of the test and the kind of material presented. ACAP was first given in the 2020-2021 school year. It is a test specifically developed by Alabama, and it reflects the content Alabama students are expected to master. Adjustments to the test were made in the 2022-2023 school year to reflect updates to the English Language Course of Study. Teachers have now had more time to absorb and practice teaching the content.
Why the attention on third-grade reading?
From the time they enter school through the end of third grade, students are learning to read. Starting in fourth grade, students are expected to read to learn the material presented to them. If children can’t read in the fourth grade, they are more likely to fall behind. Academic research finds that students who aren’t reading on grade level by the end of third grade are four times less likely to graduate from high school than proficient readers. That disadvantage is further compounded if the students are Black, Hispanic, and/or poor. Research finds a correlation between early grades reading struggles, discipline problems in school, and lower levels of educational attainment and earnings later in life.
Alabama’s Literacy Act followed similar legislation in Florida and Mississippi. Both those states have seen large gains in reading scores on the National Assessment of Education Progress (NAEP), which provides the only comparative measures of student academic performance across states. Mississippi and Florida have higher reading scores than Alabama, and both perform above the national average. The results of the most recent NAEP, taken in 2022, contained an early positive hint. Alabama was one of only five states to make gains in fourth grade reading as most states lost ground in the wake of the pandemic.
Reality check: What does reading sufficiently really mean?
Terms like reading sufficiency, reading on grade level, and grade-level proficiency can be confusing, and the measures for such terms have been shifting over time based on reappraisals of test data.
When the State Department of Education released the reading data described in this report, it calculated the percentage and number of students as either “Below Grade Level” or “At or Above Grade Level.”
But here’s the fine print. A third-grade student can score anywhere between 275 and 740 on the ACAP Reading, which is a subset of the broader ACAP English Language Arts standardized test. (For an in-depth account of this issue, read the account provided by Trisha Crain Powell of al.com). Evaluating the ACAP Reading content and results, experts determined that students with a score of 473 would be on grade level, not proficient, but on grade level.
However, tests aren’t perfect measures, so practitioners calculate, based on results, a range of scores in which students might fall and still be on or about grade level.
Examining the results and making calculations, the testing experts recommended a cut score of 435, which is two standard errors below the grade-level mark. If a student scores under 435, the statistics indicate that there is more than a 90 percent chance that the student is truly below grade level. The lower cut score gives educators a higher level of confidence that the student in question doesn’t have the reading skills needed to succeed in 4th grade.
However, that also means that a lot of students who score between 435 and 473 might not be reading on grade level. And those students are more likely to run into struggles as learning after third grade increasingly depends on the ability to read.
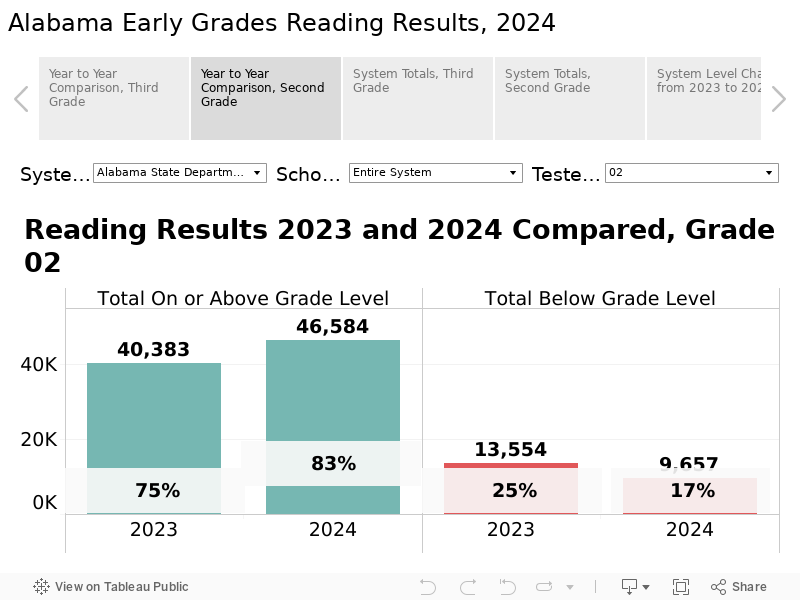
The second-grade results also need explanation. On the recommendation of testing experts, the State Board of Education adopted a more rigorous cut score for the second graders of 455. That leads to a higher percentage of second graders being identified as below grade level. That means that more children in second grade will be identified and provided with extra support in hopes of getting them up to grade level by the end of third grade.
Figure 5. Second Grade ACAP Reading Results, 2023 and 2024 compared
The State Department of Education has signaled its intention to raise the cut score over time, bringing the reading sufficiency measure closer to the mark for grade-level reading. Mississippi used a similar approach as it phased in its literacy act.