Alabama public school students showed increased proficiency in math, science, and English at all grade levels and across virtually all demographic groups in the 2021-2022 school year, according to the recently released results of the statewide standardized test, the Alabama Comprehensive Assessment Program (ACAP).
Figure 1. Proficiency By Subject (Grades 3-8), 2021 and 2022 compared
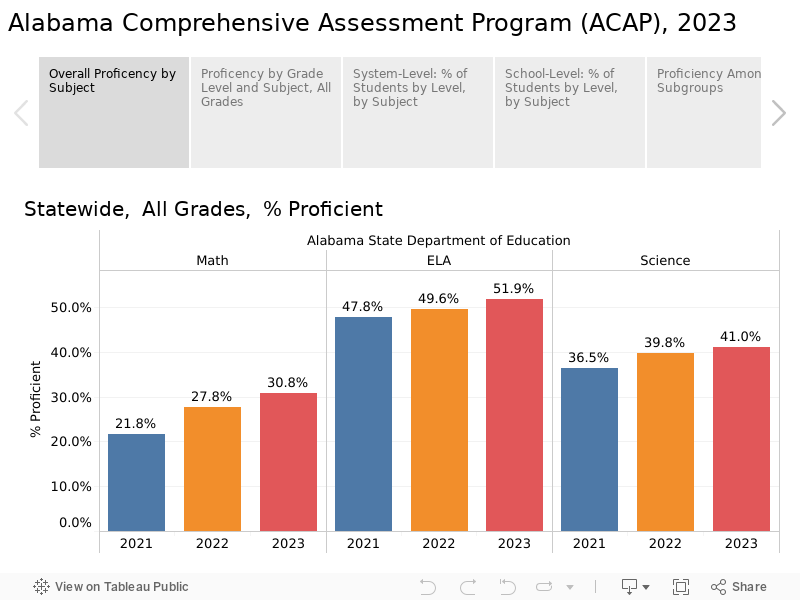
While the improvement is welcome, there is a long way to go.
Only half of students across the tested grades (3-8) scored proficient in English Language Arts (ELA). In math, only 28% of students were proficient. Students were tested in science in grades 4 and 8, and 40% of students were found to be proficient. A sub-set of the ELA questions is used to measure whether second and third-graders are “reading on grade level,” a different measure than proficiency. Those results, released by the state department this summer, showed that 22% of third-grade students were below grade level in reading.
This is the second year students have taken the ACAP as the statewide standardized test. Developed specifically for Alabama, ACAP is not taken by students in other states. Comparing ACAP scores to scores on previous assessments (ACT Aspire, Scantron), ACAP finds similar though slightly higher proficiency rates in ELA/Reading as previous statewide standardized tests found. The one national benchmark test, the NAEP, has historically graded tougher, with reading proficiency rates about half what other assessments show. In Math, ACAP seems to be the toughest measure of all, with scores in the range of but slightly lower than NAEP. Past statewide assessments have tended to grade student math proficiency more generously.
A Rebuilding Year
The 2021-2022 school year marked a return to closer-to-normal conditions compared to the 2020-2021 school year, which was marked by the disruptions from the Covid-19 pandemic. Improvements were seen not only across all subjects and all grades but across almost all school systems.
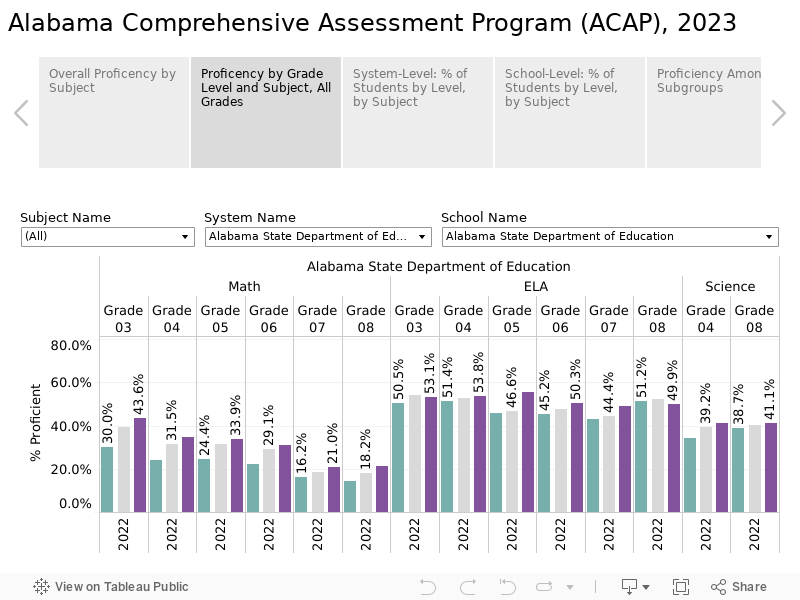
Looking at the results by subject and grade, improvements were strongest among the youngest students. The gains were highest in early grades mathematics, a welcome development considering Alabama students’ long-term poor performance in math. The math proficiency rate among third greater increased by 9 percentage points and by seven percentage points in grades 4-6. With urging and support from the Legislature, the Alabama Department of Education is putting additional emphasis on early grades mathematics. The early grade gains show promise. However, the percentage of students scoring proficient in math declines sharply in the upper-grade levels, as it has for years.
ELA scores are also highest in those early grades, with a drop after fourth grade, then a recovery in 8th. In response to the 2019 Alabama Literacy Act, schools and systems statewide have been providing an unprecedented level of professional development for reading instruction for teachers in Grades K-3. As one might expect, growth in ELA scores from 2021 to 2022 was highest in Grade 3.
Figure 2. Proficiency by Grade, 2021 & 2022 compared
Results by Subgroup
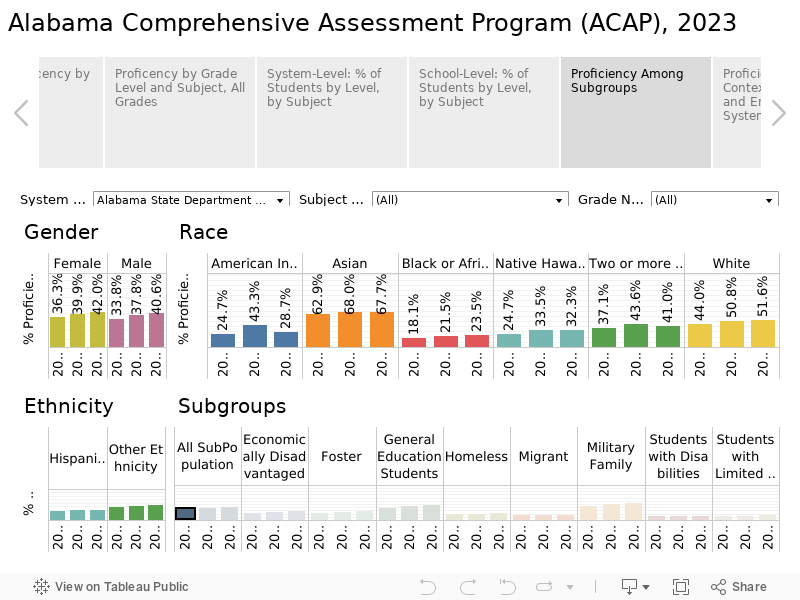
Most subgroups of students showed improvement, with the strongest gains being among White, More than One Race, and Asian students. While Black, Hispanic, and economically disadvantaged students all posted gains, the higher level of increase among White, More than One Race, and Asian students led to a widening of the score gap between the groups. Nationally and within the state, evidence indicates that systems serving economically-disadvantaged and minority students tended to be harder hit by the pandemic and were slower to return to normal functioning as conditions improved. That may play some part in explaining the disparity.
Figure 3. Proficiency by Subgroup, 2021 & 2022 compared
Proficiency in Context
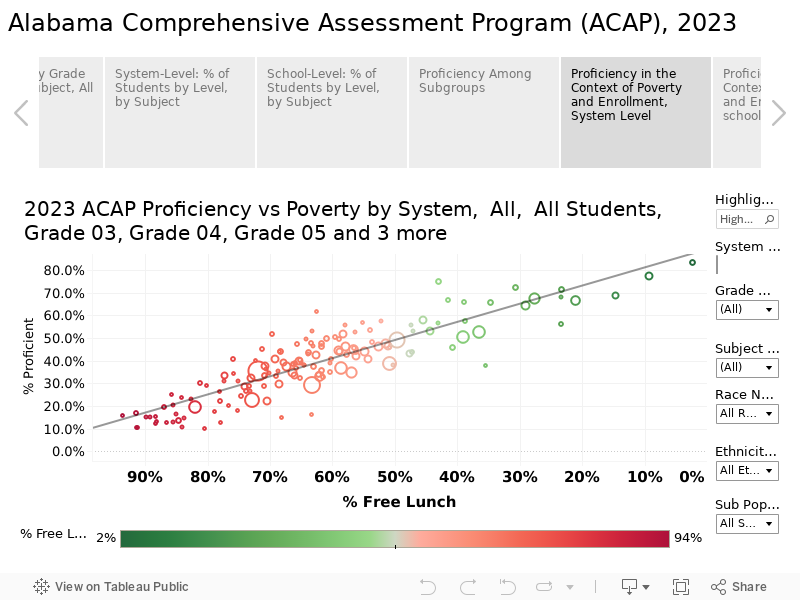
In general, systems with low rates of economic disadvantage tend to have a higher percentage of students scoring proficient. Schools and systems with higher concentrations of economic disadvantage tend to have lower rates of proficiency. This pattern is consistent nationally across most standardized tests. The economic disadvantage for a system or school is measured by the percentage of students who automatically qualify for a free lunch under the national school lunch program.
The chart below presents school systems according to both their rate of proficiency (the vertical axis) and their rate of economic disadvantage (the horizontal axis). Systems with higher rates of proficiency are higher above the baseline, while the systems to the left of the chart have high rates of economic disadvantage, with economic disadvantage decreasing as you move right. The line sloping up to the right represents the relationship between the two variables and predicts where the proficiency rate of a system at a given level of economic disadvantage. Thus, systems above the line of prediction are performing better than predicted given the level of poverty among students.
Piedmont City Schools, for instance, generated an overall proficiency rate of 60% despite having 54% of students qualifying for a free lunch. That compares to a 2022 state average proficiency across all grades and all subjects of 38% and an average economic disadvantage rate of 41%.
Figure 3. System Proficiency in the Context of Poverty, 2022
So, when comparing results, the economic and demographic composition of the school and system should be taken into account. However, examples like Piedmont’s show that demographics don’t predict destiny. Piedmont was particularly well positioned to cope with disruptions of the pandemic and continue academic progress, thanks to its pioneering experience in digital education delivery, as described by PARCA in a 2021 report.
Using the same approach to present proficiency results for schools, the relationship between proficiency and economic disadvantage levels is still there, but it is not as determinative, with greater divergence from the line of prediction. That provides further evidence the efforts of educators and communities can make a difference.
Use the menus provided to explore the data or to highlight schools and systems of interest.
Figure 4. School Proficiency in the Context of Poverty, 2022

Beyond proficiency
Student scores on the ACAP fall into one of four levels. According to the scoring system, Level 4 students have an advanced understanding of grade-level standards. Students scoring on Level Three have a strong understanding of standards. Students on Level 2 have a partial but incomplete understanding of grade-level standards, while students scoring on Level 1 demonstrate minimal understanding of the material for the grade level.
Figure 5 presents the percentage of each system’s students that earned scores at each level. Two lines are presented for each system, allowing a comparison of the 2021 and 2022 results. Overall state results are at the top for comparison.
Figure 5. Percentage of students scoring at each level by system

Figure 6. presents the same information on student levels for individual schools. Menus allow the selection of systems. When comparing schools keep in mind the socio-economic mix of the students being served, as well as the school’s status as a magnet or charter school. Results for schools where students are selected or self-selected should be understood in that context. It is also important to remember that schools can change from year to year. Some schools may close or merge with other schools. New schools may open. Grade levels may be added or removed. Any such changes need to be considered before drawing conclusions about performance.
Figure 6. Percentage of Students scoring at each level by school

Large Performance Gains
In 2022, the system that showed the highest overall percentage point gain was Cullman City School, with an 11.6 percentage point gain in proficiency in all subjects combined.
Cullman’s gains were particularly strong in math. Jumps were seen in all grades ranging from a 14 percentage point gain in 8th grade to a nearly 27 percentage point gain in fourth grade.
Superintendent Kyle Kallhoff attributed the success to teachers, students, and parents. Cullman invested federal relief and recovery money in four math coaches across its five schools. Those coaches received intensive summer training from the state department of education’s Alabama Math Science and Technology Initiative (AMSTI). They continued to receive AMSTI support throughout the year.
With support from the coaches, teachers and students began engaging in number talks, a way of discussing math problems that encourage students to develop mathematical reasoning skills. Cullman teachers also recognized that the rigor of Alabama math standards required them to supplement their math instruction to ensure the standards were covered. to make sure that the math standards were covered.
Teachers paced lessons so that the match standards were covered by April, which allowed time for review and targeting of areas where students needed additional support.
Figure 7. Cullman City Math Proficiency Gains

Explore the data
PARCA provides its analysis and visualization of the ACAP data for the benefit of school leaders and teachers, for parents, and citizens at large. The tabs in the visualizations provide a variety of ways to evaluate relevant data. Use the “full screen” option at the bottom right of the visualizations to access a larger view of the data.
Comparative data is useful for understanding performance in the context of your community and the state. Comparisons over time and with similar schools can be useful in gauging your school’s progress and identifying areas where improvement is needed.