Halfway to 2025, Alabama is slightly behind pace to meet its goal of adding 500,000 new skilled workers to its workforce by 2025, according to a new study commissioned by Gov. Kay Ivey’s office.
The results are better than might be expected, considering the circumstances of the past three years. However, sustained effort will be required across multiple fronts to make competitive progress on educational attainment and labor force participation.
The Alabama Workforce Council and Gov. Kay Ivey launched the Success Plus initiative in 2018 amidst a national push to raise education and skill levels. Increasingly, a credential or degree beyond high school is considered essential to thrive in the modern economy. Higher levels of educational attainment for individuals and for the state are linked to higher pay, lower unemployment, and better health outcomes. Alabama trails other states in educational attainment and associated measures like labor force participation.
Printable PDF version available here
Between 2018-2021, Alabama produced 214,725 newly credentialed individuals between the ages of 16-64, according to estimates developed by the Center for Regional Economic Competitiveness, the Washington, D.C.-based nonprofit hired to analyze the state’s performance.
That includes associate’s and bachelor’s degrees earned at colleges, industry-recognized credentials in high schools, occupational licenses, and completed certification programs and apprenticeships in the adult population as well.
Refining the Goal
Like any thoughtful goal-setting exercise, Success Plus has refined its measures and goals. The original focus on the adult population (ages 25-64) has been broadened to include credential earners 16-24, recognizing that age group as the supply line for the future workforce and those most active in credential-earning.
Leaders of the initiative are also opting to focus on the numerical goal of 500,000 individuals rather than achieving a 60% rate of postsecondary credential attainment. A rate is more abstract and harder to measure. Beyond that, reaching the national average rate for educational attainment and labor force participation are important long-term goals but aren’t realistically attainable by 2025.
Refining the Count
To generate the counts and estimates, CREC worked across several information sources. Those estimates have limitations since they are based at least in part on aggregated data:
- The data include reports from private for-profit and nonprofit schools and training agencies, some of which operate online distance education. Thus, some of the credentials reported by institutions with an Alabama presence may be earned by someone who lives elsewhere and won’t become part of the Alabama workforce.
- The estimates can’t control for the quality of the credential earned.
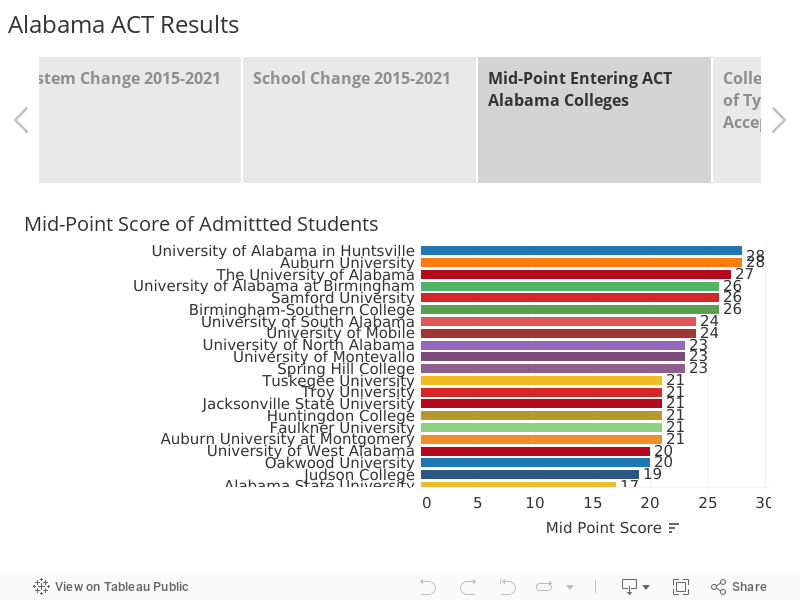
- Out-of-state students at Alabama public colleges earned about 40,000 of the 180,000 certificates and degrees included in the tally. Currently, only a small percentage of those students stay in Alabama.
Fortunately, a more precise count will eventually be available. The Success Plus initiative has spurred Alabama to build a privacy-protected system for tracking education, degree and credential attainment, and entry into the workforce, something most other states have already done.
That system is still developing, but its construction has already encouraged better data collection, standardization, and sharing across state agencies. That’s long been a need to generate timely insights on labor force and education supply and demand.
Success Plus is also building tools to sharpen the focus on quality credentials by building more direct routes through education to employment. The initiative brings together employers, educators, and outside experts to identify jobs that are in demand and the education and training needed to compete for those jobs successfully. As those pathways from education to employment become more clear, students should be able to plot a more efficient course to the career they want. And employers will be able to more efficiently identify individuals with the qualifications needed for positions.
Success Plus has identified those out-of-state students as an opportunity as well. A 2020 study by the Alabama Commission on Higher Education found that only 14% of bachelor’s degree earners who came from out-of-state were employed in Alabama five years after graduating. Alabama natives graduate and leave the state as well. The same study found that 62% of in-state bachelor’s earners remained in the state five years after graduation. Success Plus has energized efforts to retain those graduates as residents and workers.
Building momentum
Halfway to 2025, the number of career technical education credentials earned in high schools has risen, as has high school/college dual enrollment.
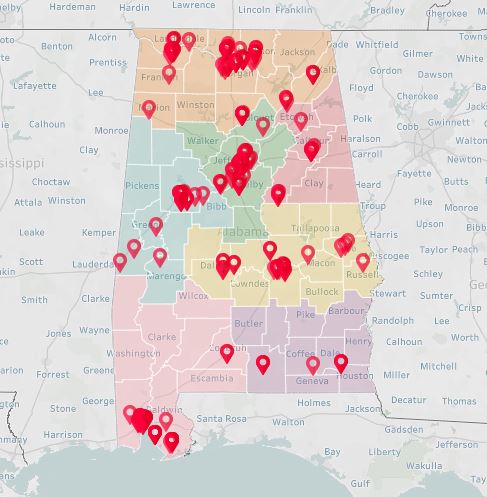
Another notable development spurred on by the Success Plus Initiative was the founding of the Alabama Office of Apprenticeship (AOA). In an apprenticeship, a new employee is paid while training and working for an employer or a profession. Apprenticeships often involve cooperation between an employer, a training provider, and the state, which encourages and helps subsidize paid training programs. Established in Sept. 2019, the AOA currently works with 427 employers, supporting 2,797 apprentices across the state.
Interactive Map of Apprenticeship Programs in Alabama
Needs Attention
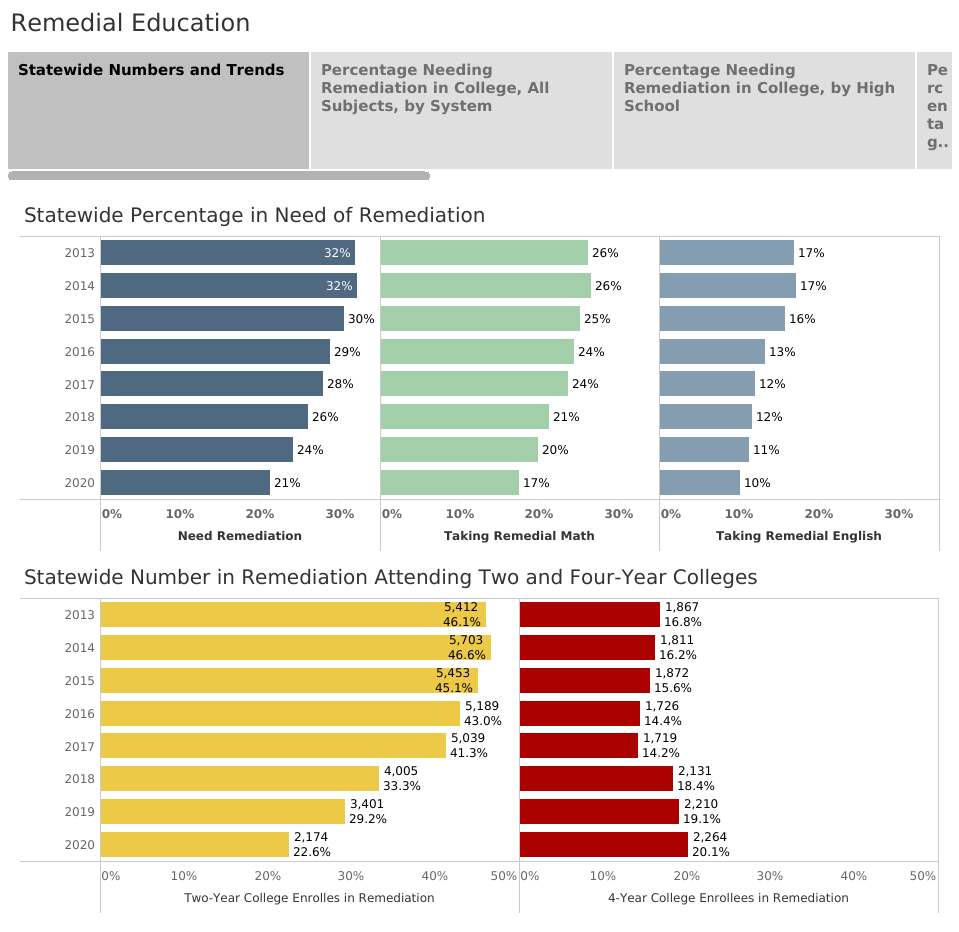
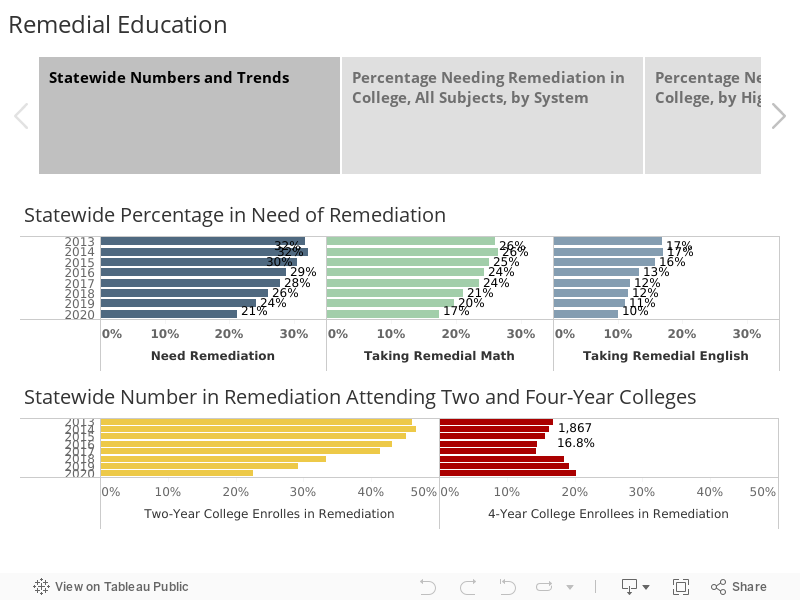
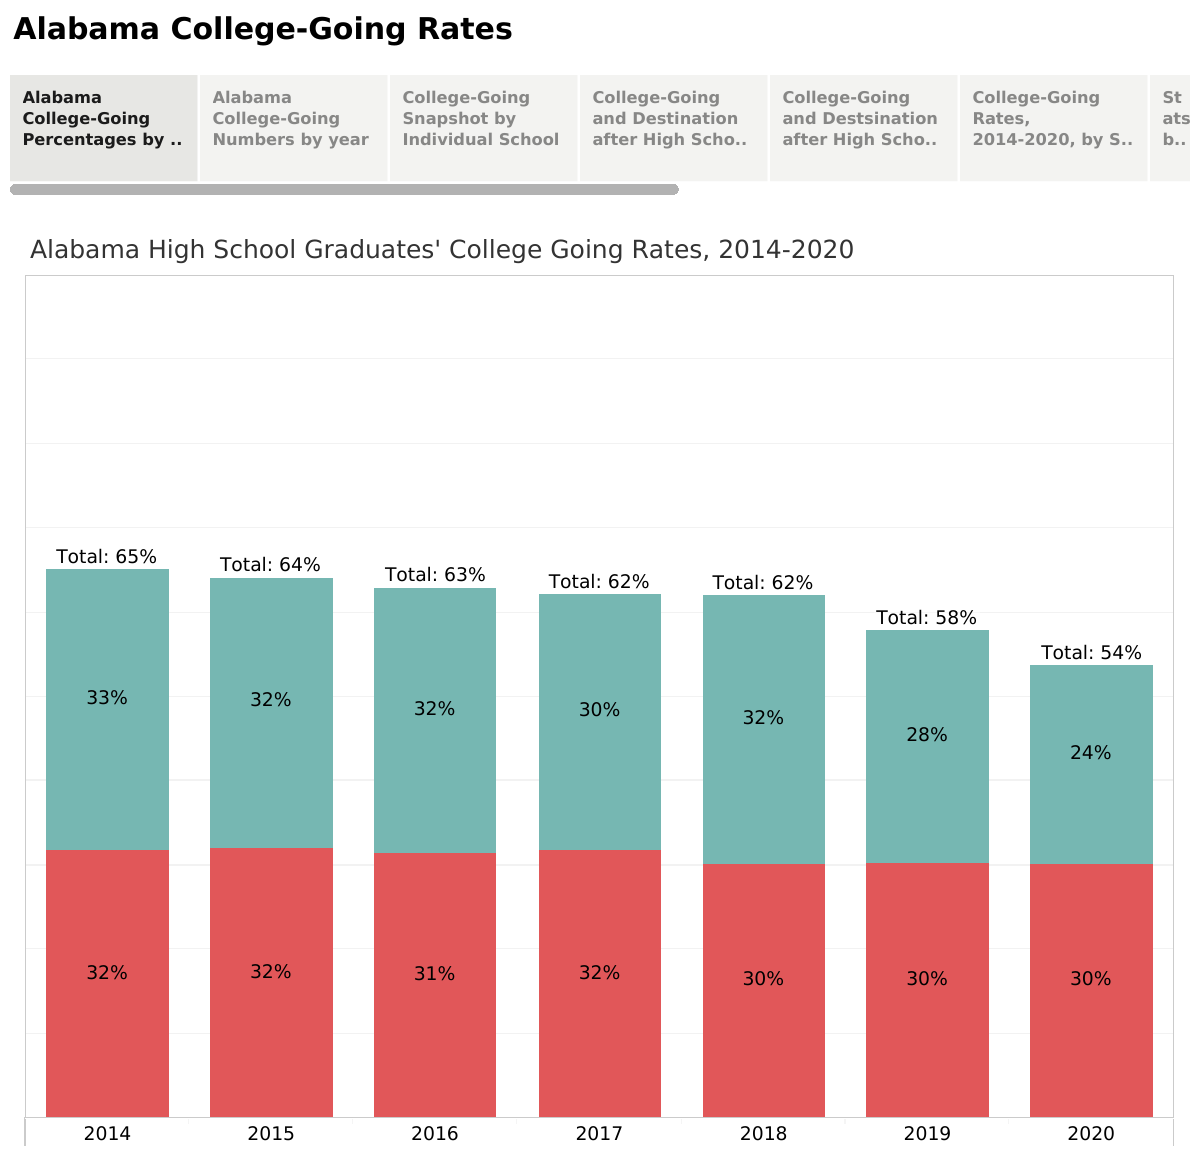
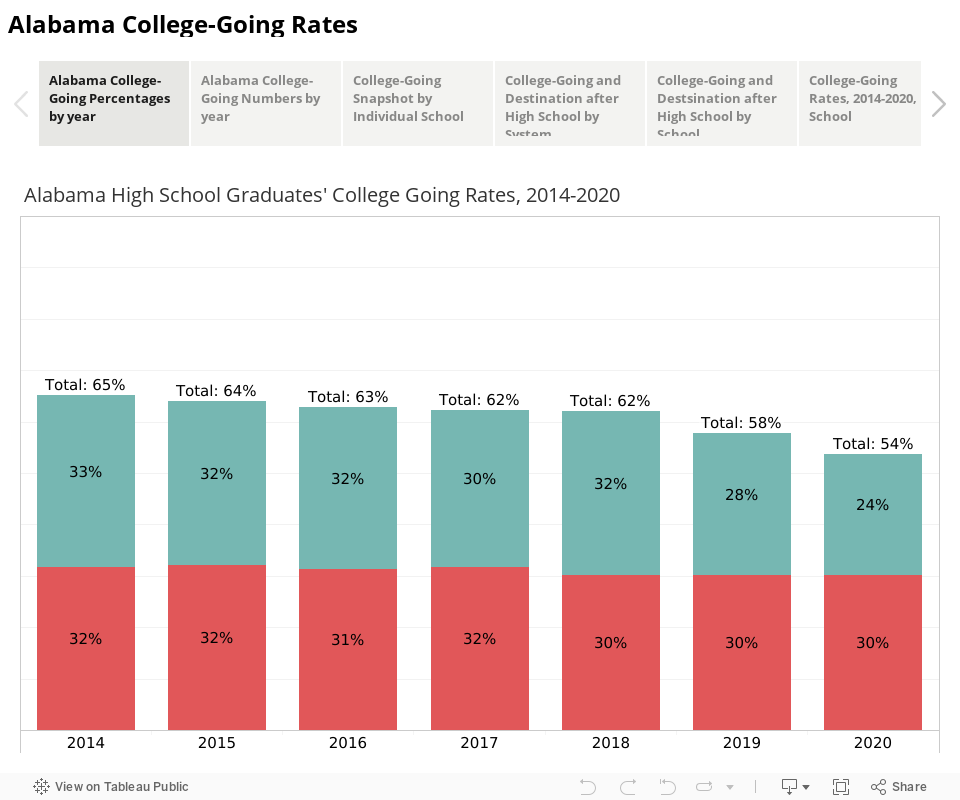
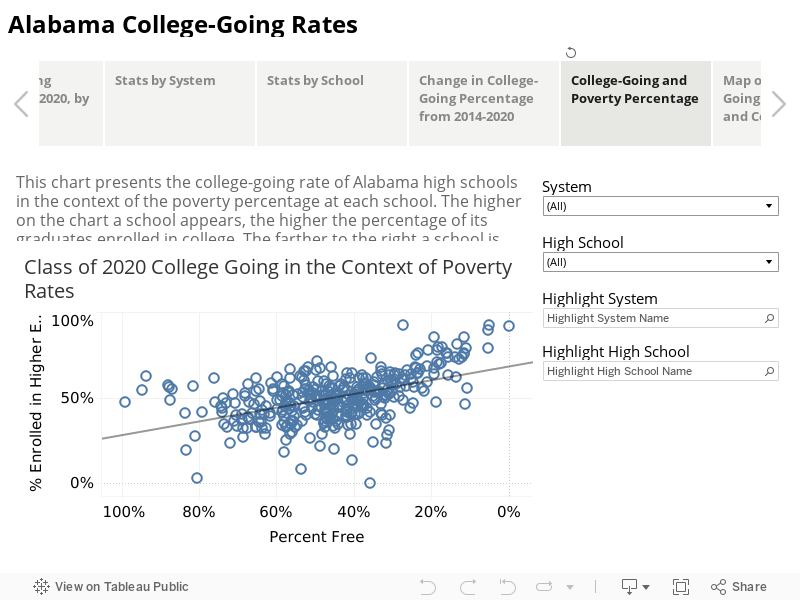
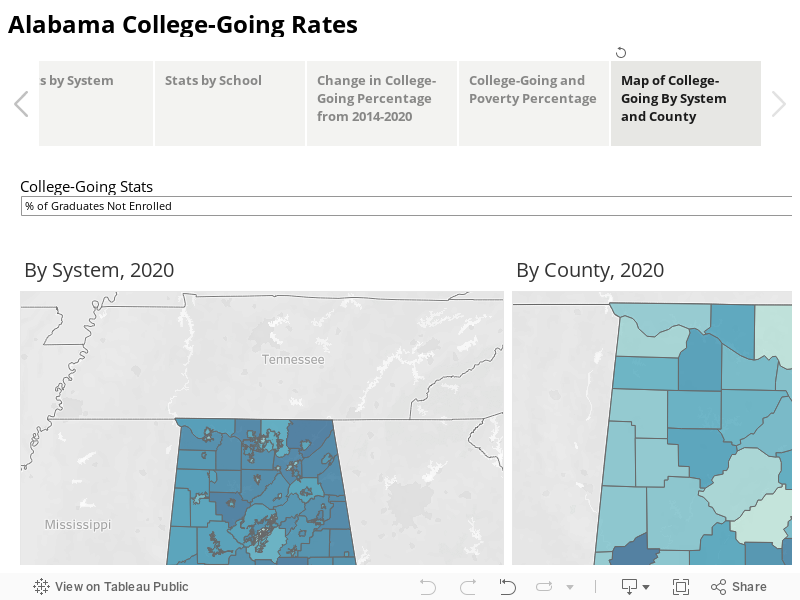
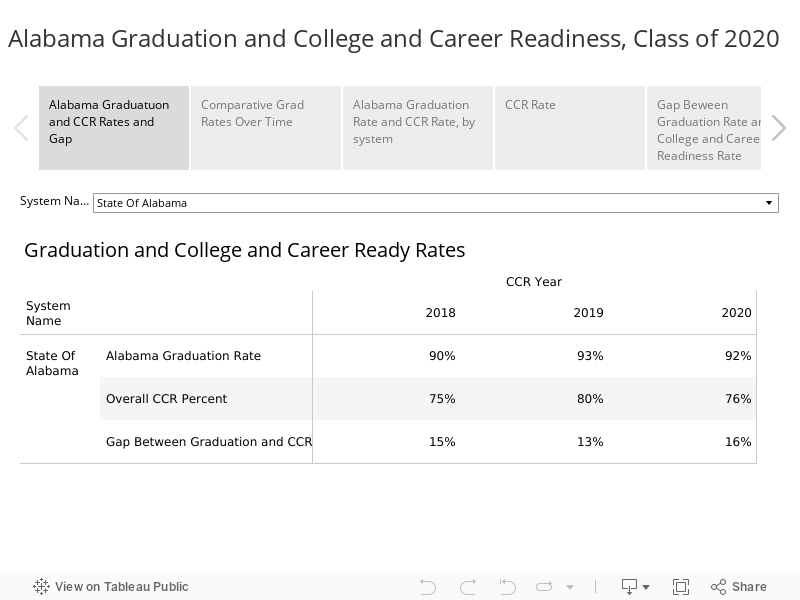
The college-going rate for high school graduates has declined for several years and dropped sharply during the pandemic. Part of the reason for the long-term drop is the rise in the high school graduation rate, which had hovered in the 70s but now tops 90%. The numbers suggest that additional students are graduating from high school but lack the academic qualifications for college. It becomes all the more critical for those students to leave high school with a career-related credential or a pathway into training or employment.
Another factor in the drop was the pandemic, which hit two-year colleges particularly hard. Current enrollment suggests a rebound at those schools. The students who delayed starting college during the pandemic represent a target pool of prospects for recruitment to training or education programs.
For those that didn’t finish high school or have left the workforce, there are education and training programs available, but they are underutilized. Nick Moore, who heads the Governor’s Office of Education and Workforce Training, pointed out that Alabama received almost $50 million in Workforce Innovation and Opportunity Act (WIOA) funding in 2020 but only reached 8,000 participants. Less than half of those participants earned a credential through the program, and even fewer ended up in employment related to the training.
If Alabama is going to reach its attainment goals, agency partners will need to recruit more individuals into training that leads to in-demand jobs. Government agencies and nonprofit partners will need to collaborate around participating individuals. Partners can increase success rates by identifying and removing barriers that prevent participants from successfully rejoining the workforce.
Conclusion
Assuming sustained and sincere commitment, Success Plus could mark a turning point for Alabama by:
- Bringing together a powerful array of interests and actors around a central goal, one that can only be achieved through action on multiple fronts.
- Committing the state to systematically gathering, reporting on, and acting on data to determine what’s working and where there are problems in the education and workforce pipeline.
- Prioritizing those who historically have been left behind: special populations that face barriers to educational attainment and participation in the workforce.
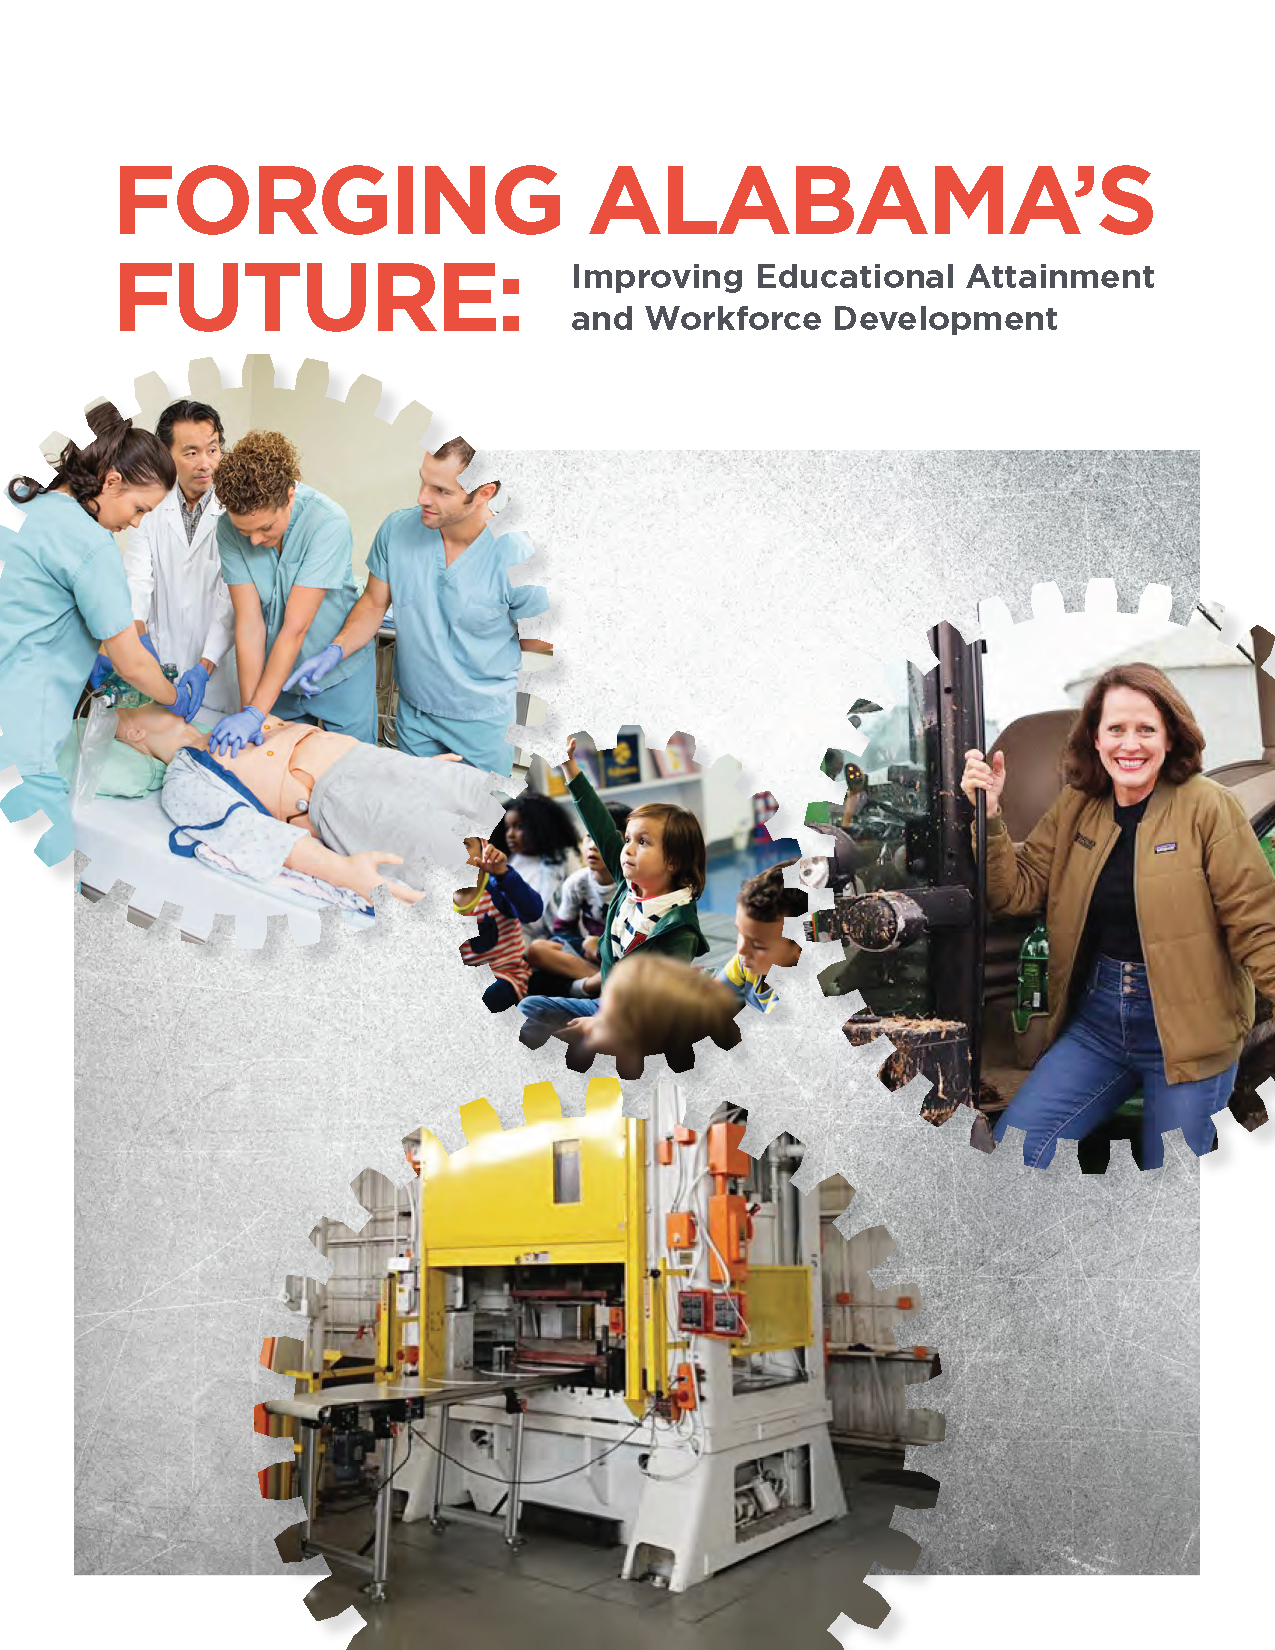
PARCA, in partnership with the Business Education Alliance and A+ Education Partnership, has tracked the progress of Success Plus since the initial goal was announced. The most recent report in the series, Forging Alabama’s Future, describes Success Plus and related initiatives and goals set by various partners.