As graduation approaches for the Class of 2023, there’s new data available allowing us to look back on last spring’s graduates.
The Class of 2022 faced particular challenges due to the Covid-19 pandemic, which struck when they were sophomores and persisted through their junior year. In both those years, the number of kids who dropped out was elevated: over 1,000 juniors from the Class of 2022 cohort dropped out, more than double the number of juniors that dropped out in the Class of 2021.
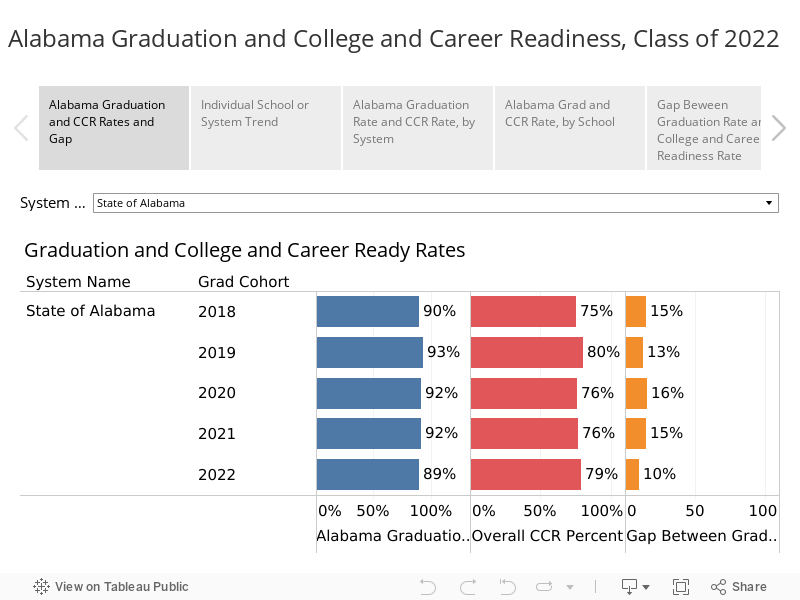
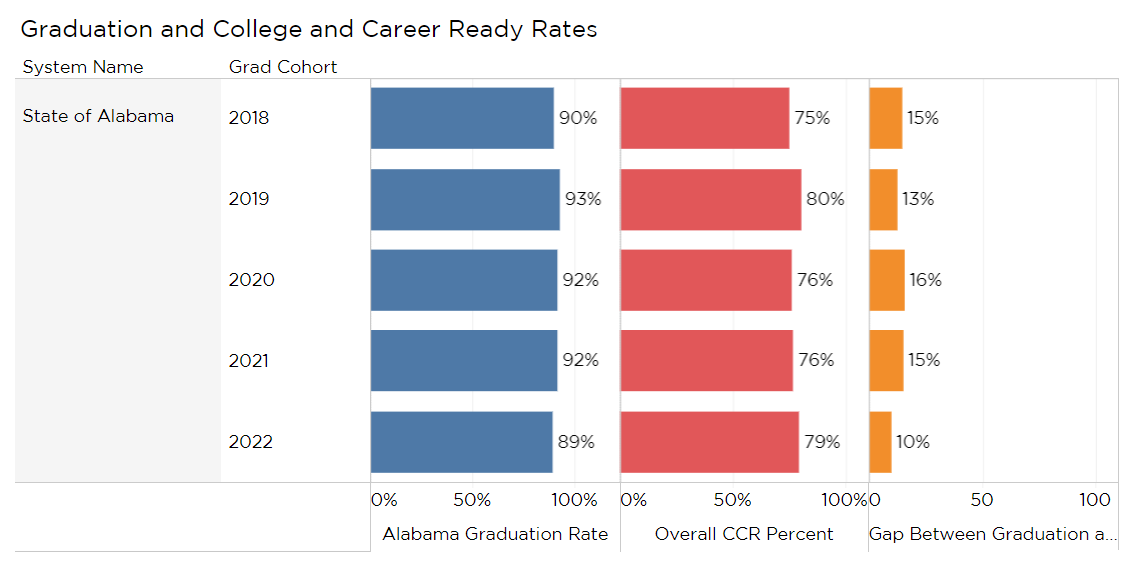
In the end, 89% of seniors graduated, compared to 92% in 2011, but those that persisted were more likely to finish college- and career-ready (CCR).
The Class of 2022 posted a significant jump in the percentage of CCR seniors, thanks to a jump in the percentage of students earning workforce-related credentials and an increase in dual enrollment.
In 2022, 79% of seniors were certified as CCR, up from 76% in 2021. That gain was despite a large drop in the percentage of seniors testing college ready on the ACT. (See PARCA’s previous analysis on the ACT results).
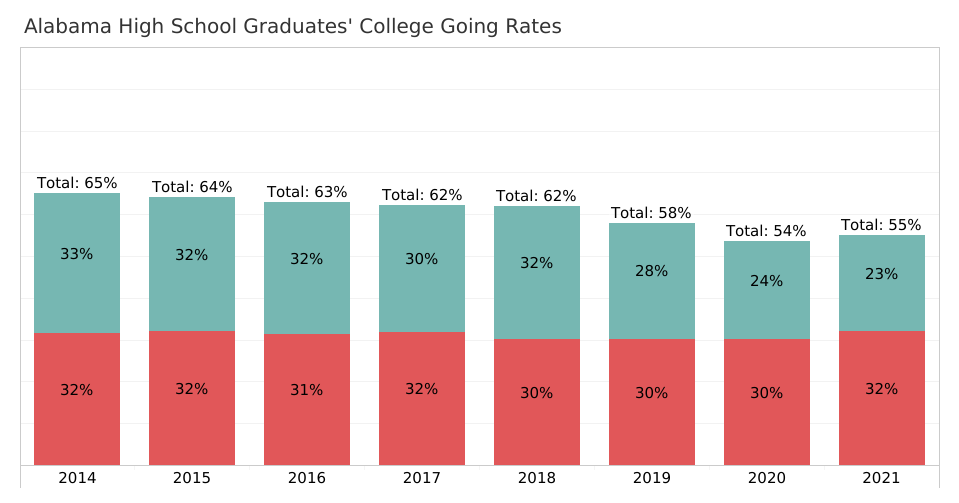
Fig1. Trends in High School Graduation and College and Career Readiness
The Class of 2022 broke a trend of smaller graduating classes, and despite the elevated dropout rate, more students graduated.
State leaders had been calling on schools to close the gap between graduation and career-ready rates.
A lower graduation rate combined with college-and-career readiness means that the gap between graduation and readiness narrowed to 10 percentage points, compared with 15 percentage points the previous year.
Shifts in Readiness
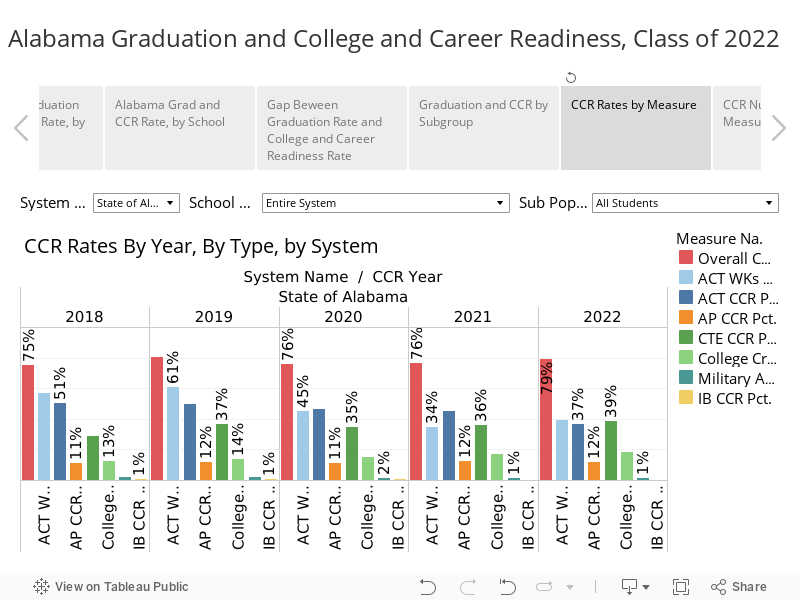
High school students can demonstrate college and career readiness in several different ways. Figure 1. allows you to explore trends on each measure. Diving below the surface on these measures presents a mixed picture of the Class of 2022.
Fig. 2 College and Career Readiness Measures, by Percentage of Seniors Earning
College and career readiness can be demonstrated by one or more of the following:
- Earn an Industry Recognized Credential through Career Technical Education: 39% of students earned an industry-recognized credential through career technical education in 2022, the highest rate for any class. These credentials result from taking work-oriented courses offered at high schools or K-12 career tech centers. Credentials must be tied to a student’s course of study and should be valued in a career field that is in demand in the regional job market. According to State Department of Education data, in 2022, the biggest jump in credentials earned was in certifications in the use of Microsoft software. Big gains were also posted in the number of students earning Certified Guest Professional credentials, a credential associated with the hospitality industry, and in Adult Beef Quality Assurance, an ag-related credential. Also posting gains were credentials associated with healthcare, construction, forestry, and the military’s ROTC programs. Across all grades, the 2021-2022 academic year saw more students earning CTE credentials than ever before: 33,535 compared to the pre-pandemic peak of 31,062 in 2019. While the growth is laudable, attention should continue to be focused on the quality and value of the credentials available.
- Earn Credit Through a College: a higher percentage of students earned college credit while in high school in 2022 than ever before: 18%. That’s up from 17% in 2020. These courses, also known as dual enrollment, tend to be taken through a local community college but can also be through a university. The student must successfully complete the course and earn credit to qualify as CCR.
- Earn a Qualifying Score through College-level Courses Taught in High Schools: Advanced Placement (AP) courses are taught in a high school but have the rigor and approach of college courses. In 2022, 12% of students qualified as CCR through AP, which is tied for the highest percentage ever. To count as CCR, a student has to score three or higher (out of 5) on the national end-of-course test, a level at which a college might award college credit. The number of students qualifying through success in International Baccalaureate (IB) classes also increased. IB is similar in rigor to AP, though less widely used.
- Earn a qualifying score on WorkKeys: 39% of seniors demonstrated college readiness by performing well on ACT’s WorkKeys test. This marked a recovery in the number and percentage of students qualifying by this measure. After dropping from 2019 to 2021, 2022 saw a recovery of 5 percentage points in 2022. WorkKeys is a standardized test designed to measure whether students have the math and communication skills expected in workplaces. WorkKeys is no longer required, and, in many systems, students who have already demonstrated college and career readiness by another means opt out. (More on WorkKeys results below)
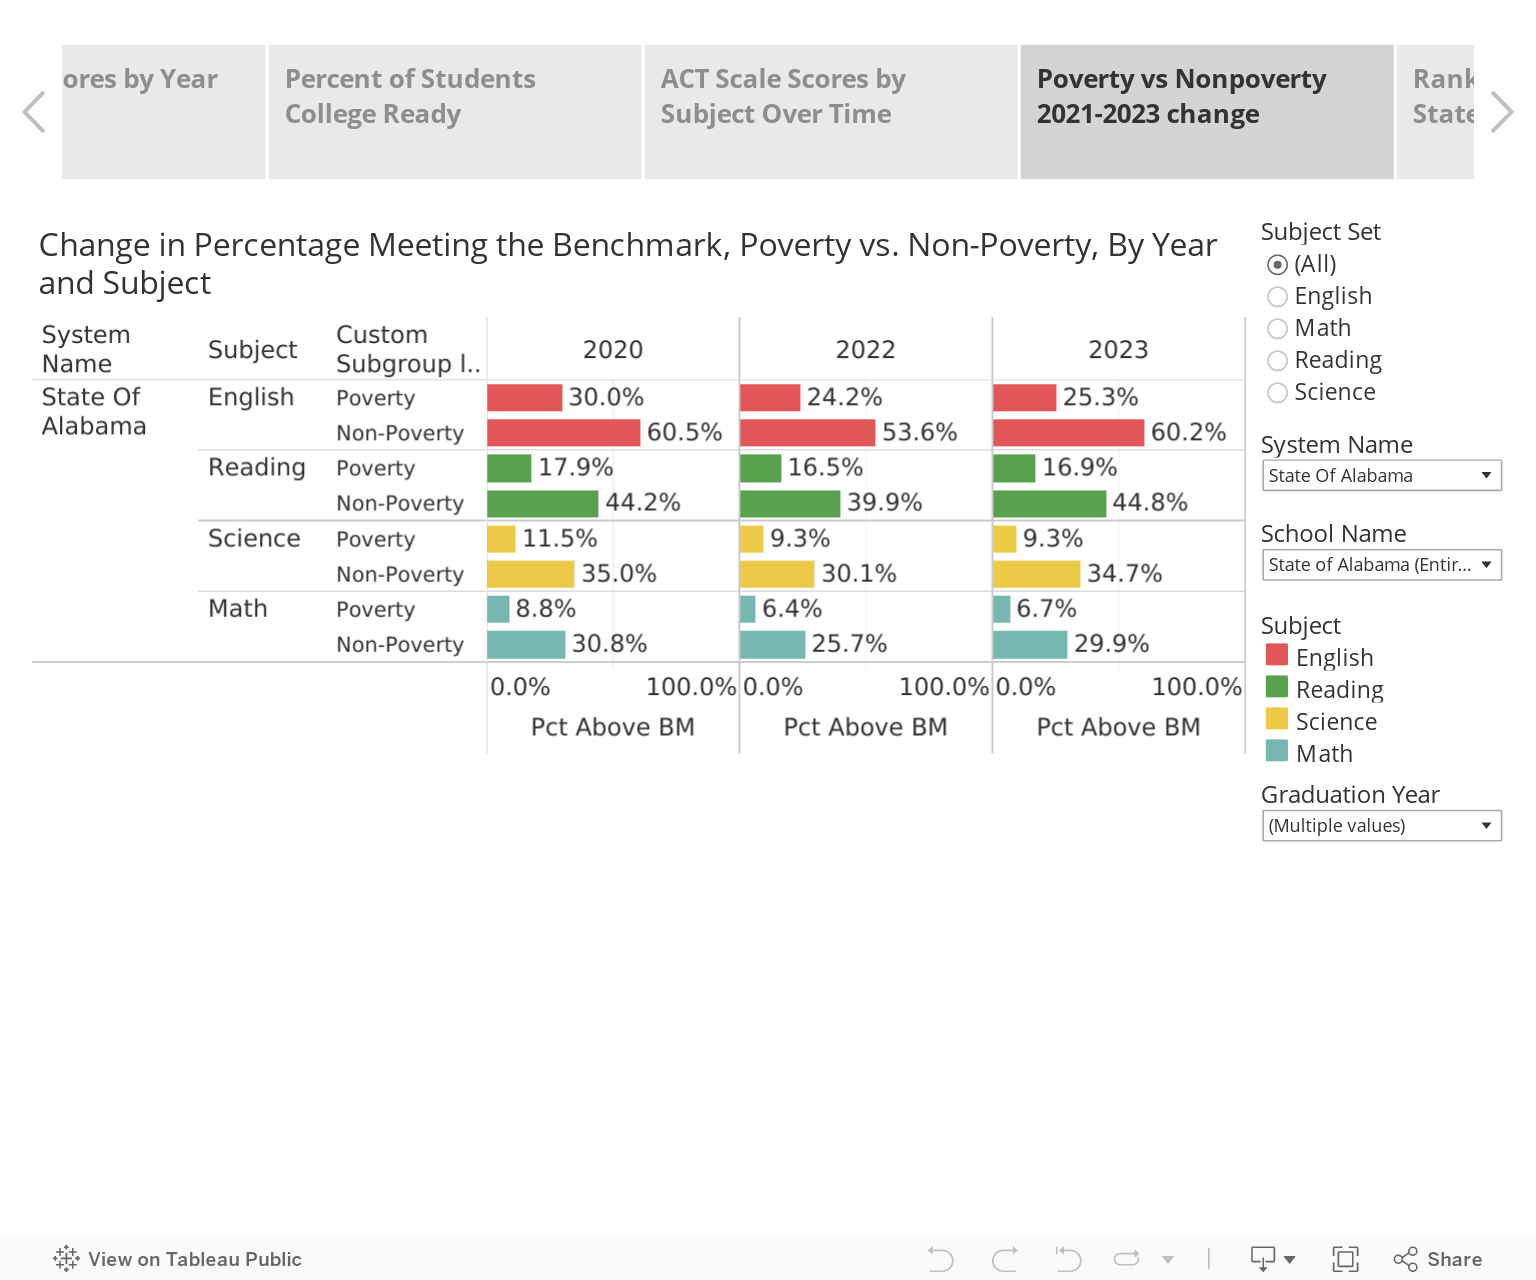
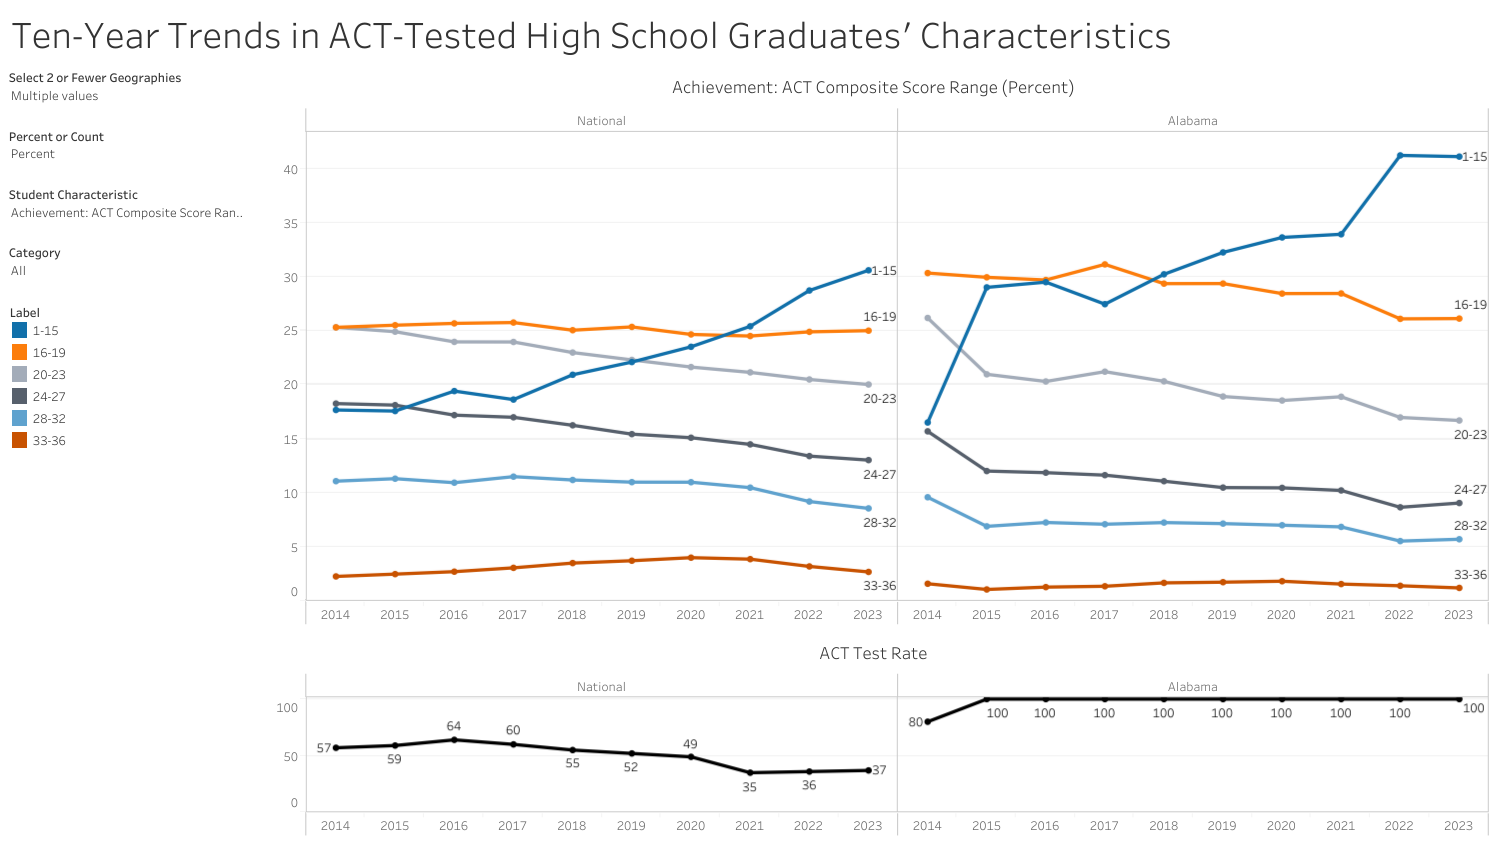
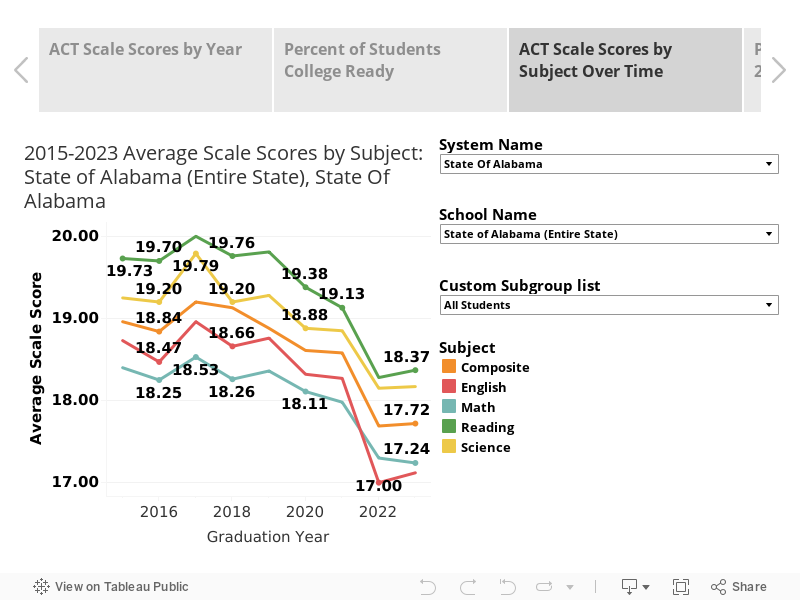
- Earn a benchmark score in a subject test on the ACT: The percentage of students scoring at or above the college-ready benchmark on the ACT was down by 8 percentage points in 2022, to 37%. This rate has been dipping consistently every year and is now down 14% from 2018. A student scoring above the benchmark has a 50% chance of earning a B or above and a 75% chance of making a C or above in that course in college. Covid disruptions may have had some bearing on students’ ability to prepare for and take the ACT, which tests readiness for success in college. Alabama’s drop in performance coincides with a national drop that began before Covid but appears to have been exacerbated by the pandemic.
- Successfully enlist in the U.S. Military: The same percentage of students gained admission to the military, but that represents an increase of from 519 in 2021 to 590 in 2022. However, that total is less than half of what it was in 2018 when 1,129 seniors entered the military after high school.
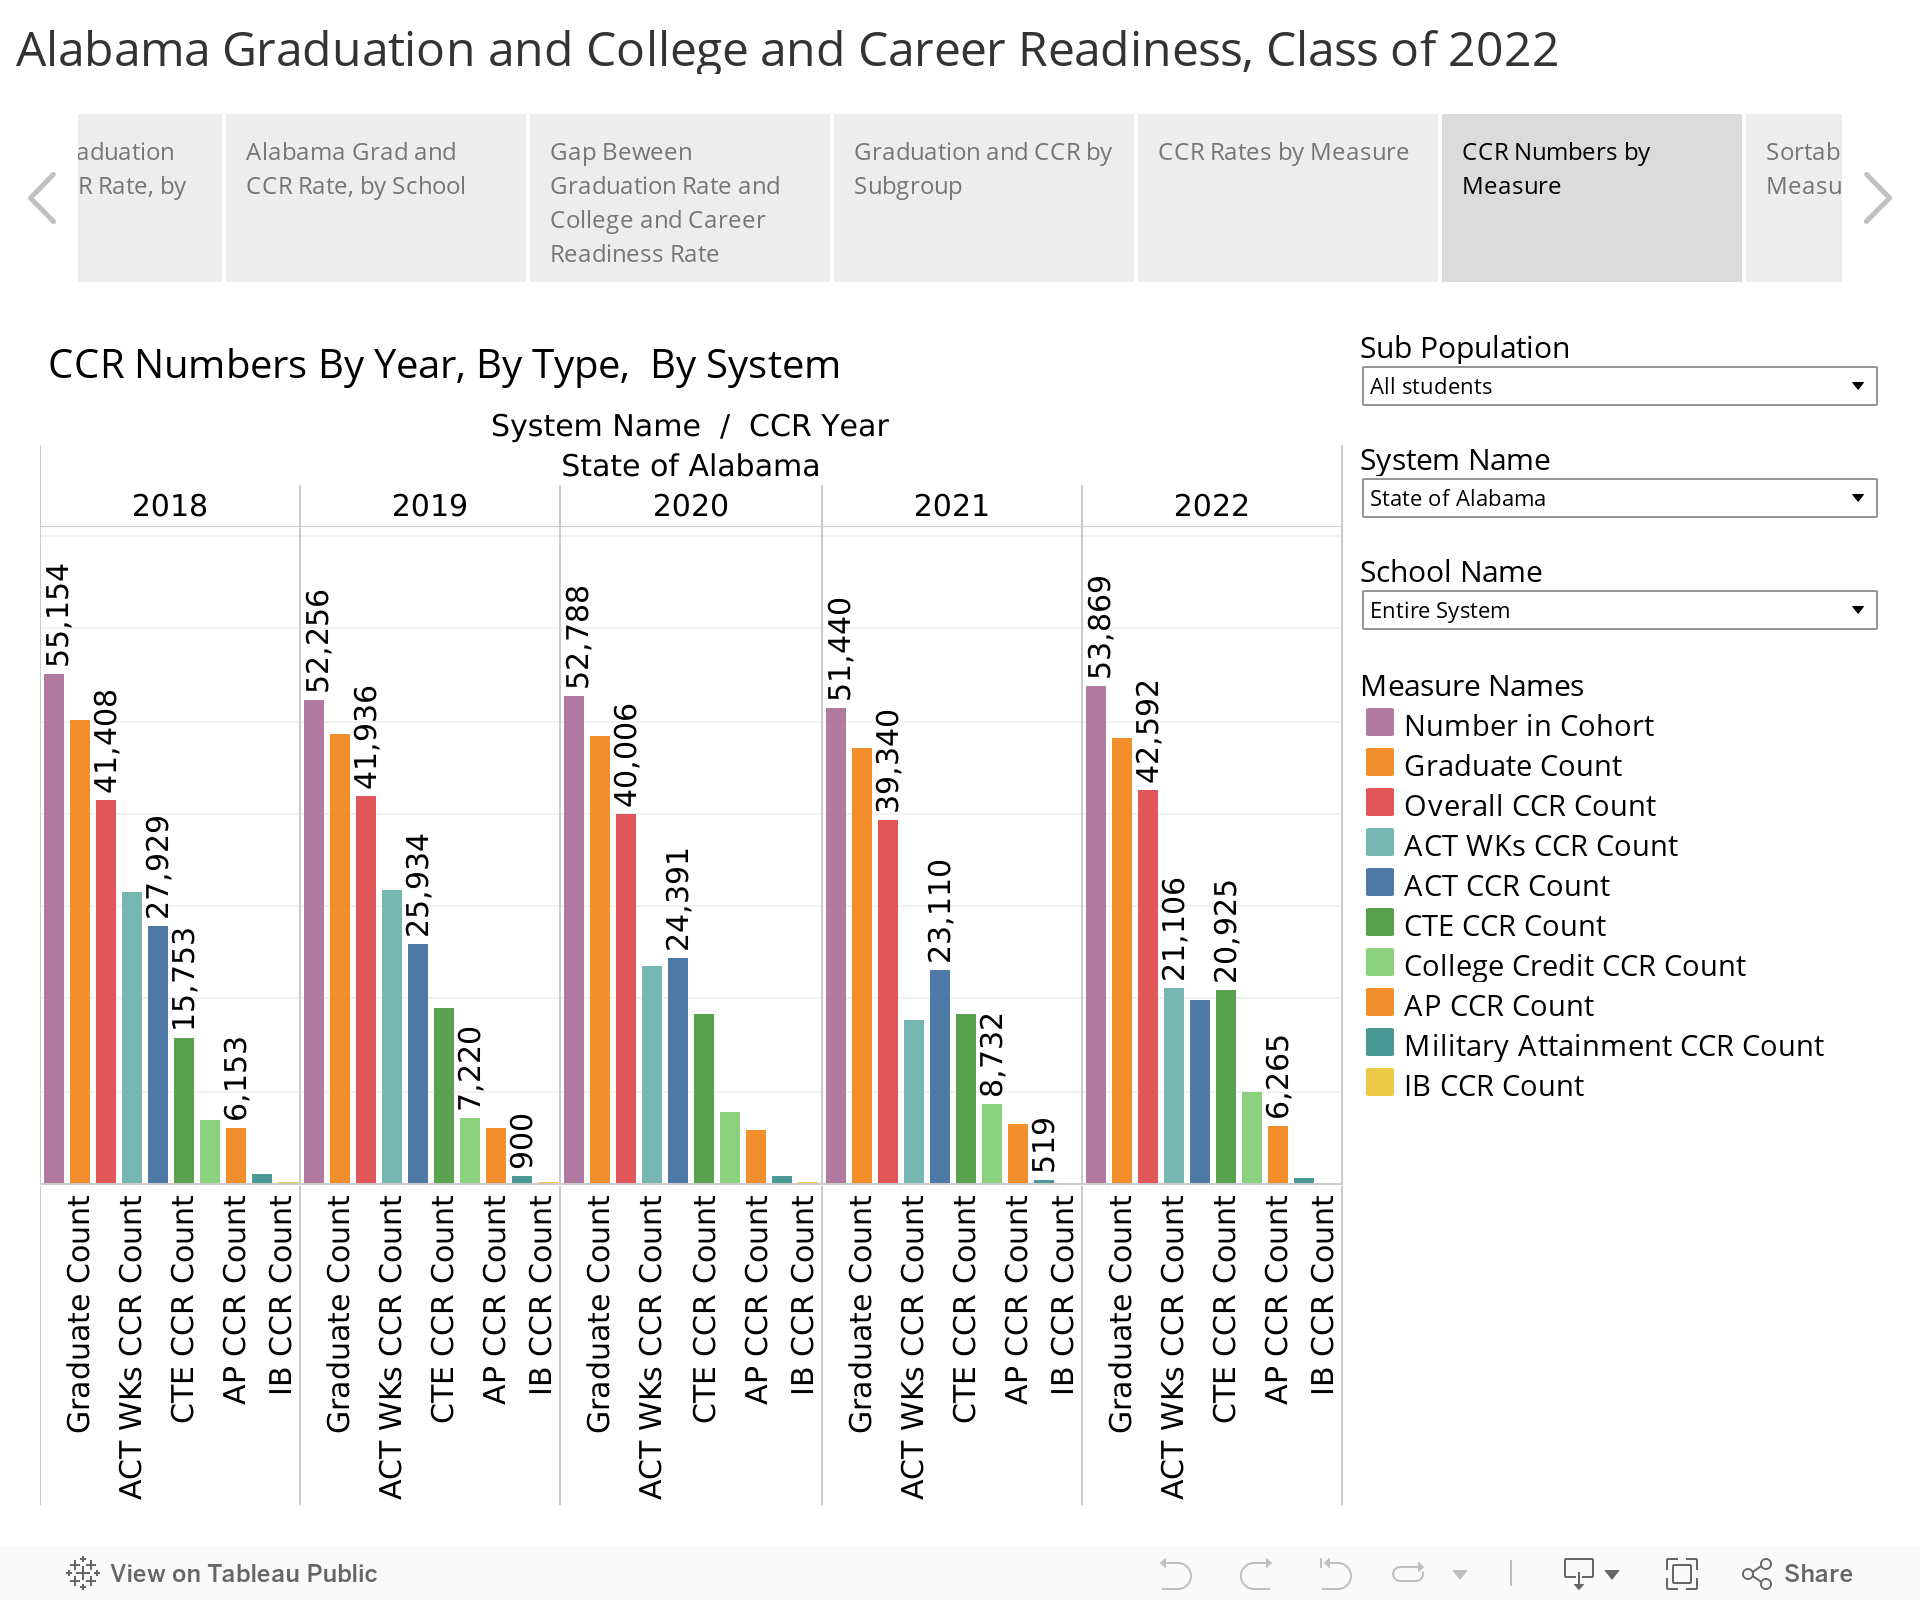
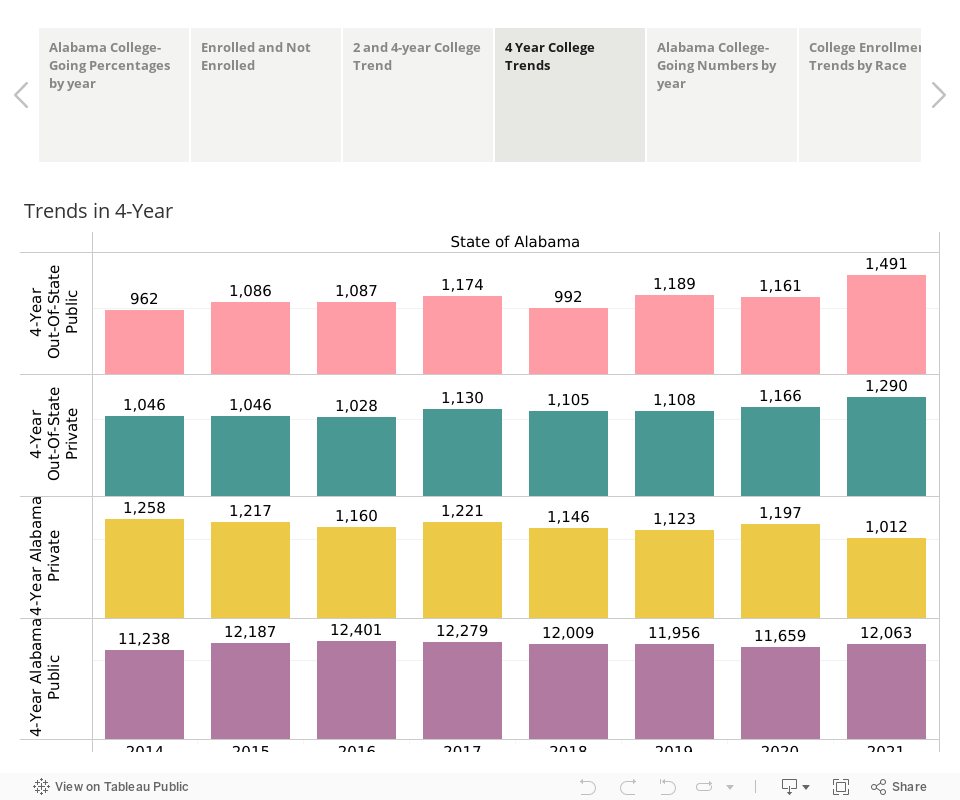
Fig. 3 College and Career Ready, by Number of Seniors Earning
The Class of 2022 deviates from recent trends. Over the past few years, fewer students have been progressing through Alabama public schools. From 2018-2021, class sizes were down 7%. During that time, we saw a 6% decrease in graduates and a 5% decrease in career or college-ready students. In 2022 however, we saw a class size increase of 5%, a 2% rise in graduates, and an 8% rise in career or college-ready students. This symbolizes a return to pre-pandemic numbers. However, the new generation of students is known to be smaller. In light of this and the ongoing elevated demand for skilled workers, Alabama must focus on graduating every student with the skills needed to succeed in higher education and/or the workplace.
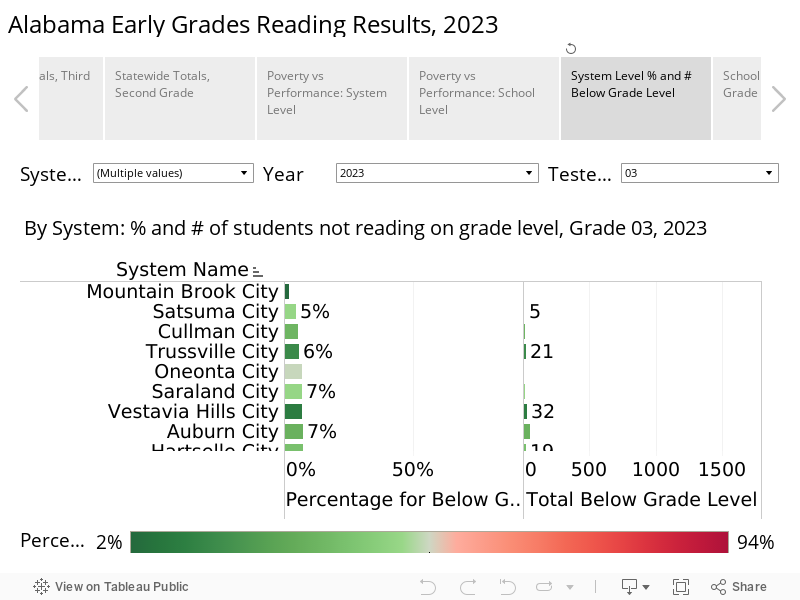
School and System Results
Last year, one system and twenty-four schools reported a 100% on-time graduation rate. This year, one system, Magic City Acceptance Academy, and only fourteen high schools reported a 100% on-time graduation rate. Fourteen high schools reported both 100% graduation and 100% CCR rate. In some schools, a higher percentage of seniors demonstrated college and career readiness than graduated.
Fig. 4 CCR and Graduation Rates by System, 2022
On the other hand, fifteen schools had graduation rates below 75%. Nineteen high schools had CCR rates below 50%. Only nine school systems had a gap greater than 25% between their graduation rate and the college and career readiness rate. In those systems, more than a quarter of students receiving diplomas hadn’t demonstrated their readiness for college or work, despite having met Alabama’s requirements for obtaining a high school diploma.
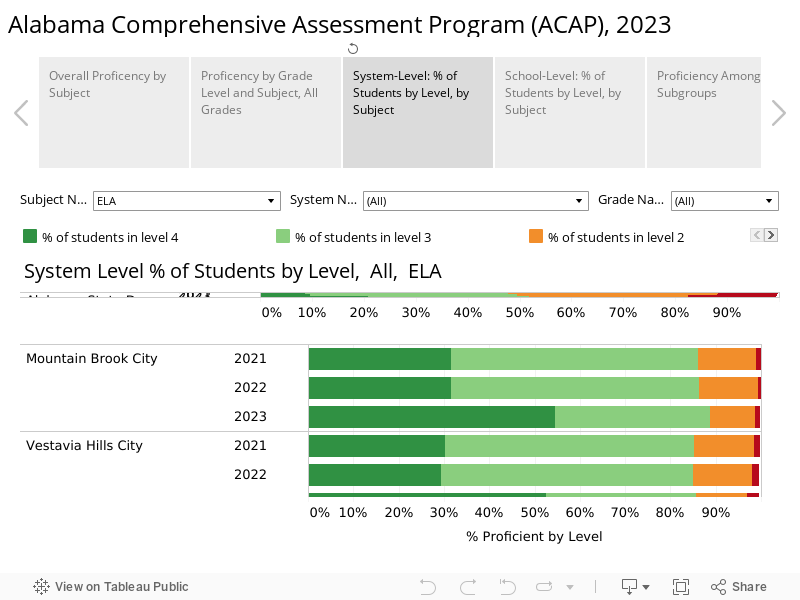
In the visualizations below, school systems and schools can be sorted by either graduation rate or college and career readiness rate. The solid-colored horizontal bar represents the graduation rate; the short vertical bar represents the CCR rate. Through the tabs above the visualization, other data is accessible, including a graph of the gap between the graduation and CCR rate by system.
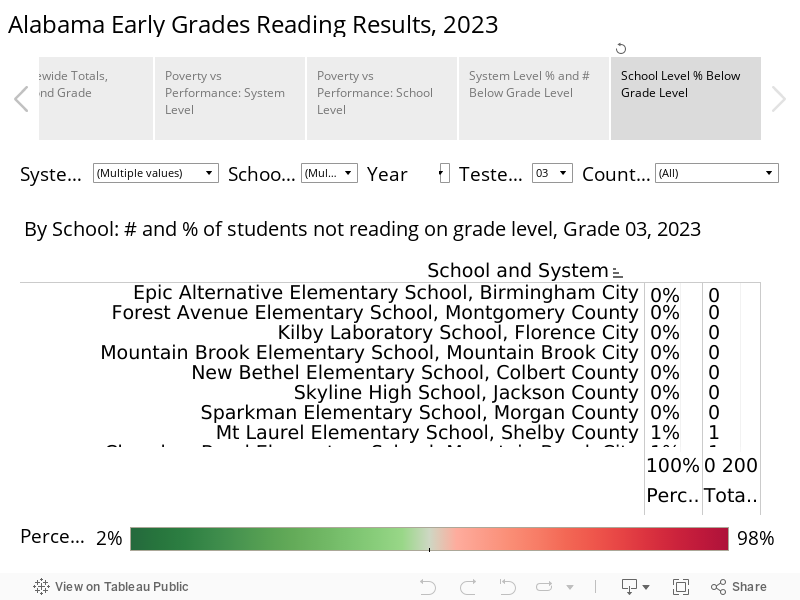
The same set of sortable data is available by school. In order to protect student privacy, results for small subpopulations of students are not presented.
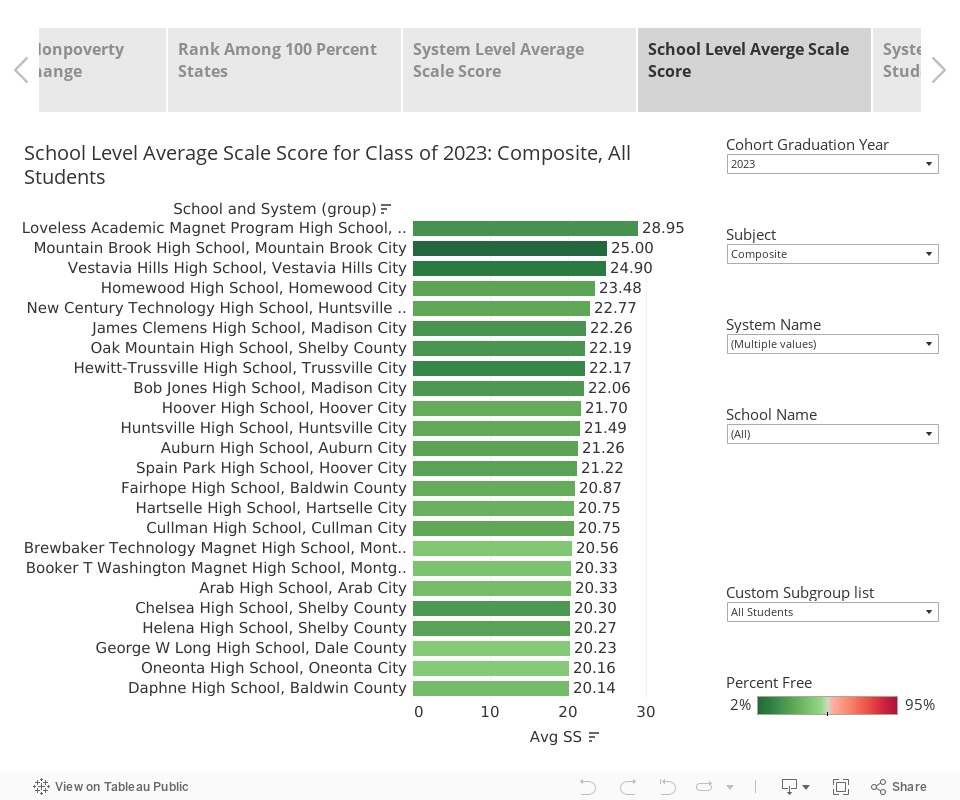
Fig. 5 CCR and Graduation Rates by School, 2022
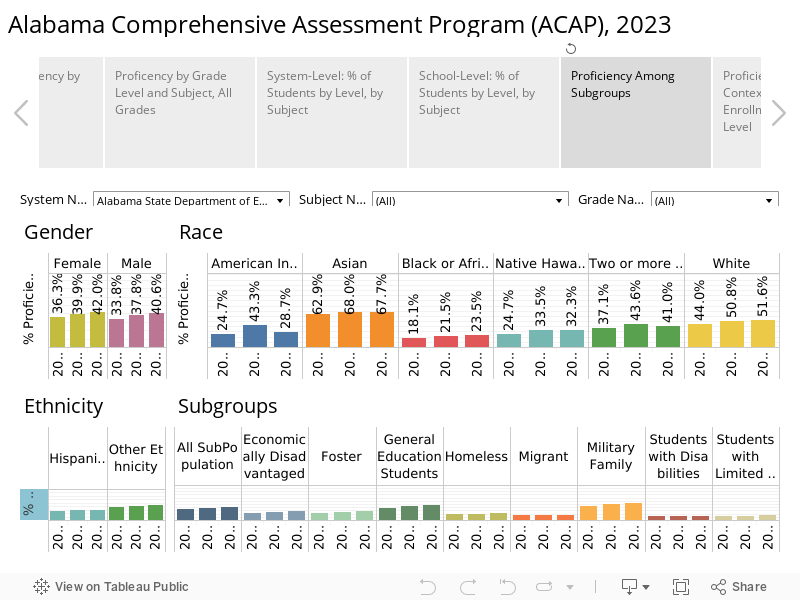
Gaps Between Subgroups
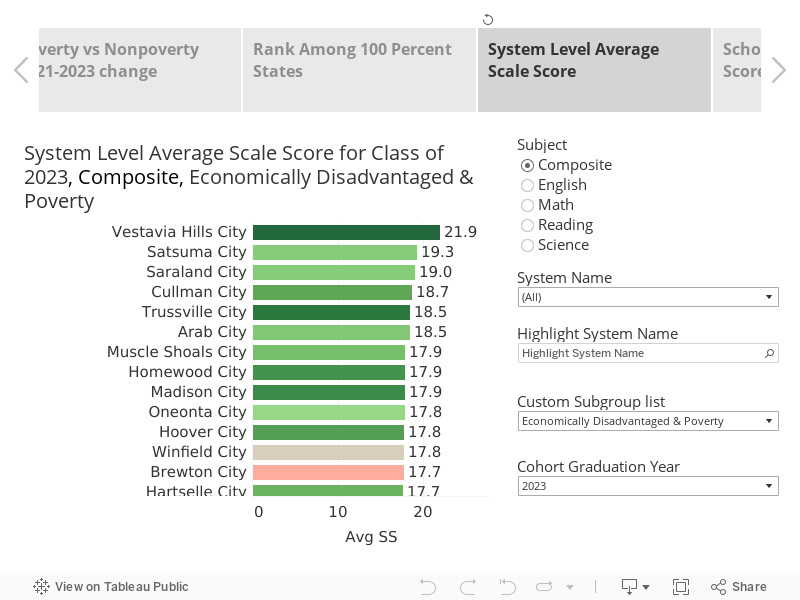
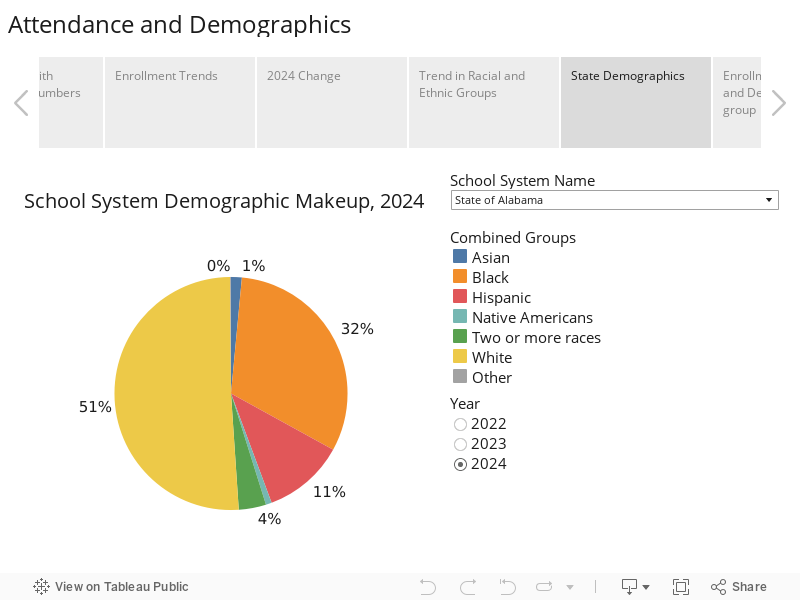
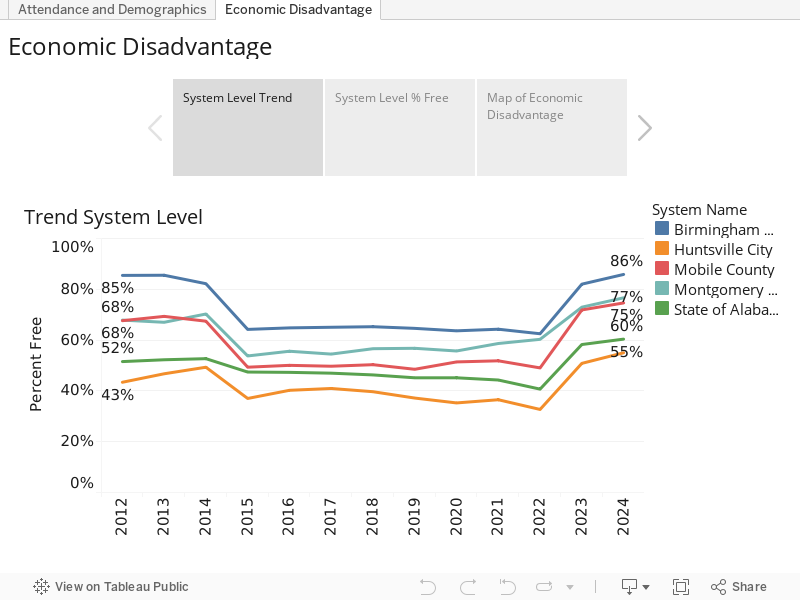
Historically, there have been gaps in the high school graduation rate between students of different races. In 2022, the gaps in graduation got slightly bigger, and the gap in overall CCR was slightly reduced. Some trends seen in past years are continued or even exaggerated. CCR rates for economically disadvantaged students are well behind those of non-economically disadvantaged students. Examining the subcomponents of CCR, the gap is widest on the ACT despite everyone achieving lower numbers from years past.
Only 18% of Blacks and 22% of Hispanics benchmarked in a subject on the ACT, compared to 47% of whites. Asians are much further ahead, with 68%. By contrast, there is almost no racial gap in college and career readiness rates in career technical education: 38% of Black students earned an industry-recognized credential through CTE compared to 40% of whites and 40% of Hispanics.
Fig. 6 CCR and Graduation Rates by Subgroup, 2022
WorkKeys
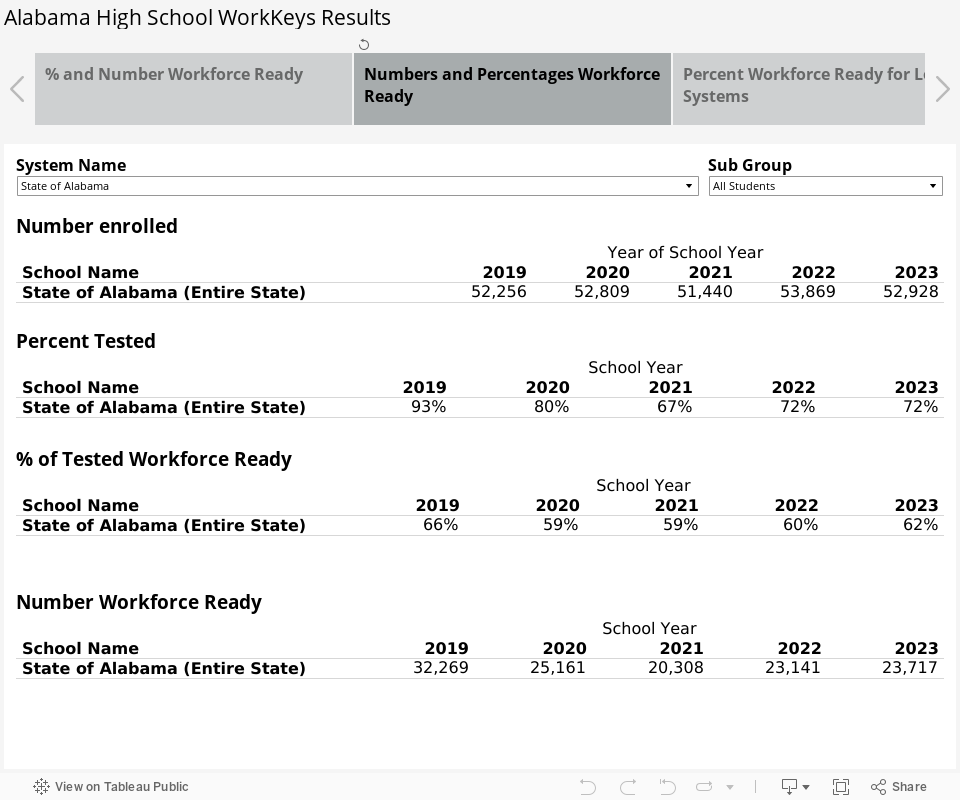
The number of high school seniors taking ACT’s WorkKeys Assessment increased by almost 4,000 in 2022, a major reversal in a downward trend in the use of the test.
Along with higher participation, a higher percentage (60%) and a greater number of students (2,833) qualified as college and career ready as a result of their scores.
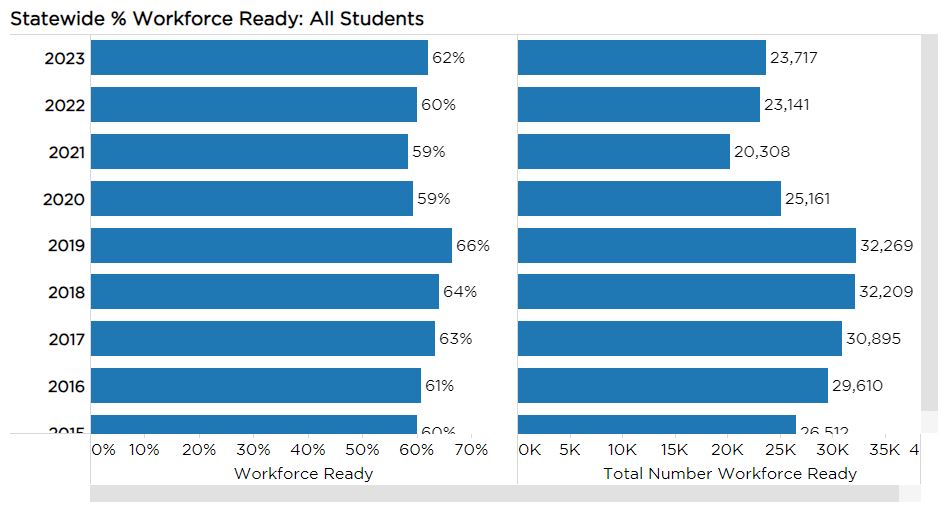
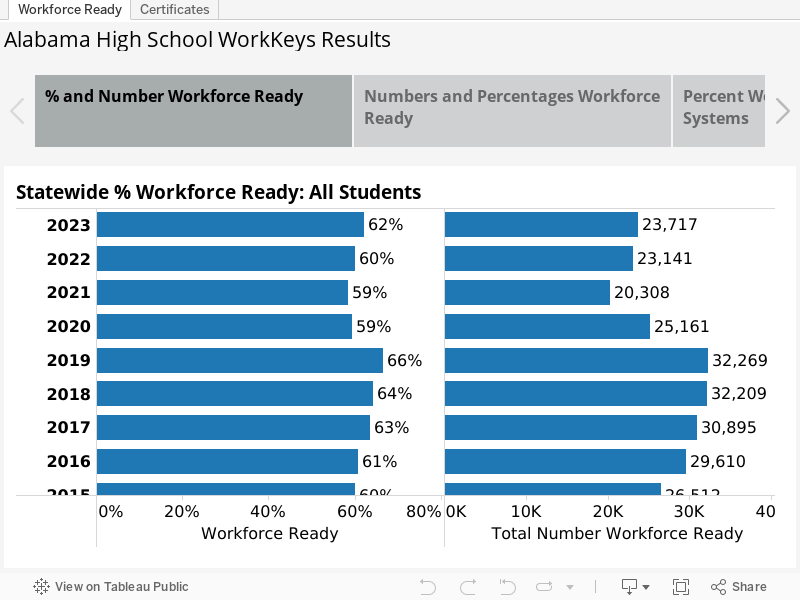
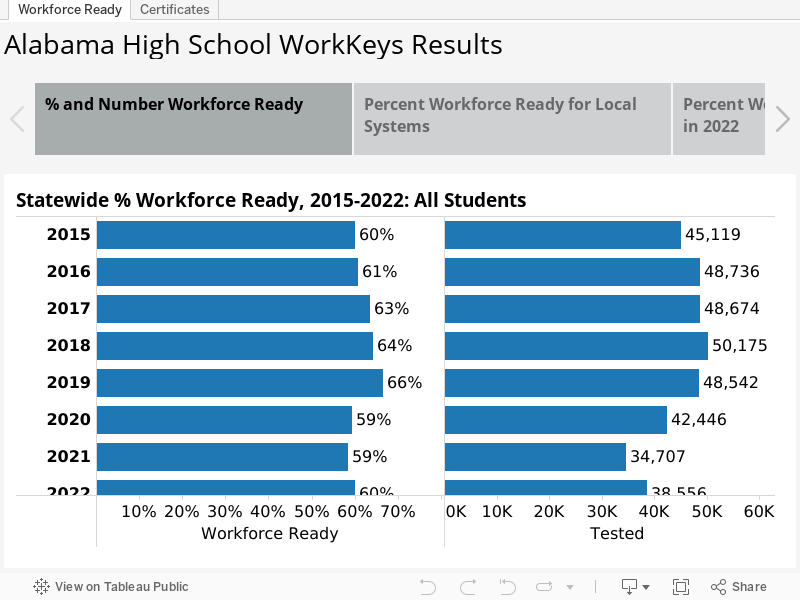
Fig. 7 WorkKeys Results, Statewide Trends
WorkKeys is given to seniors and is designed to measure practical math, reading, and graphical literacy skills as they are employed in the workplace. That’s different than the ACT, which tests for knowledge and skills needed in a college classroom.
WorkKeys was given to all seniors through 2019, but the State Department of Education stopped mandating the test in 2019. While some systems still test all seniors, some systems make the test an option for students who haven’t demonstrated college and career readiness by another measure.
Some businesses, particularly industrial employers, build WorkKeys into their hiring practices. They have determined what level of proficiency, as measured by WorkKeys, is needed in particular jobs. Depending on their test performance, students earn a platinum, gold, silver, or bronze National Career Readiness Certificate. A student scoring Silver or above is considered college and career ready.
Jefferson, Mobile, Montgomery, Limestone, and Lauderdale County systems, as well as city systems in Huntsville, Birmingham, Florence, and Madison recorded large increases in the number of students taking WorkKeys and successfully earning credentials.
Fig. 8. Number of Students Workforce Ready 2022 and Change from 2021
The visualizations that follow present WorkKeys results statewide and in systems where more than 90% of seniors took the test. The percentage of students scoring workforce ready are those that score Silver or above.
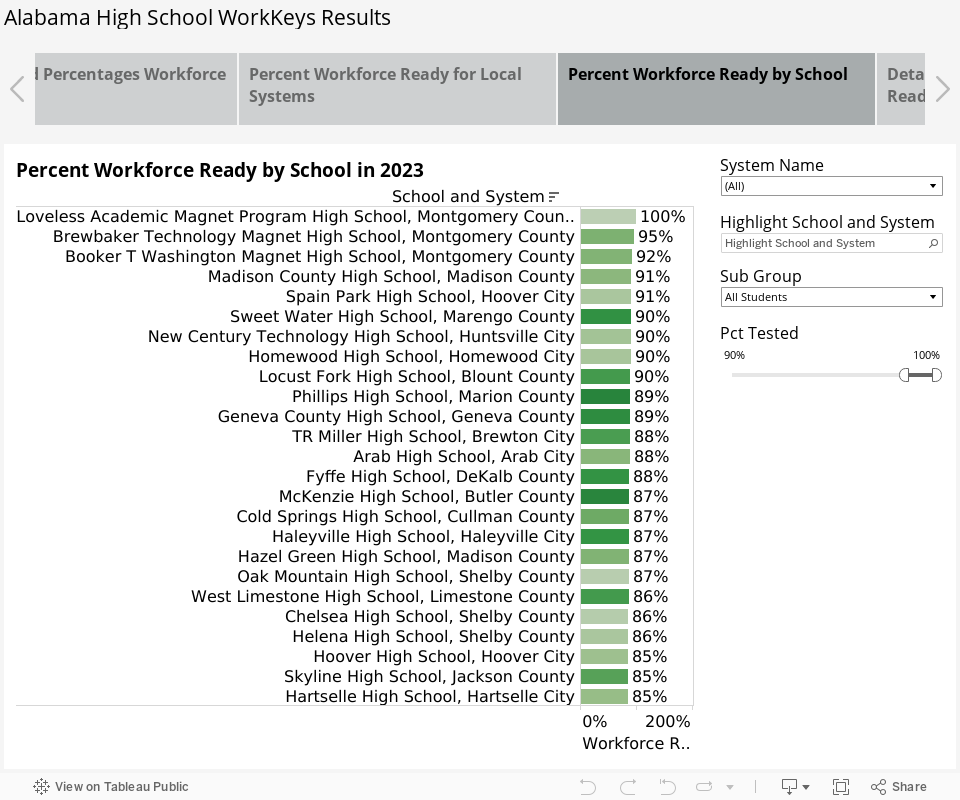
Fig. 9. Percentage Workforce Ready by System, 2022
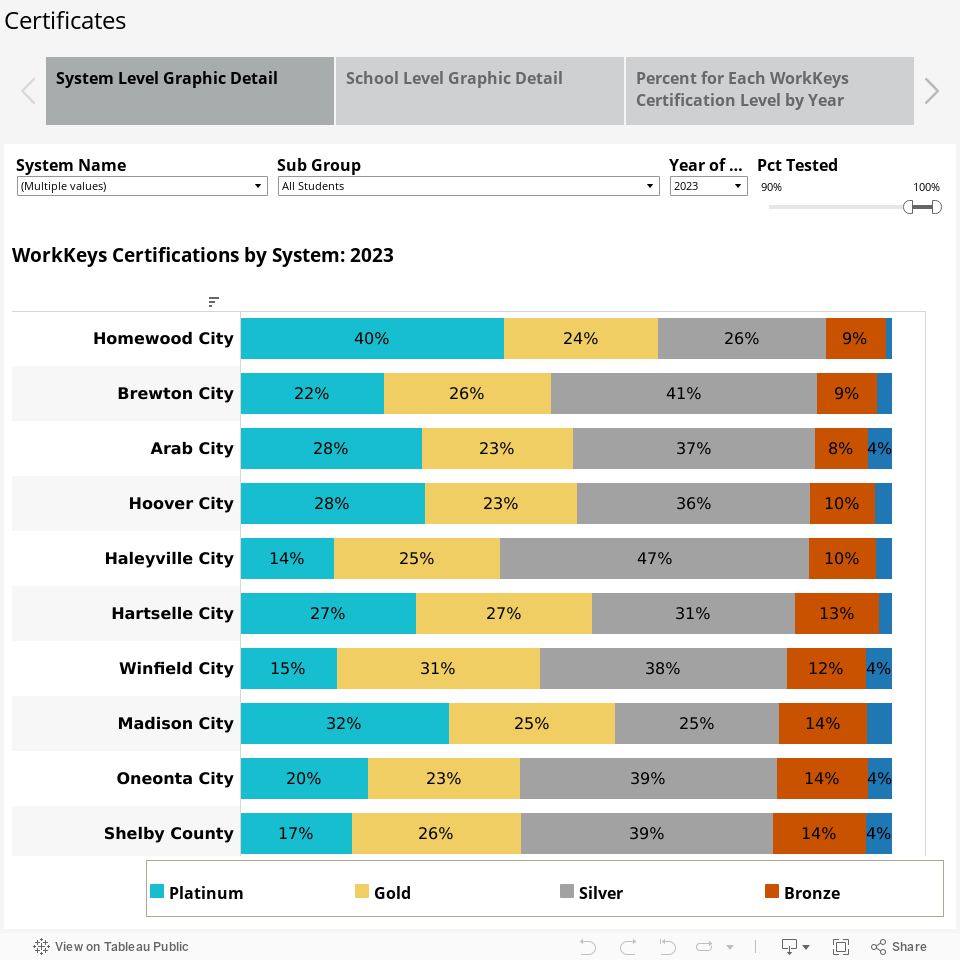
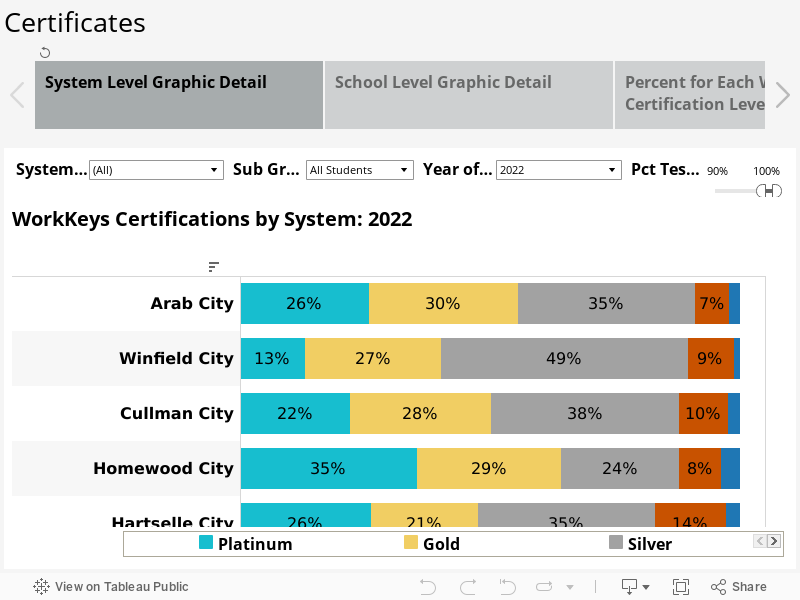
The visualization below presents the results in a more detailed fashion. Each color represents the percentage of tested students scoring at each level: platinum, gold, silver, bronze, and no certificate earned.
Fig. 10. WorkKeys Results, by Level of Certification, 2022