Alabama May be Catching on but Not Enough to Catch up
New estimates from the U.S. Census Bureau show Alabama attracting
more migrants from other U.S. states, but the state likely doesn’t have enough
population momentum to avoid losing a congressional seat after this year’s Census
count.
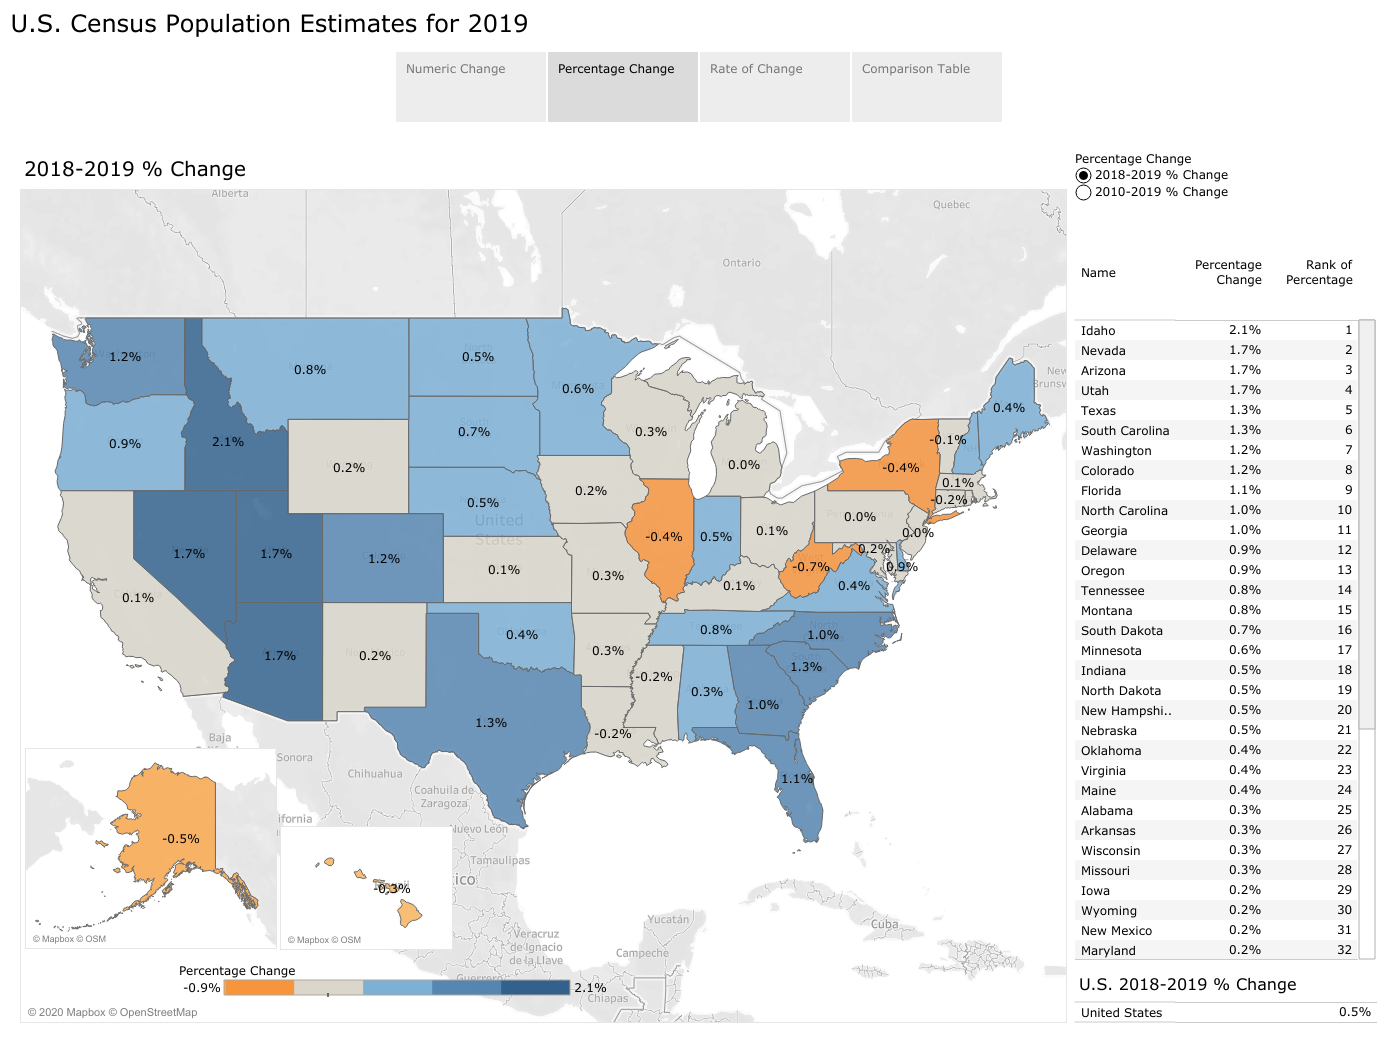
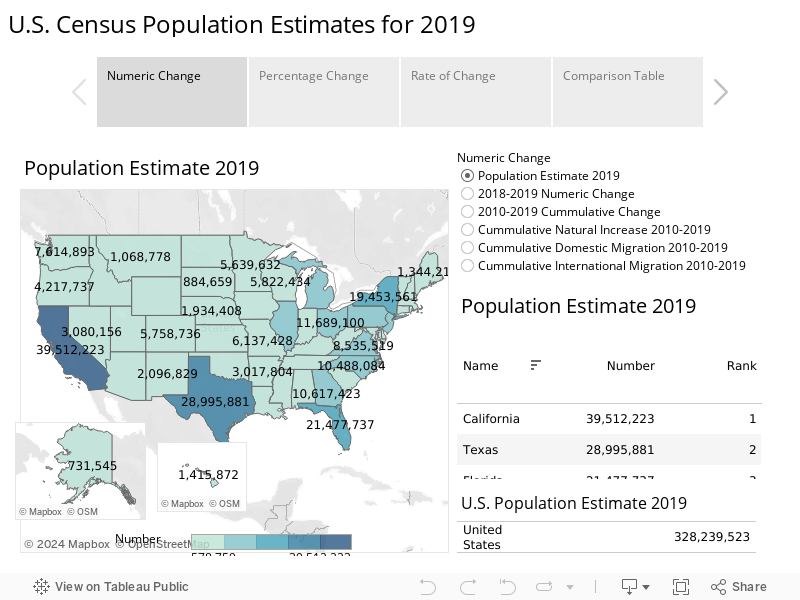
Alabama added 15,504 residents between July 1, 2018, and July 1, 2019, the period covered by the estimates. Only one other year this decade, 2012, did Alabama add as many new residents. Since the 2010 census, Alabama is estimated to have added 123,060 new residents. PARCA’s interactive charts allow you to explore the new statewide estimates. The button on the bottom right allows for a full-screen display.
That 2019 performance ranks Alabama 20th in numeric change and 25th in percentage change among the states. Ten states, including Mississippi, Louisiana, and West Virginia lost population in 2019, according to the estimates.
The net number of residents moving to Alabama from other states was 9,387, by far the highest total in domestic migration since 2010. During the middle years of the decade just-ended, Alabama was losing residents to other states.
Alabama’s birth rate, 11.7 per 1,000, is also slightly
higher than the national average of 11.6 per 1,000. Census estimates that 57,313
new Alabamians were born in 2019.
However, Alabamians die at a higher rate than people in other states. Among U.S. states, only West Virginia has a higher death rate. Alabama saw 53,879 deaths in 2019, according to the estimates. That’s a rate of 11 deaths per 1,000 population, compared to 8.7 per 1,000 nationally. As the population ages, the death rate in Alabama and across the U.S. has increased over the course of the decade, while the birth rate has declined.
Alabama is also in the bottom 10 states when it comes to attracting international migrants. The Census Bureau estimates Alabama had a net gain of 2,772 international immigrants in 2019, compared with a gain of 3,379 the year before.
The 2019 net gain was the smallest gain through international immigration for Alabama since 2010. Before 2016, the state saw several years in which international immigration was contributing a net of 5,000 new residents to the state each year. Alabama is not the only state to see a drop-off. Nationwide, the number of new residents moving to the U.S from abroad was estimated to be 595,348 in 2019. That compares to more than 1 million immigrants moving to the U.S. in 2016.
While Alabama is seeing modest population growth, its growth
rate is under the average for the South.
The Census South region includes many of the fastest-growing states in the country: North and South Carolina, Florida and Texas, Georgia and Tennessee. Overall, the states in the region grew by 9.6% since 2010. Alabama’s population grew by 123,060, or 2.6% over the same period.
North Carolina, which has added almost 1 million people since the last Census, and Florida, which has added almost 2.7 million, are expected to gain additional representation in Congress.
Mississippi’s Progress Not a Surprise; It was Part of a Plan
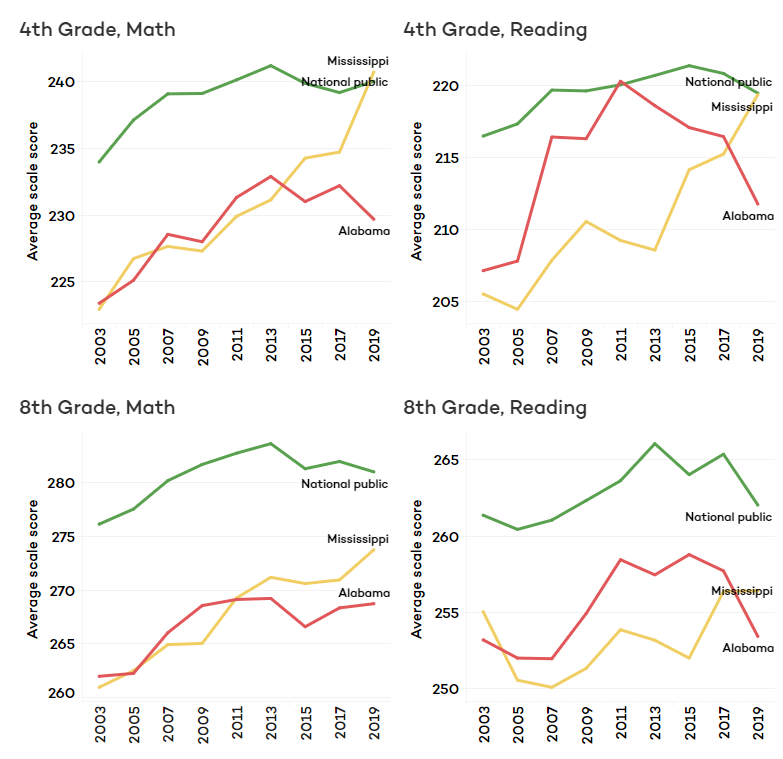
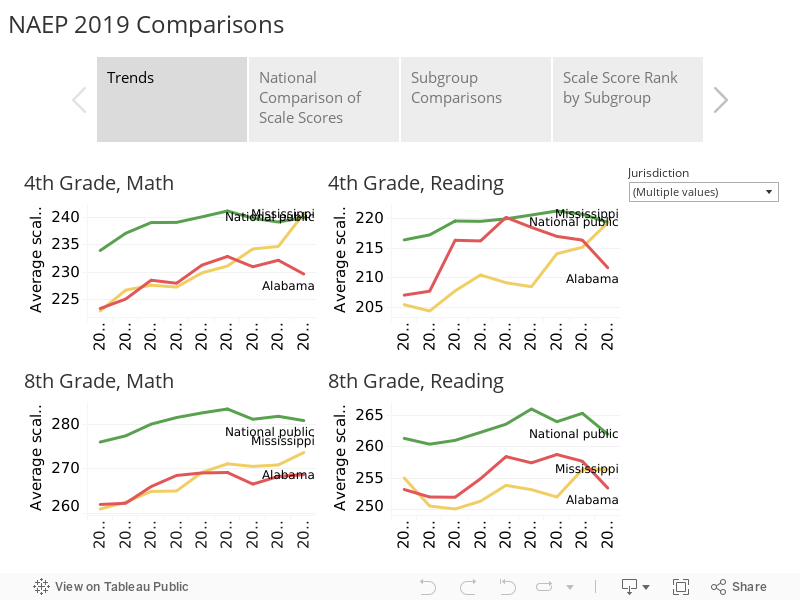
When the 2019 results of the National Assessment of Educational Progress (NAEP) were released last week, the good news was that fourth-grade students in our neighbor state, Mississippi, scored at the national average in both reading and math and that eighth graders there made significant gains in reading and math as well.
On all four measures, the average score for Mississippi students exceeds those of Alabama students, despite Mississippi’s higher level of poverty and higher percentage of students of color. The interactive chart below traces the average scale scores for Alabama and Mississippi students on the NAEP since 2003 on each of the four measures. The green line represents the average of public school students nationally. Other tabs in the chart allow you to explore other ways of looking at the data, including comparing demographically similar groups of students across states. In each of the main demographic and economic categories, Mississippi students are outperforming Alabama’s. The NAEP reading and math assessments are given every two years to a sample of students in each state, the sample representing the demographics of the state. It is the same assessment from year to year, and it is administered nationally. Known as the Nation’s Report Card, NAEP serves as the principal national measure of academic proficiency for U.S. education.
Mississippi has had a consistent and cohesive educationally-focused leadership in the Governor’s office, the State Legislature, and at the Mississippi Department of Education. Current superintendent Carrie Wright was recruited in 2013 from a leadership position in the District of Columbia’s rapidly improving public schools. Under Wright, and with the backing of an appointed state school board, Mississippi has operated under a plan that includes goals, objectives, and clearly articulated strategies aimed at meeting those goals. To track progress on the implementation of strategies and progress toward goals, the superintendent delivers an annual update that details actions taken to advance toward those goals.
Mississippi borrowed some aspects of its approach to improving reading from Alabama’s Reading Initiative. And more recently, Alabama borrowed from the Mississippi model. Earlier this year, the Alabama Legislature adopted a Literacy Act, similar to a Literacy-Based Promotion Act Mississippi adopted in 2013. Mississippi developed its own student assessment test for grades 3-8, MAAP, which was first deployed in the 2015-2016 school year. Alabama hopes to deploy its own state-developed assessment in the spring of 2020.
Over the long term, both Alabama and Mississippi have made progress in both reading and math. However, during Superintendent Wright’s tenure in Mississippi, Alabama has had five different superintendents. The State Department of Education did develop a state plan for education, Plan 2020, in 2012, but it was never fully developed and implemented and was shelved as subsequent superintendents came and went.
Reading
In 2011, just eight years ago, Alabama enjoyed the national spotlight when NAEP was released. Alabama fourth graders scored at the national average, having made the largest improvements in the U.S. That growth coincided with and has been generally attributed to the Alabama Reading Initiative (ARI). ARI emphasized a schoolwide commitment to getting all students reading at grade level, with an emphasis on Kindergarten through third grade. ARI placed a reading coach in every Alabama elementary school and required intensive professional development to teachers on research-based approaches to teaching reading.
However, after that achievement, and in the face of a constrained budget, funding for ARI was reduced, and schools were allowed to repurpose the state-funded reading coaches for other purposes. Reading scores on NAEP began drifting and in 2019 dropped sharply in both fourth and eighth grades.
Earlier this year, the Legislature adopted the Literacy Act, which will require that third graders be able to read, or they will be held back to repeat third grade. The Literacy Act, modeled after similar legislation in Mississippi and other Southeastern states, is expected to add urgency to reading instruction and to addressing reading challenges like dyslexia. ARI’s funding was also increased by $6.5 million, though at $51 million per year, that’s still far from the $64 million it received at its peak in 2008. Education leaders say the program will be restored to fidelity.
Math
While the 2019 reading results on NAEP were distressing for the severity of the drop, the math results for Alabama students were equally disturbing. Alabama school children in both the fourth and eighth grade had the lowest average test scores in the United States. It’s a familiar position for Alabama. Alabama ranked behind all other states in 2015. In 2017, Alabama students climbed a couple of notches in the rankings, but slipped back into last this year.
The state’s strategy for addressing math is less clear. In March of 2019, Gov. Kay Ivey put on hold new math standards, which had been developed by a statewide panel of educators. Ivey postponed adopting the changes to the math course of study after some conservative groups, who are opponents of the Common Core state standards, voiced their objections. In a letter to State Superintendent Eric Mackey, Ivy asked that Alabama’s new proposed math curriculum be compared to the math course of study for the top six performing states on the NAEP: Massachusetts, Minnesota, the Department of Defense’s educational system, Virginia, New Jersey, and Wyoming.
Considering Mississippi’s results, its approach to math should be examined as well. Mississippi did adopt the Common Core standards. Judging by national results, it safe to say that Common Core did not cause NAEP scores to leap. But it’s also true that states that did not adopt the Common Core have seen declines on the NAEP as well. Other factors may be contributing to an overall stagnation in educational progress. However, with Mississippi bucking the trend, Alabama would be well served to take note and inspiration from our neighbor’s progress.
ACT WorkKeys – An Assessment of Workforce Readiness Among High School Graduates in Alabama
The WorkKeys Assessment is a standardized test given to 12th graders in Alabama public schools. The assessment is meant to measure skills relevant to many of today’s work environments.
In 2018:
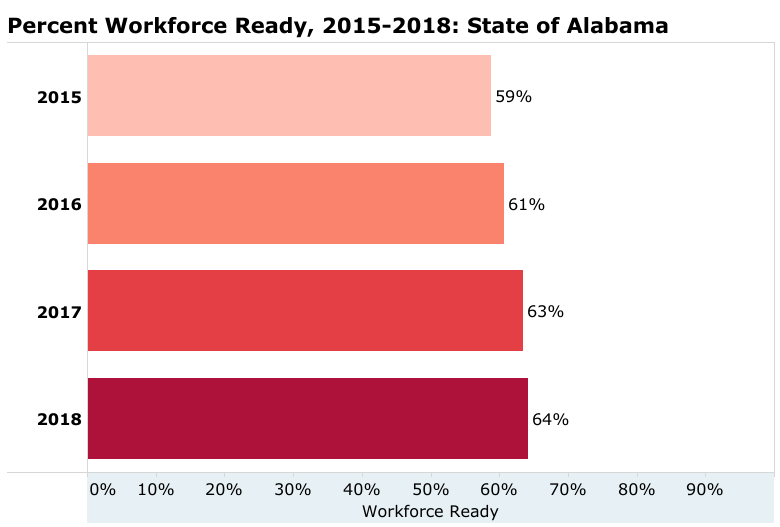
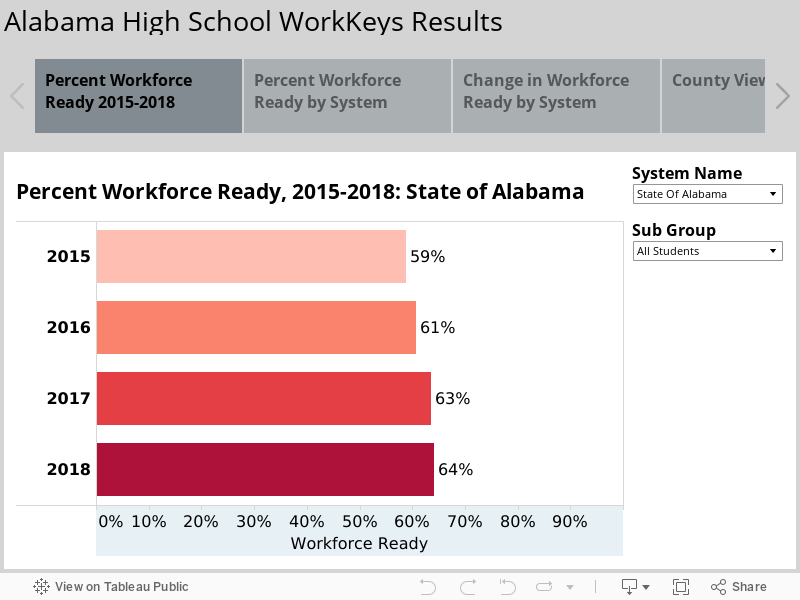
64 percent of Alabama high school graduates in 2018 were deemed workforce ready as measured by the ACT WorkKeys assessment, a year over year improvement of a half percent.
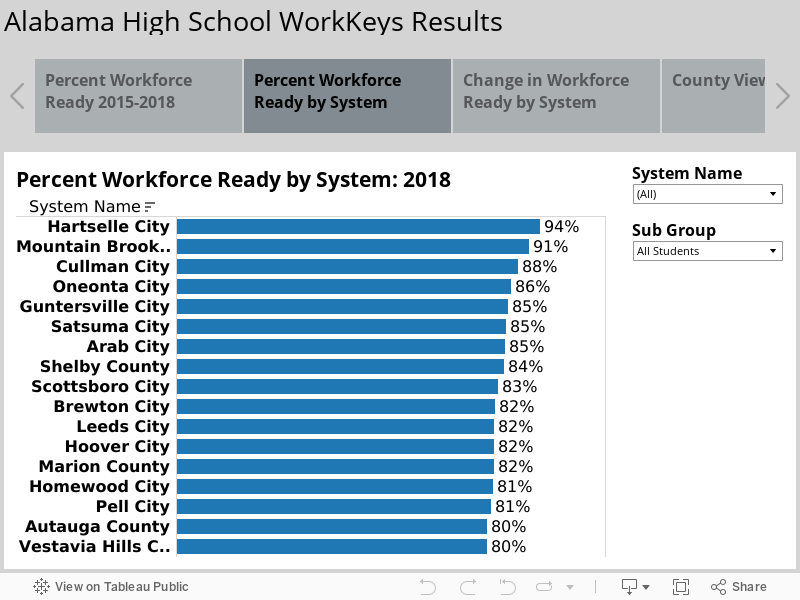
At 94 percent, Hartselle had the highest percentage of workforce ready graduates, as measured by WorkKeys.
High fluctuations occurred among the different certificate levels, with Platinum (highest level) and Gold dramatically increasing, but Silver decreasing. Bronze (below workforce ready) increased, though the percent not earning a certificate decreased.
What is WorkKeys?
The WorkKeys assessments are meant to provide a meaningful assessment of applied cognitive skills useful in contemporary work settings. It is also one of the components of Alabama’s College and Career Ready measure.
The assessments do not measure a student’s attitudes about work, dependability, interpersonal skills, teamwork, communication skills, or instincts for creativity, innovation, or leadership. They also do not provide insight about a student’s competency for a job requiring specialized knowledge and skills.
The Assessments. The assessments consist of three tests of applied cognitive skills which are relevant, according to ACT’s research, to over 20,000 occupations:
The Applied Math test measures critical thinking, mathematical reasoning, and problem-solving techniques for situations in today’s workplace.
The Graphic Literacy test measures the skill needed to locate, synthesize, and use information from charts and graphs.
The Workplace Documentstest measures the skills needed to read and understand written text such as memos, letters, directions, signs, notices, bulletins, policies, and regulations on the job.
Students are awarded a National Career Readiness Certification in they score a Platinum, Gold, Silver, or Bronze score on the WorkKeys.
Platinum: These are students with the highest level of applied cognitive skills. According to ACT, students at this level have demonstrated applied foundational skills for 96 percent of the occupations in the ACT jobs dataset.
Gold: Those earning a Gold level certificate should have the applied foundational skills for 90 percent of jobs in the database.
Silver: Students scoring at the Silver level should have the applied foundational skills for 71 percent of jobs in the ACT database.
Bronze: Students earning a Bronze certificate are judged to be ready for 16 percent of jobs.
In Alabama students earning a Silver certificate or above are considered career ready.
2018 Assessment Results
The following charts show the percent of graduates in Alabama who demonstrated workforce readiness on WorkKeys assessments at the state, local system, and school level.
Percent Workforce Ready Remained the Same. The first chart shows that in 2018 64 percent of high school graduates in the state were deemed workforce ready as measured by WorkKeys. The percent steadily increased from 58.8 percent in 2015 to 60.8 percent in 2016 and 63.5 percent in 2017. The increase from 2017 to 2018 was comparatively small, with both years rounding at 64 percent workforce ready.
Workforce Ready at the System Level
Listed below are the top ranked systems based on workforce readiness assessed through WorkKeys:
Hartselle City – 94 percent of students
Mountain Brook – 91 percent of students
Cullman – 88 percent of students
Oneonta – 86 percent of students
Guntersville -85 percent of students
There does appear to be some correlation between performance on the WorkKeys and the ACT exam, but not an exact one-to-one match. For example, some systems achieved a comparable state ranking on both sets of assessments:
Mountain Brook was number 1 on the ACT and 2 on WorkKeys
Shelby County was 8th on the ACT and 8th on WorkKeys.
However, other systems saw a larger separation.
Vestavia Hills was 2nd on the ACT and 16th on WorkKeys.
Madison City ranked 4th on the ACT and 18th on WorkKeys.
Trussville was 6 and 25, respectively.
All of the systems in the top 10 on the ACT are in the top 25 on WorkKeys, except Auburn.
At the same time, a number of less affluent systems demonstrated progress on the WorkKeys assessment over the previous year. Those systems showing the most improvement over 2017 included:
Perry County – 28 percent increase
Elba – 27 percent increase
Alexander City – 25 percent increase
Thomasville – 21 percent increase
Sheffield – 18 percent increase
Change in Certificate Levels
Significant Growth in Platinum and Gold Certificates. Students are deemed workforce ready if they achieve certification at the Platinum, Gold, or Silver levels. The charts show that the percent at each of these levels from 2015 through 2017 increased moderately each year and the distribution of students across the different levels remained about the same. However, ACT’s decision to change one of the tests for a new one apparently led to dramatic changes in the scoring of the WorkKeys test, producing far more Gold and Platinum level certificates:
Platinum certificates dramatically increased from essentially zero percent all three previous years to 10 percent of students in 2018.
Gold certificates, remaining fairly stable around 15 percent in the previous three years also showed a more significant increase to 19 percent in 2018.
Silver certificates dropped to 35 percent in 2018 after increasing to from 43 percent in 2015 to 48 percent in 2017.
Overall, this resulted in roughly the same percent workforce ready, but with a positive trend toward higher certification levels. Furthermore, while the percent of Bronze certificates increased, the percent with no certificate decreased. This is a positive trend with more students edging toward the readiness threshold.
Change in Certificate Levels at the System Level
Platinum: None of the systems decreased at the Platinum level. While a fair number showed no growth, the vast majority increased. In 2017,Sheffield generated the highest percent of Platinum level students of any system in the state at only two percent of its students. All other systems were at zero or one percent. In 2018, Mountain Brook increased from one percent to 41 percent, followed by Homewood, which increased from one percent to 29 percent. Each of the remaining schools in the 2018 top ten increased from one percent or less to 20-29 percent. Sheffield increased from two to 11 percent.
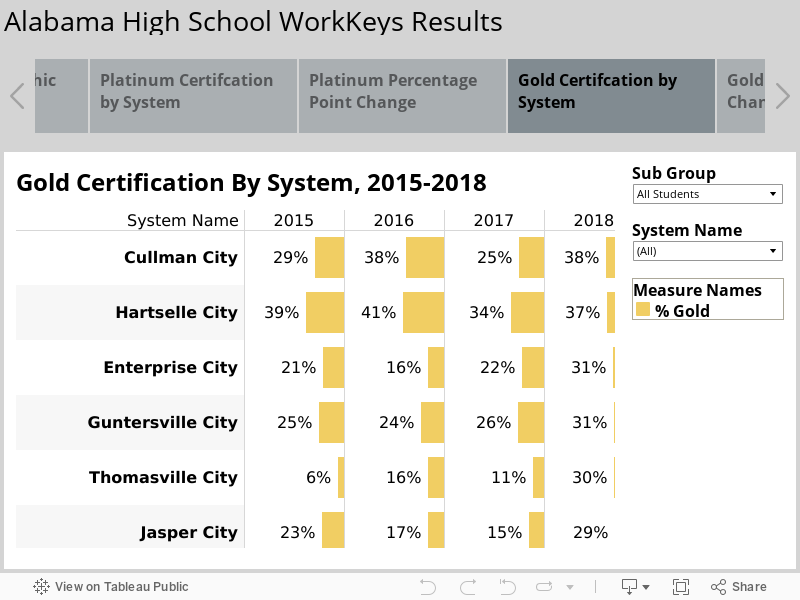
Gold: Cullman generated the highest percentage of Gold Certificates, followed by Hartselle. The percentage receiving Gold increased for most systems, though not at the level of change experienced for Platinum. Fourteen systems generated fewer Gold Certificates in 2018, including some of the top academic systems. Supposedly more of their high performing students moved into the Platinum level. Statewide, Thomasville generated the highest increase in Gold Certificates, moving them into the top five in overall state rankings.
Silver: Finally, most systems decreased in the percentage of students receiving Silver Certificates, the threshold for being considered workforce ready. The highest gains were in Perry County and Elba. The highest decreases were in Mountain Brook, Jasper, Cullman, Marion County, and Brewton. Rounding this out, the percent of students receiving Bronze Certificates increased in the majority of systems, while the majority of systems have a lower percentage of students who did not receive a certificate.
Possible Causes for the Change
A variety of explanations can be considered for the changes in WorkKeys results:
Changes in the WorkKeys assessments;
Stronger alignment between WorkKeys teacher training, test preparation, and test questions; and
Stronger concerted efforts in schools to prepare students for the assessments.
In 2018 WorkKeys underwent a number of changes, though the only test section that involved significant content change was the Locating Information test, which is now called Graphic Literacy. The names used for the other two assessments were changed to their current titles, Applied Math and Workplace Documents, though apparently no significant content changes occurred in these assessments.
Changes in an assessment often lead to scoring changes and other issues that can affect results. The new Graphic Literacy test may account for the leap in higher certificates at the Platinum and Gold levels, but the new test is supposed to be more rigorous. While higher rigor would usually not be associated with higher scores, higher relevance in an improved test could produce better scores.
Aligned with the changes in the actual assessments are changes in teacher training and student prep tools, including practice exams. These are potentially a better fit with the formal assessments being rolled out than was available in preparation for the prior assessment.
More systems may also be using the ACT WorkKeys Curriculum, which is aligned with the WorkKeys assessments. The courses are delivered through a mobile-based learning management system. It provides students and teachers with a customized study schedule and detailed instructional content. While the curriculum can improve test performance, it is primarily designed to develop workplace-ready skills in students.
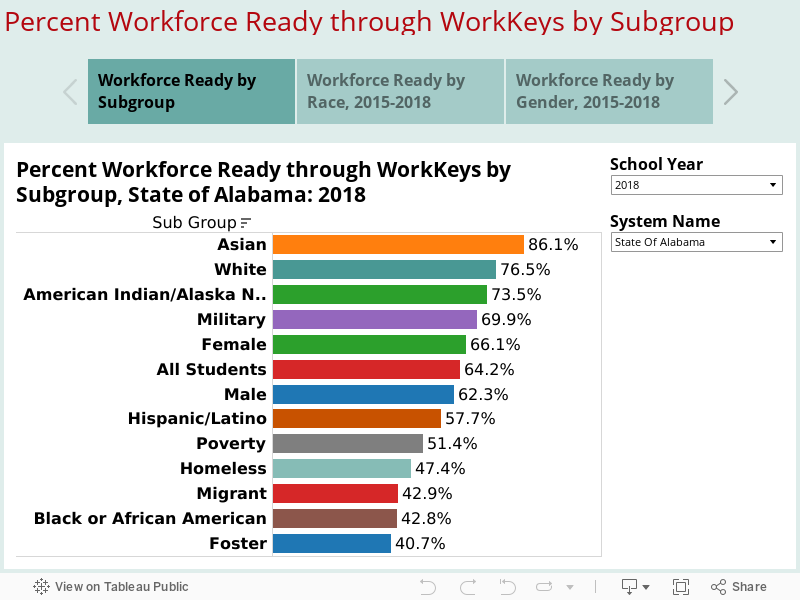
Subgroup Analysis
Analysis of WorkKeys results for student subgroup performance shows continuing disparity between subgroups. Use the filters to see how systems differ in subgroup performance. Some schools may be better at assisting struggling groups than others.
In looking at trends, all racial groups are showing progress from year to year, especially Asians, Native Americans, and black students. The gap between Asian students and all other races is growing. The gap between white and Hispanic students is also growing, while the gap between white and black students has remained about the same – but not closing. Black students are gradually closing the gap with Hispanic students.
College and Career Readiness in Alabama
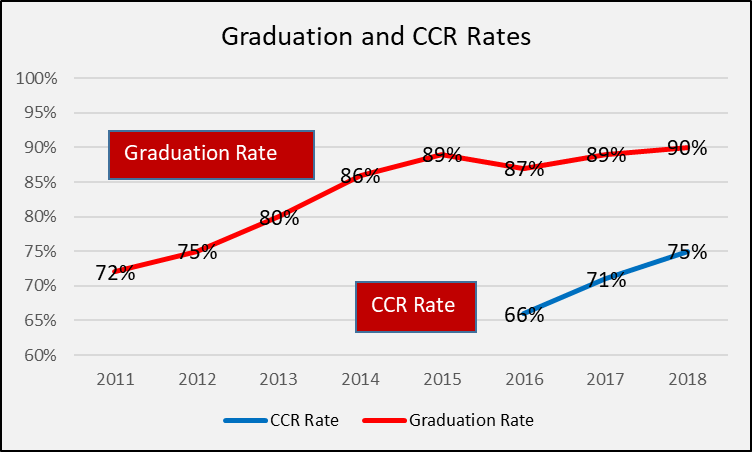
In 2012, the Alabama State Board of Education adopted Plan 2020, which embraced a vision for the state education system led by the motto: “Every child a graduate. Every graduate prepared.” The plan called for raising Alabama’s high school graduation rate to 90 percent, while at the same time producing graduates who are better prepared for college and the workplace. Since that time, significant progress occurred in raising the graduation rate from 72 percent in 2011 to 90 percent in 2018.
While the high graduation rate is laudable, state education leaders have raised concerns about the gap between the percent graduating and the percent prepared for college or work. The other half of the motto — “Every graduate prepared” — came under question.
The following chart shows Alabama high schools are closing the gap between the percentage of students graduating and the percentage of seniors demonstrating they are ready for college and the workforce.
According to yet-to-be finalized data from the Alabama State Department of Education, significant progress has been made over the past three years. Final and complete data are expected to be published later this year:
In 2016, Alabama graduated 87 percent of its students, though only 66 percent were college and career ready.
In 2017, the gap closed, with 89 percent graduating and 71 percent college and career ready.
In 2018, improvement continued with 90 percent graduating and 75 percent college and career ready.
Though the gap is still large, it is improving.
Continuing to close that gap is vital. The state has a goal of adding 500,000 highly-skilled workers to the workforce by 2025. To meet that goal, virtually all high school graduates will need to be prepared for education beyond high school or prepared to enter the workforce directly after high school.
The 2018 CCR data shows:
Career Technical Education (CTE) certificates are the fastest-growing means for classifying students as college and career ready.
Qualifying scores on the ACT and WorkKeys assessments are the two most common measures used to classify students as college and career ready.
Systems and schools leverage different strategies for preparing students – reflecting varying strengths, resources, and goals for education.
Some systems are very strong in particular areas and weak in others, which may not meet the needs of all students.
Disparities in performance exist across schools and student subgroups that may go beyond poverty.
Alabama’s College and Career Readiness Measure
The Alabama College and Career Strategic Plan (a component of Plan 2020) articulated a vision in which all Alabama students graduate high school college and career ready. The plan defines college and career readiness as:
“…a high school graduate [that] has the English and mathematics knowledge and skills necessary to either (1) qualify for and succeed in entry-level, credit-bearing college courses without the need for remedial coursework, or (2) qualify for and succeed in the postsecondary job training and/or education necessary for their chosen career (i.e. technical/vocational program, community college, apprenticeship or significant on-the-job training).”
High school graduates are classified as college and career ready (CCR) if they meet at least one of the following criteria.
Score college ready in at least one subject on the ACT
Score at the silver level or above on the WorkKeys Assessment
Earn a passing score on an Advanced Placement or International Baccalaureate Exam (college-level courses delivered in high schools)
Successfully earn a Career Technical Education credential
Earn dual enrollment credit at a college or university
Successfully enlist in the military
Some of these measures are more aligned with college preparation and others with career preparation.
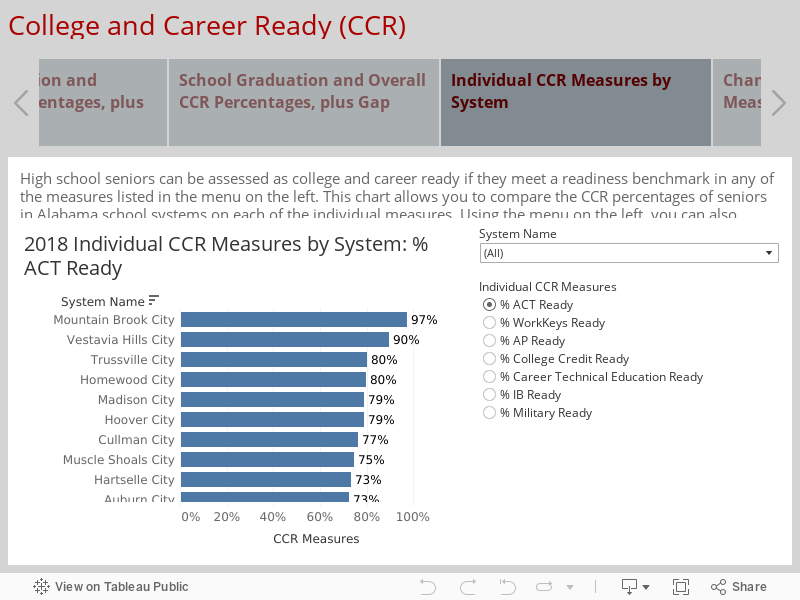
The state now provides data on the overall CCR rate and data on the individual metrics that create the measure. Detailed analysis is found in the interactive charts below, which allow users to explore college and career readiness percentages for high school seniors in 2018 at the state, school system, and high school level.
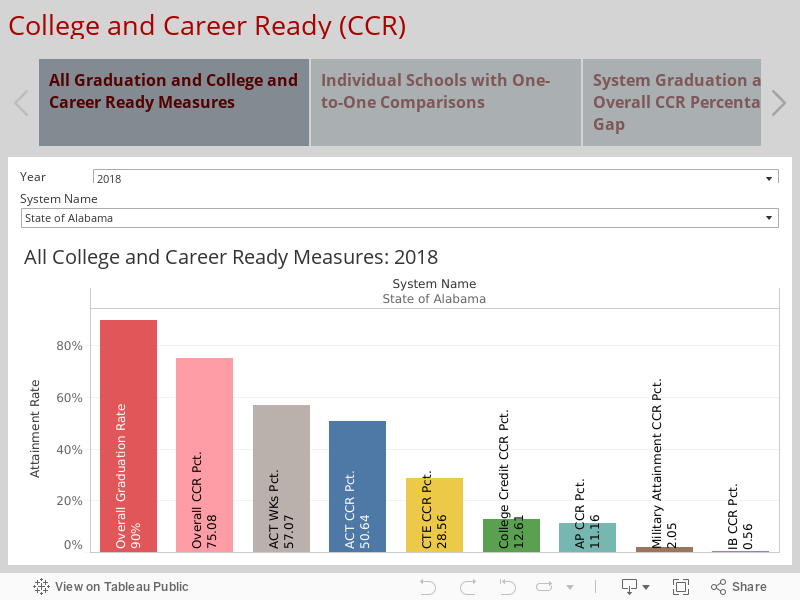
Graduation and CCR Rates
The first chart shows the percentage of students graduating, followed by the percentage of seniors who are college and career ready, followed by the percentage achieving readiness on the various performance measures that compose the CCR rate. While preset for the state in 2018, the filters can be used to produce the same chart for individual school systems in 2017.
Statewide, the percentage of seniors testing “ready” is highest for the WorkKeys assessment, followed closely by ACT. Those are the two main channels through which a CCR rating is achieved, though a growing number of students are deemed CCR by earning a credential in a Career Technical Education (CTE) field. Earning college credit or a qualifying score on an AP exam are also used by a smaller percentage of students. A very low percentage of seniors achieve a CCR rating by getting a passing score on an International Baccalaureate exam or successfully enlisting in the military. Exploring these measures at the system and school level suggests the use of different strategies across school systems reflects different goals for education, local needs and strengths, and characteristics of the community.
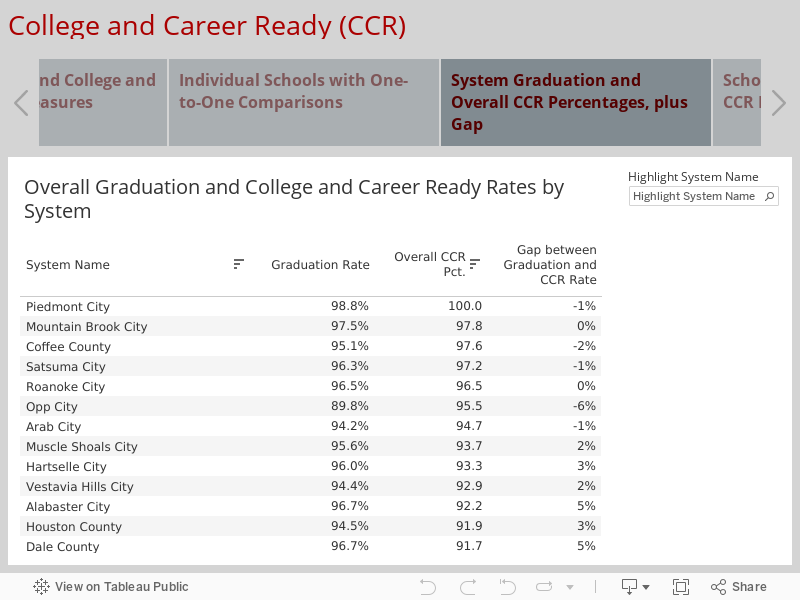
Graduation – CCR Gapby Local System
Chart 2 shows the graduation rate, CCR rate, and gap between these two rates in each system. They are listed in the order of CCR rate from highest to lowest. The Piedmont City School System is No. 1 in the state for CCR — the only system where 100 percent of seniors are classified as college and career ready. The system also graduates close to 100 percent of its students.
Some systems actually have negative gaps where the percent of seniors who are college and career ready exceeds the percent who graduate after four years in high school. This includes the Coffee County System, and city systems in Opp, Arab, Satsuma, and Piedmont.
On the other end of the spectrum, systems with the lowest CCR rates tend to have the highest gaps between graduation and CCR rates, though not always.
Graduation – CCR Gap by School
Individual schools are showing similar trends, with wide disparity between high and low performing schools.
Keith Middle-High School in Dallas County graduates 90 percent of its students, matching the state average, but only 19 percent of its seniors are measured to be college and career ready.
Barbour County High School graduates 77 percent of its students, but only 12.5 percent of seniors are measured as college and career ready.
Having both high graduation rates and CCR rates indicates that the diplomas issued by those schools have credibility and value. Where graduation rates are high but CCR rates are low, there is cause for concern.
Individual Components of CCRby System and School
The remaining charts in this section display individual components of college and career readiness by system and school. The final chart shows the percent change in CCR rates from 2017 to 2018.
Overall for the state, the largest change occurred in the percent of students earning career technical education credentials, increasing from 22 to 29 percent. The state and individual systems have put an increased focus on providing career-related coursework in high school, and the increases here may reflect that emphasis. At the same time, it is important for policy-makers to monitor what career credentials students are earning. For this to be a meaningful measure of career readiness, those credentials need to be recognized and valued by employers and should be in a field in which a student is likely to obtain workor more advanced training.
Other increases occurred in students earning college credit (10% to 13%), and in WorkKeys readiness (55% to 57%).
As cited earlier, when looking at individual systems and schools, it becomes apparent that different places achieve college and career readiness through different strategies.
Mountain Brook is No. 1 in ACT, WorkKeys, and AP, but lower on college credit and career technical credentials.
Vestavia is second on ACT readiness, among the top schools on the AP exam, and in the top 25 percent in career technical credentials, but much lower on WorkKeys and dual enrollment.
Opp City exceeds the state average on all measures of CCR but is especially high-achieving in students earning college credit, where they are No. 1 in the state, and in career technical credentials, where they are No. 5.
The system with the highest CCR rating, Piedmont City Schools, is at the state average on ACT and WorkKeys, but far and above other systems in credentials.
Are schools meeting the needs of all students? One concern this analysis raises is that some systems may not be meeting the varying needs of all students. Those systems scoring high or at least moderately high on a balance of college and career measures are providing a breadth of services that can help students shine where they show interest and potential. The lack of balance in some systems or schools may reflect an intentional emphasis on what they value most: college preparation or career readiness. It is important for schools to assess whether they are providing options that fit the needs and interests of the diverse array of students they serve.
Conclusion
As a composite of various academic and career indicators, Alabama’s College and Career Ready metric reflects three important concepts.
Every student needs either a post-secondary education or credible career-focused training in high school.
Post-secondary education need not be a traditional four-year college degree.
There are many different pathways for students.
The gap between Alabama’s graduation rate and the number of graduates deemed college and career ready has been a concern, but one with optimism given progress in closing that gap.
Career Technical Education certificates are the fastest-growing measure through which students are earning the CCR marker. These credentialing programs are meant to prepare students for workforce opportunities in high-demand fields right out of high school. They combine academics with work-based learning as a strategy to address the widening gap between job applicants’ skills and the skills employers need. The state will need to continuously ensure that all courses and concentrations are of high quality and relevant to the workforce needs in the state and in local communities.
Beyond preparing students with skills for specific jobs, an array of academic, extracurricular, and work-based learning opportunities can develop the student as a whole person capable of thoughtful decision-making and meet the unique needs and preferences of each student. Academics, career training, life skills, and the cultivation of passions and interests can all come together to support college, career, and life readiness.
Alabama is assessing progress on part of this, but not all. The state has made a good faith effort to evaluate college and career readiness through a variety of measures such as the ACT, college dual enrollment, WorkKeys, and Career and Technical Education (CTE) certification. Still, this is a changing and growing field. Skills and attributes needed in various careers are continually changing. Alabama should remain alert to more rigorous and authentic measures of college and career readiness that may emerge.
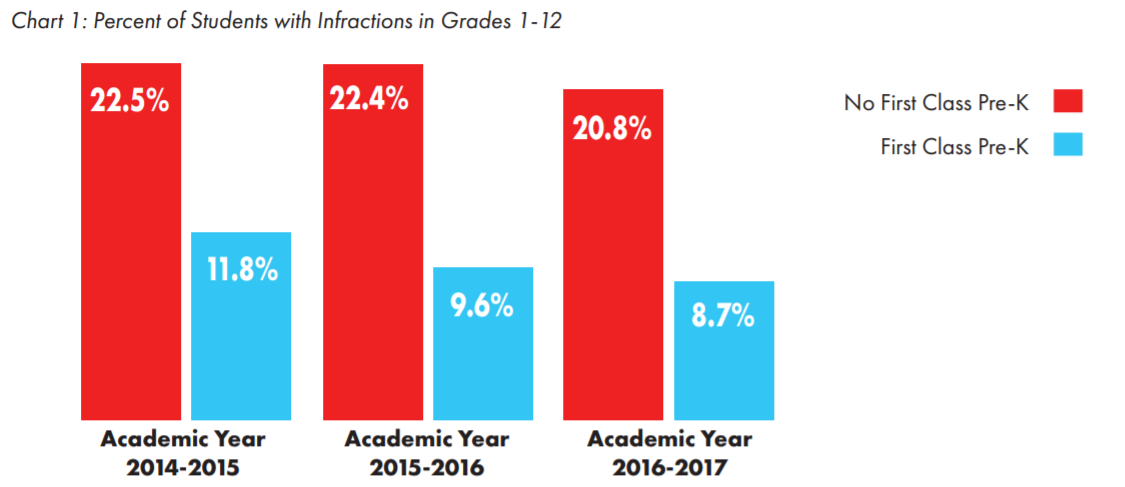
First Class Pre-K lowers discipline rates for students middle and high school years
Children who have participated in Alabama’s First Class
Pre-K program, a voluntary, public early education program are about half as
likely to be involved in disciplinary problems throughout their school careers
than students who didn’t participate in First Class Pre-K, and the most
pronounced differences between the two groups is evident in the students’
middle and high school years, according to new analysis of discipline data.
The analysis was conducted by the First Class Pre-K Research
Evaluation Team, a multi-disciplinary group of researchers that includes
faculty and staff from the UAB School of Public Health, UAB School of
Education, and PARCA. The Alabama Department of Early Childhood Education
provides grant funding for the research in order to provide ongoing, rigorous
assessment of the First Class Pre-K’s effectiveness.
The research team analyzed data provided by the Alabama State Department of Education which included disciplinary records of over 530,000 infractions for three academic years 2014-2015, 2015-2016, and 2016-2017. Data were matched with the records for all individual public school students who were enrolled over the time period. The analysis found that from the time they entered first grade, former First Class Pre-K students were less likely to be involved in the serious disciplinary violations tracked by the state records. The difference in the discipline rates of the First Class Pre-K students compared to other students actually widened in the upper grades. These results were consistent across all three years examined. For a more detailed description of the research, click here.
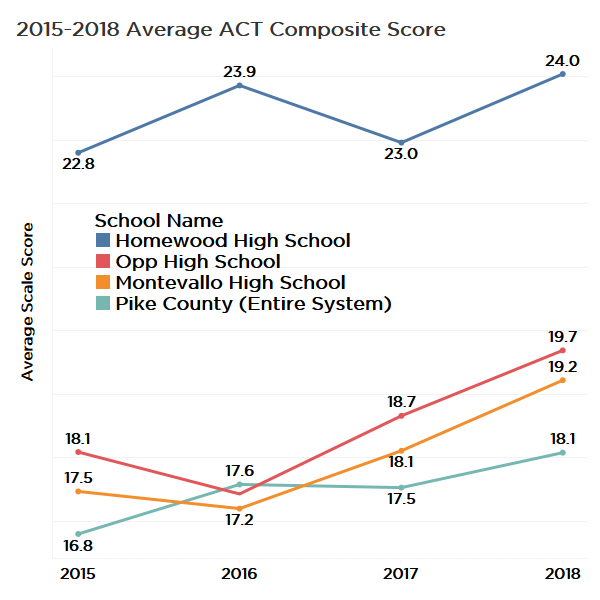
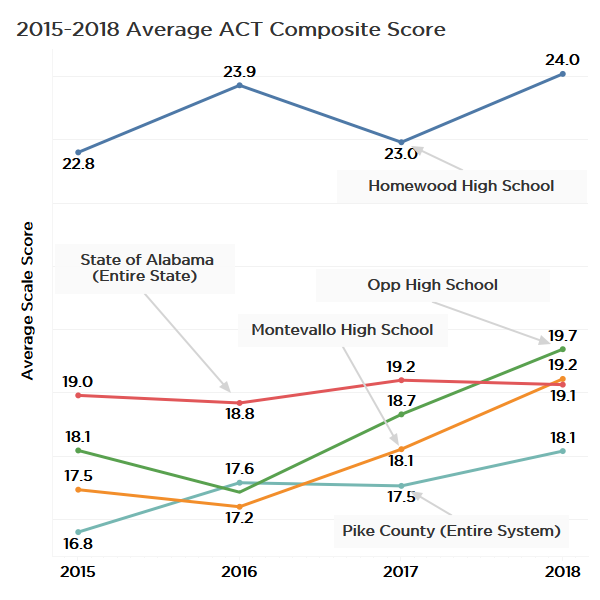
Practices of Top Gaining Schools on the ACT
After publishing ACT results for the graduating Class of 2018, PARCA contacted several of the schools and systems in Alabama that showed the largest improvement in average composite ACT scores between 2015 and 2018. PARCA wanted to know what, if anything, the schools did, either specifically for the ACT or in general, to improve students’ college readiness levels.
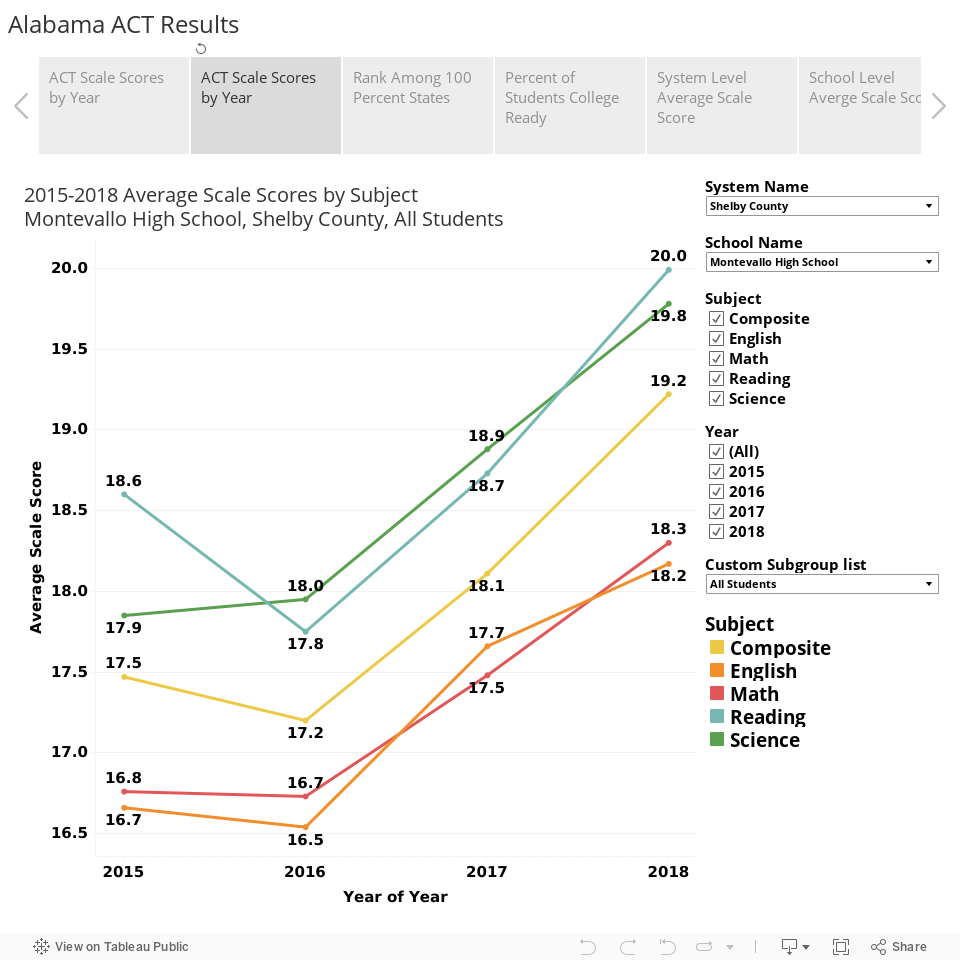
We received responses from the Pike County School System, from Montevallo High School, Opp High School, and Homewood High School and System.
The schools are across the spectrum when it comes to the economic composition of the student body. Using the percentage of students qualifying for a free school lunch as a measure of economic disadvantage, Homewood (20 percent) and Opp (41 percent) have lower levels of economic disadvantage than the state average (46 percent). Meanwhile, Montevallo High School (54 percent) and the Pike County School System (73 percent) have a higher percentage of disadvantaged students than the state at large. In terms of per-pupil spending, Homewood and Pike County are in the top 20 in per-student funding, while Opp and Shelby County are closer to, but still above, the state average.
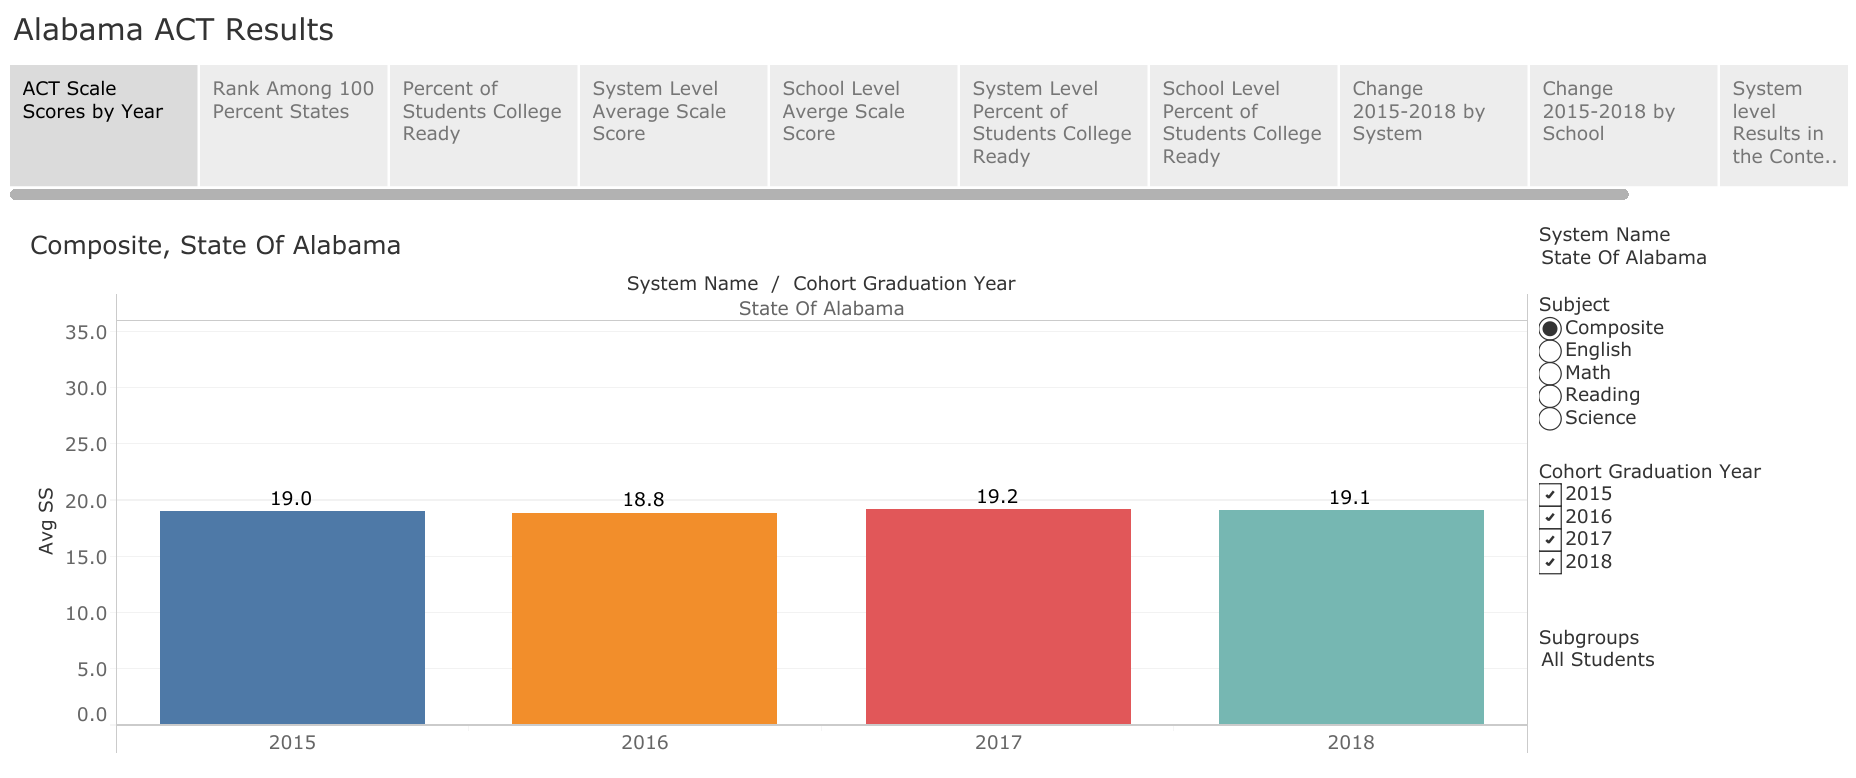
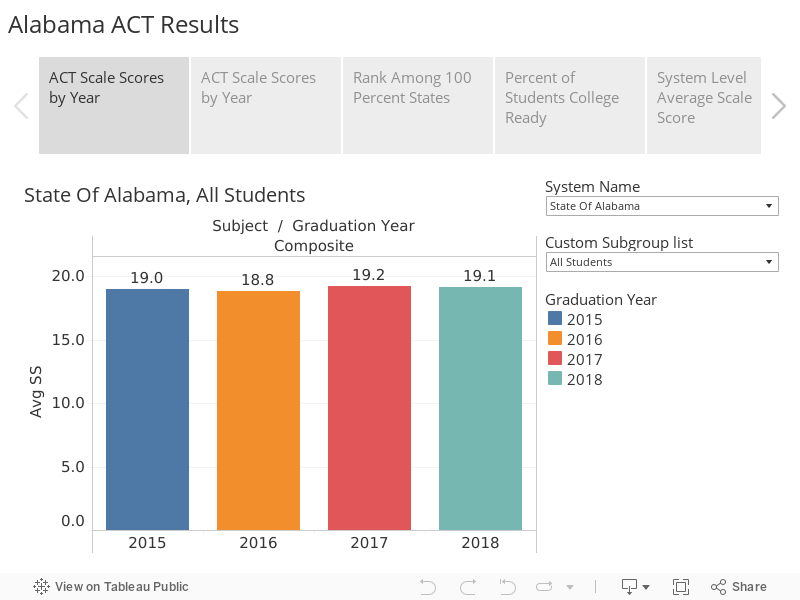
Statewide, the average composite score has been basically flat since 2015, rising from 19 to 19.1 in 2018. That tenth-of-a-point gain statewide contrasts with improvements at the responding schools of between 1.2 and 1.7 points on a 36-point scale.
In response to PARCA’s query, school officials described the factors that they believe led to improvement. These are only observations and no underlying studies were performed to prove a cause and effect. However, the approaches described, while not uniform, had common characteristics that have been shown by educational research to lead to improved student performance.
Common Approaches
While the details varied amongst the responding schools, the common themes would not come as a surprise to anyone familiar with education research:
Setting high expectations for all students.
Focusing on the delivery of strategic, high quality, standards-based instruction, not teaching the test.
Monitoring of student progress, providing aid for students who struggle and resources for students who want an additional challenge.
Teaching students to a level of depth expected at the college level, a level that goes deeper than recalling facts.
Emphasizing to students the importance of the ACT and providing access to ACT preparation materials and courses.
Critical Thinking Skills
While all four respondents, to varying degrees, provided targeted preparation for the ACT itself, all emphasized that the real foundation for success was an across the board dedication to a robust standards-based approach to instruction, an approach that challenged students to think beyond surface level of recall of facts, dates, and formulas, and to develop a depth of knowledge and the ability to apply what they learned.
Engaged Faculty
All four viewed the adoption of the Alabama College and Career Ready Standards, standards that included input from the nationally-aligned Common Core standards, were a positive development. The adoption of the new standards provided each system an opportunity to engage faculty in a deep review of what should be taught at each grade level and whether the school curriculum was aligned with the standards. Professional development was provided to ensure teachers were prepared to deliver the content and level of depth called for in the standards.
College-Level Courses
Both Homewood and Opp pointed to the high quality of Advanced Placement (AP) courses. Both systems have added courses and increased access to AP, which are college-level classes delivered in high school. School officials said the high-quality course content and the training teachers receive in order to teach AP classes results into a richer experience for students. That experience prepares them for the more complex level of thinking required to perform well on the ACT. The ACT is, after all, a test that seeks to measure student readiness for college-level work, and AP courses are designed to reflect college-level learning. Homewood emphasized that AP classes at Homewood are open-enrollment rather than selective. Their enrollment continues to grow, as do success rates on the AP test.
Pike County has adopted a different strategy for exposing students to college-level coursework: send them to college. Pike County will have 24 seniors graduating this year with over 60 hours of college credit earned at Troy University or through community college programs. That means those students enroll with enough credit to have earned an associate degree and plenty of experience with college-level work. Beyond the quantifiable results produced for students, the system is spending more efficiently, according to Pike County Superintendent Mark Bazzell. In a small school system, it is difficult to generate the numbers of students participating in AP offerings to justify the investment, especially when college-level courses are already available in the community at the local colleges. Because some national ranking systems look at AP participation as a marker of quality sometimes Pike County receives lower rankings than it deserves considering the opportunities it provides students through the dual enrollment option.
Below are observations from each school or system.
Pike County System
The Pike County School System continues to exceed expectations and draw attention with its attitude of high expectations, no excuses, and its methodical and creative approach to improving outcomes for students. Pike County has been featured in two Business Education Alliance (BEA) reports, Exceeding Expectations (2016) for exceptional performance on the ACT Aspire and in Leadership Matters(2018) for the system’s innovative approaches to improving college and career readiness. PARCA authored those reports, with support and consultation from A+ Education Partnership.
Pike County’s superintendent began the path to the current level of success more a decade ago. When he took over as superintendent, he began a campaign to build a faculty that uniformly believed that all children were capable of high performance. The second step was helping the faculty understand what students needed to know according to the national standards and providing teachers with the training in how to effectively teach those standards.
Bazzell found ACT Aspire, ACT’s suite of standardized tests for elementary and middle school students, to be a valuable tool for accessing student progress. The State used Aspire as its standardized test for accountability purposes but dropped it before the 2018 school year. Pike County now pays on its own for Aspire and uses data from the test to inform instruction. Continuing to use the Aspire exposes Pike County students early and often to ACT-designed standardized test, a test that predicts achievement levels on the actual ACT college readiness test.
Considering its level of student economic disadvantage, Pike County now generates consistent high performance. Bazzell provided the most detail on specific ACT preparation measures the two high schools in the system have adopted.
Encouraged students to start taking ACT earlier (9th grade)
Increased awareness of the importance of ACT through posters in the hallway, data analysis with students, parent meetings, etc.
Teachers’ use of bell ringers (quick questions to open class) that are aligned with ACT questions
Implemented Saturday ACT study sessions with content-area teachers
Utilized a Discovery Block (time set aside during day) for ACT and PreACT practice, with a schedule that rotated by content area
Utilized actcademy.org to create individual study paths based on a student’s PreACT score.
Encouraged students to put various ACT prep Apps on their phones and use them during free time at school and at home
Included ACT prep materials into a Southern Research Education Board-designed college readiness course, which is now mandatory for students who score lower than a 19 on the ACT
Montevallo High School Principal Brandon Turner, who arrived at Montevallo in 2015, emphasized that his faculty and staff function as a team. Learning targets are set by subject and grade level and formative assessments are administered to track student progress toward the targets.
Turner said a central emphasis for the school is improving instruction and adding depth of knowledge. There is a concept in education called the four levels of knowledge. The first is simple recall, the second level is connecting facts together as concepts or patterns. The third level, strategic thinking, applies concepts learned to novel situations, and the fourth level of knowledge is demonstrating the ability to draw from multiple sources to identify problems and construct solutions.
Questions on the ACT often go beyond recall, simple connections between points of data, and challenge students to think about the bigger picture.
“The depth of knowledge has to be embedded in all your classes,” Turner said. “If we aren’t practicing those things, they won’t succeed.”
Montevallo also offers a guided practice period during lunch that juniors are able to take advantage of, and the week before the administration of the ACT, all the junior classes focus on preparing for the test.
Opp High School, Opp City System
Standards and Active Learning
When Alabama adopted new learning standards, the Opp City System made a systemwide concerted effort to support teachers in understanding and teaching the standards. And it paid off. Opp was featured in 2016’s Exceeding Expectations report for showing the most improvement in math on the ACT Aspire.
Principal Aaron Hightower said the high school continues to focus on teaching that is grounded in learning standards and objectives but is also challenging teachers to innovate in how they teach in order to keep students engaged. For example, teachers at Opp Hike School are encouraged to compress lectures into the first 20 minutes of class and assign group projects to work on for the remainder of the period.
Faculty collaboration
The faculty coordinates across grade level so each grade level subject matter team builds on what has been taught in the previous year and prepares students for the next year.
Course Rigor
For Opp, AP courses have been especially beneficial in increasing the rigor and quality of courses. And, according to Hightower, all courses are supposed to challenge students to think beyond surface level learning.
Diagnostic Tools
To make sure all students stay on pace, Opp uses a diagnostic tool called Edmentum, which measures student skill level and identifies specific areas of weaknesses that need to be addressed. For struggling students, it then prescribes a personalized learning plan to address those weaknesses.
ACT Specific Preparation and Incentives
Opp started offering the PreACT to 10th graders the year before the State made it a requirement. That has allowed students to build familiarity with the kinds of questions the ACT asks.
And finally, to encourage all kids to put in the effort on the ACT, Opp offers incentives. If a student can document a two-point gain on the ACT, they qualify for a school trip to the new water park in Baldwin County.
“Now that creates a buzz,” Hightower said.
Homewood High School, Homewood City System
Instructional Leadership
As with the other responding schools and systems, Homewood school officials first pointed back to the fundamentals of preparation that put students in a position to succeed. Patrick Chappell, the system’s director of instructional support, pointed to the academic focus created in the system by each school in the system having an assistant principal for instruction. Those principals regularly meet with each other and with their faculties during embedded professional learning time to ensure educational continuity classroom to classroom.
Learning Targets
The system has teacher-developed learning targets for students, by grade and by subject. Those targets reflect but often exceed the state’s Alabama College and Career Ready Standards. Despite this tight definition of intended outcomes for students, Chappell said, teachers and students are given latitude on the style and pace of learning. They are not bound by pacing guides, for example. The emphasis is on mastery of standards, not flying through every bit of material.
AP Courses
Homewood offers an array of AP classes and, in recent years, has seen a continuing rise in the number of students and the percentage of students choosing to take those courses.
Teachers have received additional professional development to prepare for teaching AP classes, and the system also pays for students to take AP exams.
Access to AP classes is not restricted by GPA or participation in an “honors” program. Any student who wants the rigor and challenge of a college-level course can take AP classes. Even with the rising participation levels, the percentage of students earning a successful score on the AP exams continues to climb as well. With more students succeeding in college-level coursework, it stands to reason that ACT College readiness rates would rise as well.
Credit Recovery For Struggling Students
Students facing academic challenges have also received targeted attention through an enhanced credit recovery program, promoted by Homewood High School (HHS) principal Zack Barnes. Instead of simply issuing failing grades and having students repeat courses in summer school, the school directs students to online credit recovery programs that allow students to go back and address the specific standards they failed to master.
Test Taking Experience and ACT Prep
HHS Assistant Principal Amanda Esslinger added that Homewood pays for all 9-11 graders to take the PSAT, another college readiness test. This increases students’ comfort level with multiple standardized and timed tests. The multiple measures also create a greater awareness of each student’s strengths and areas of needed growth. That’s useful both to the individual student and to teachers and administrators evaluating the effectiveness of instruction.
Homewood offers an ACT prep class during the school day that any junior or senior can take, giving all students access to preparation that used to be only available to families who could pay for private courses.
Conclusion
Increasing student success on the ACT is important for individual students and can be an important measure of academic effectiveness for schools as well. Schools that generated improvement pointed to some measures that were directly aimed at the ACT such as raising student awareness of the importance of the test and providing access to ACT preparation resources. However, those schools and systems that improved first emphasized a commitment to delivering instruction that allows students to meet and exceeds expected standards of learning for their grade level. They also emphasized exposing all students to the deeper levels of learning expected for college level academic performance.
Alabama High School ACT Scores for the Class of 2018
Alabama public high school students’ performance on the ACT was down slightly in 2018, after hitting a high point in 2017. Alabama students’ average score was 19.1 on a 36-point scale, compared to 19.2 in 2017. Over the past four years, Alabama scores have been stable, roughly paralleling the slight up and down of national scores.
Interactive charts in this report allow you to explore the results by system, and school, by subject, and by year.
How Does Alabama Compare?
The ACT is a test of college readiness and is used by colleges as a factor in the evaluation of applicants’ qualifications for admission. Alabama is one of 17 states that gives the ACT to all public high school students, whether they plan to apply for college or not. Among the states that give the test to all public high school students, Alabama ranks 13th, tied with North Carolina. The average scale score among the 100 percent states is 19.5.
More Alabama students, a higher percentage of enrolled seniors, and more students of color took the ACT in 2018, according to data provided by ACT and the Alabama Department of Education. This was particularly notable among Hispanic students. Though small in total numbers compared to whites and blacks, the number of Hispanics taking the ACT increased from 1,867 in 2015 to 2,886 in 2018 (55% increase). Black students taking the ACT increased over this period from 16,602 to 16,968 (2% increase), and whites slightly decreased from 29,337 to 29,100 (less than 0% change). Alabama public schools give the ACT in the junior year of high school. The final reported results here are for the students who graduated in 2018. Those students would have taken the ACT in 2017 at their own high school. If a student took the test subsequent to the administration at their high school, the student’s highest scores in each subject would be counted.
School Systems That Have Shown Improvement
In 2018, 85 out of 137 school systems in Alabama posted higher average composite scores on the ACT than they did in 2015. The top 10 systems in terms of improvement on students’ average composite score between 2015 and 2018 are listed below. A more complete listing can be found in the interactive charts.
Rank
System
2015 Average Composite Score
2019 Average Composite Score
1
Homewood City
22.80
24.15
2
Chickasaw City
15.50
16.84
3
Fayette County
17.98
19.12
4
Thomasville City
17.33
18.46
5
Auburn City
21.32
22.41
6
Macon County
15.25
16.24
7
Trussville City
21.73
22.70
8
Linden City
15.42
16.37
9
Coosa County
16.36
17.29
10
Arab City
21.59
22.41
Keeping Demographics in Mind
On average, students from economically disadvantaged families tend to score lower on standardized tests than students who are not at an economic disadvantage. Similarly, schools where a higher percentage of the student body is economically disadvantaged, the average test score tends to be lower. Comparing schools that have similar demographics is a fairer way to evaluate relative performance. Scatterplot charts, like the one featured below, present score data and student poverty levels at the same time. The vertical position of the school or system is determined by the average test score, while the horizontal location of the school or system is determined by the percentage of the student body directly eligible for a free lunch under the national free lunch program.
ACT Scores and College Admission
Keep in mind that a composite score of 18 is considered a minimum threshold score for college admission at several state colleges. Others have lower thresholds, including open admissions. On the other end, a score of 25 or higher is expected at more competitive colleges, while 30 is the minimum threshold at some of the nationally elite schools such as Princeton. The table below lists the median entering ACT composite score students at Alabama colleges. Historically black colleges consider it part of their mission to admit students who may not have had the academic preparation to perform well on the ACT. The average ACT score for black students in Alabama is 16.5.
Prisons, education, taxes, trust in government. What do Alabamians think?
A slight majority of Alabamians oppose building new prisons, but an overwhelming majority support expanding rehabilitation and re-entry programs for people leaving prison, returning nonviolent offenders to the community, and spending more on education.
These are among the key findings of the Public Affairs Research Council of Alabama’s Public Opinion Survey: 2019Edition, released today.
The survey,
conducted in partnership with Samford University and led by Dr. Randolph Horn,
again found high levels of agreement on critical issues facing the state.
Alabamians value
education, rating it a top priority among major
state services. State residents say education investment should be increased, as too little is now spent on education. While not agreeing
on the source of revenue, a majority of residents are willing to pay more in
taxes to increase funding for education.
There is some
evidence that the current tax system is seen
as regressive: majorities of residents say low-income
residents pay too much, and those with higher incomes pay too little.
Consistently high
percentages of Alabamians feel that they
have no say in Montgomery or that state officials do not care what they think suggests that Alabamians do not believe
state government is responsive to their concerns.
Corrections
86% support expanded rehabilitation and re-entry programs for
people in prison.
83% support moving people with nonviolent convictions back to
the community.
58% oppose building new prisons to address overcrowding.
54% believe only violent offenders should go to prison.
Education
74% believe the state spends too little on education.
69% support increasing taxes to support education, but no
single option garners majority support.
Taxes
45% say they pay the right amount of taxes.
45% say lower-income earners pay too much.
52% say upper-income earners pay too little.
Trust in Government
82% support keeping the General Fund and Education Trust Fund
separate.
69% believe state government officials do not care about
their opinions.
57% believe they have no say in state government.
The survey of 410 randomly selected Alabamians was conducted between January 28 and March 3, 2019 and yields a margin of error of +/-4.8 percent.
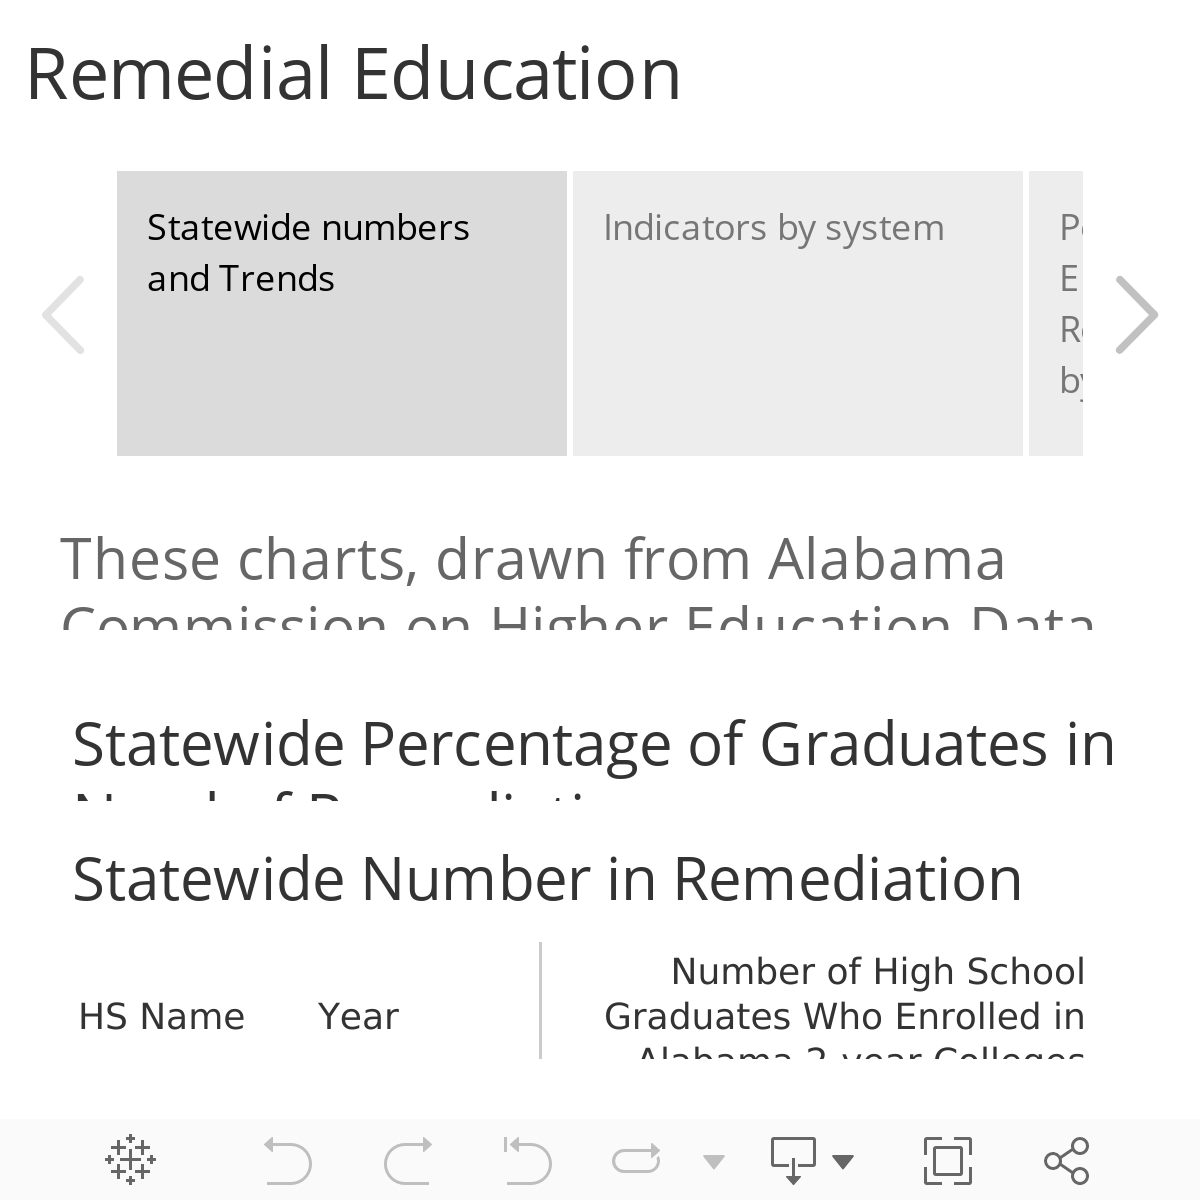
Lower Percentage of College Freshmen in Need of Remedial Education
The percentage of first-time college students assigned to remedial education before embarking on college courses continues to drop, according to the latest data provided by the Alabama Commission on Higher Education (ACHE).
The data follows Spring 2017 graduates of Alabama high schools who enrolled at Alabama public colleges in the fall after graduation. The data indicate that 28 percent of those who enrolled in higher education were required to take a course in either remedial math or remedial English or both.
A remedial course is designed to bring students up to the educational level needed to succeed in a college course. That percentage needing remediation is down from 34.6 percent in 2011. This drop in remedial rates is occurring at a time when high schools have driven up graduation rates and have sent additional students to college.
Remediation rates are calculated for two subjects: math and English. The most progress has been made in decreasing the percentage of students having to take remedial English. In 2017, the percentage of students needing remedial courses in English dropped to 14 percent, down from 17 percent in 2013.
The percentage of enrolled students taking remedial math also declined to 24 percent in 2017, compared to 26 percent in 2013.
Why the Remediation Rate is Important
With the implementation in 2012 of Plan 2020, the state’s strategic plan for higher education, K-12 educators set a goal of driving down the number and percentage of students required to take remedial education. Providing remedial courses in college duplicates cost to the state, and remedial education drives up the cost of college for students and families. Remedial courses, since they cover high school level material, don’t count toward a college degree.
The continuing progress on rates of remedial education is noteworthy since it has come during a period in which high schools are charting higher graduation rates. Those higher graduation rates have prompted concern that, in some instances, schools might be lowering standards for graduation in order to show higher graduation rates. However, this data suggests that the students who are going on to college are entering better prepared.
When high schools do a better job of preparing students for college-level work, it produces savings for the student, their parents, and the education system in general.
Higher Education Working to Lower Remediation Rates
The decline in the remediation rate may also be influenced by changes taking place at colleges. Both two and four-year colleges are implementing measures aimed at decreasing the number of students needing remedial courses.
Approaches include using new assessments that identify students’ areas of weakness and prescribe specific remedial material rather than requiring a whole course. Colleges are also developing extra aid courses that can be taken in tandem with college-level English or math. The supplementary course can provide the extra help that some students need while allowing the student to proceed on the regular college track. The community college system is also partnering with some high schools to offer college prep courses in high school. If high school student earns a B in that college prep course, he or she is considered qualified to start college-level work.
Explore on Your Own
In the visualization below, you can explore the statics for remediation for local schools and systems. You can sort each column from low to high or in alphabetical order by using the tool on top of each column.
Bear in mind that the ACHE report only captures high school graduates who enrolled in the fall after their graduation in Alabama public colleges. The remediation rates for schools that send significant numbers of students to private colleges or to out-of-state colleges will not necessarily reflect the outcomes for the entire graduating class.
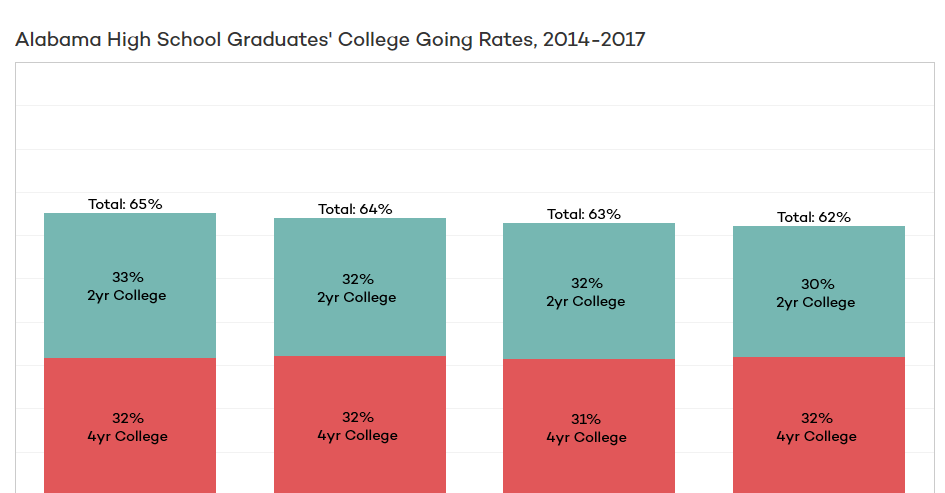
College-Going Rates for Alabama High Schools
The college-going rate for Alabama public high school graduates declined in 2017, and for the first time in three years, the number of high school graduates who went on college declined as well, according to new data provided by the Alabama Commission on Higher Education (ACHE).
The data, drawn by ACHE from the National Student Clearinghouse, follows Alabama public high school students who graduated in the spring of 2017 and enrolled in higher education in 2017 or the spring of 2018. The data includes records for in-state and out-of-state institutions, both public and private.
In 2014, the first year this set of statistics was produced, 65 percent of high school graduates enrolled in college the year after their graduation. In 2017, 62 percent of graduates enrolled. While the college-going rate has edged down, the number of high school graduates has been going up, as high school graduation rates have climbed. So though the rate was lower, more students entered higher education.
But in 2017, for the first time since 2014, there was a dip in the number of students enrolling. One factor was that the graduating Class of 2017 was smaller than the Class of 2016. Also, the number of students going to community colleges experienced most of the decline, something that tends to occur when unemployment is low, and graduates are drawn directly into the workforce. The number and percentage of high school graduates not enrolling in higher education the year after graduation also increased for the Class of 2017 when compared to previous years: 38 percent of high school graduates did not enroll the year after their graduation.
The intersection of high school graduation and college-going is an area of keen interest as Alabama has set a goal of improving the education and skill levels of its workforce. It benefits the state to have more of its students graduating high school, rather than dropping-out. But those graduates need to have either earned a meaningful occupational credential while in high school or have graduated high school prepared for advanced training or higher education.
Alabama’s public high school graduating class of 2017 totaled 49,764, about 200 students less than the Class of 2016. Among those graduates 15,738, or about 30 percent, enrolled in a two-year community college, according to the data. That’s about 600 students fewer than the previous year.
The number and percentage of students enrolling at a four-year college increased to 15,804, up 128, accounting for 32 percent of graduates. The total number going to public 4-year colleges in Alabama dipped by 122, but that dip was offset by an increase in the number of students going to in-state private colleges or going to four-year colleges out of state. Still, the overwhelming majority, 91 percent of those who enrolled, went to Alabama institutions and 92 percent of those who enrolled went to a public college or university.
The remaining 18,826 high school graduates, 38 percent of graduates, were not found to have enrolled in higher education. Data for individual schools and for school systems is available by exploring the tabs about the data display.
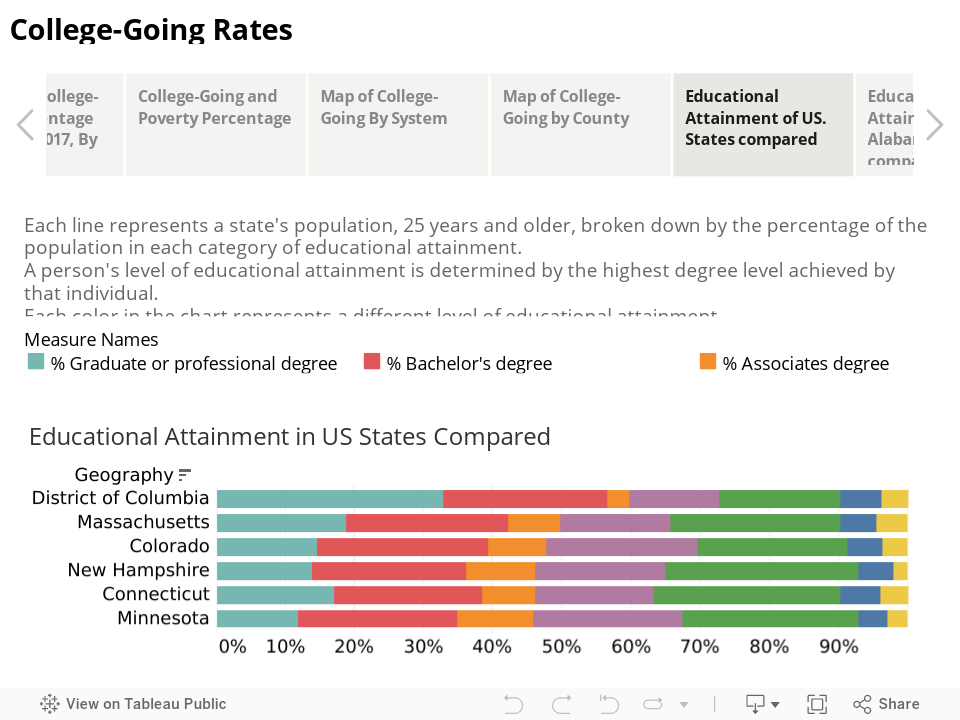
Why is this important?
Alabama trails most other states in educational attainment levels. Higher levels of education generally translate into more job stability, higher pay, and better health. As the economy continues to shift toward jobs requiring a higher level of education and training, the need for a better-educated population grows.
Alabama has set a goal of adding 500,000 new highly skilled workers to its workforce by 2025 in order to meet and exceed the anticipated demands of the evolving economy. To reach that goal, virtually all high school seniors need to graduate ready for college or career, ready to go into advanced training related to employment or into college, prepared for college-level course work.
Alabama’s public high school graduation rate has increased substantially since ACHE began providing this data on college-going rates. During the period since 2014, the number of high school graduates has increased, as has the number of graduates enrolling in higher education. However, the number of students not enrolling has also increased. In round numbers, high school graduates have increased by 4,000 a year, the number of students going to college has increased by 1,000, and the number of students who don’t enroll in the year following graduation has increased by 3,000. This produces a dip in the college-going rate, or percent of graduates attending college.
Other observations from deeper in the data
The new data from ACHE and Student Clearinghouse allows comparisons between Alabama school systems and schools. But when making comparisons, it is important to keep in mind socioeconomic factors that affect college-going. College is expensive. Systems with higher levels of affluence will send a greater share of the students to college. At the same time, some less affluent schools and systems achieve a high college-going rate by sending more students to two-year colleges, a more affordable alternative. Research shows a number of factors can play into a student’s decision to attend a two-year college. Examples include (from Community College Review):
Open admission policies at many schools that allow students who did not perform as well in high school the opportunity to pursue a higher education
A lower tuition rate that can reduce the cost of earning a four-year degree
A flexible schedule that provides both day and night courses for students who have families and must work full time
Technical training that provides a more direct route to particular careers
Proximity to to home
Two-year colleges were originally created in part to provide assistance (a second chance) for students who did not become college ready and could not get into the four-year college of their choice. Four-year colleges know this and prepare to help them transition into their college when they arrive, or they should. This will include a number of students from lower economic backgrounds, but others too.
For instance, the number one school system for college-going is Mountain Brook, with 92 percent of graduates enrolling in college immediately after graduating from high school. Almost all of those students enroll in four-year college or university. Students in Mountain Brook are more likely to come from a college-going family with expectations or goals for attending a four-year college than in other systems. Some systems and schools are likely to be more richly resourced and focused around this objective. By contrast, the system which posted the second highest college-going rate this year, the Oneonta City System, sent 50 percent of its graduates to four-year colleges and 36 percent of its graduates to two-year college, for an overall college-going rate of 87 percent. While two-year colleges have historically been a choice because of needed academic catch-up or cost, with new ideas around a changing workforce they may increasingly become the first choice for students in a variety of systems.
The college-going data also highlights the high-performance levels of magnet high schools. For instance, as a system, Montgomery County Schools have an overall college-going rate of 56 percent among its graduates. However, three of its magnet high schools, Booker T Washington, Loveless Academic Magnet Program, and Brewbaker Technology Magnet High School, have college-going rates above 90 percent, which ranks all three in the top 10 among Alabama high schools for college-going.
The data is also presented for schools and systems in statistical form or as represented on a map. Look for selectors on each of the data visualizations that allow you to change the statistic, the schools or systems in the comparison, or the year of the data.
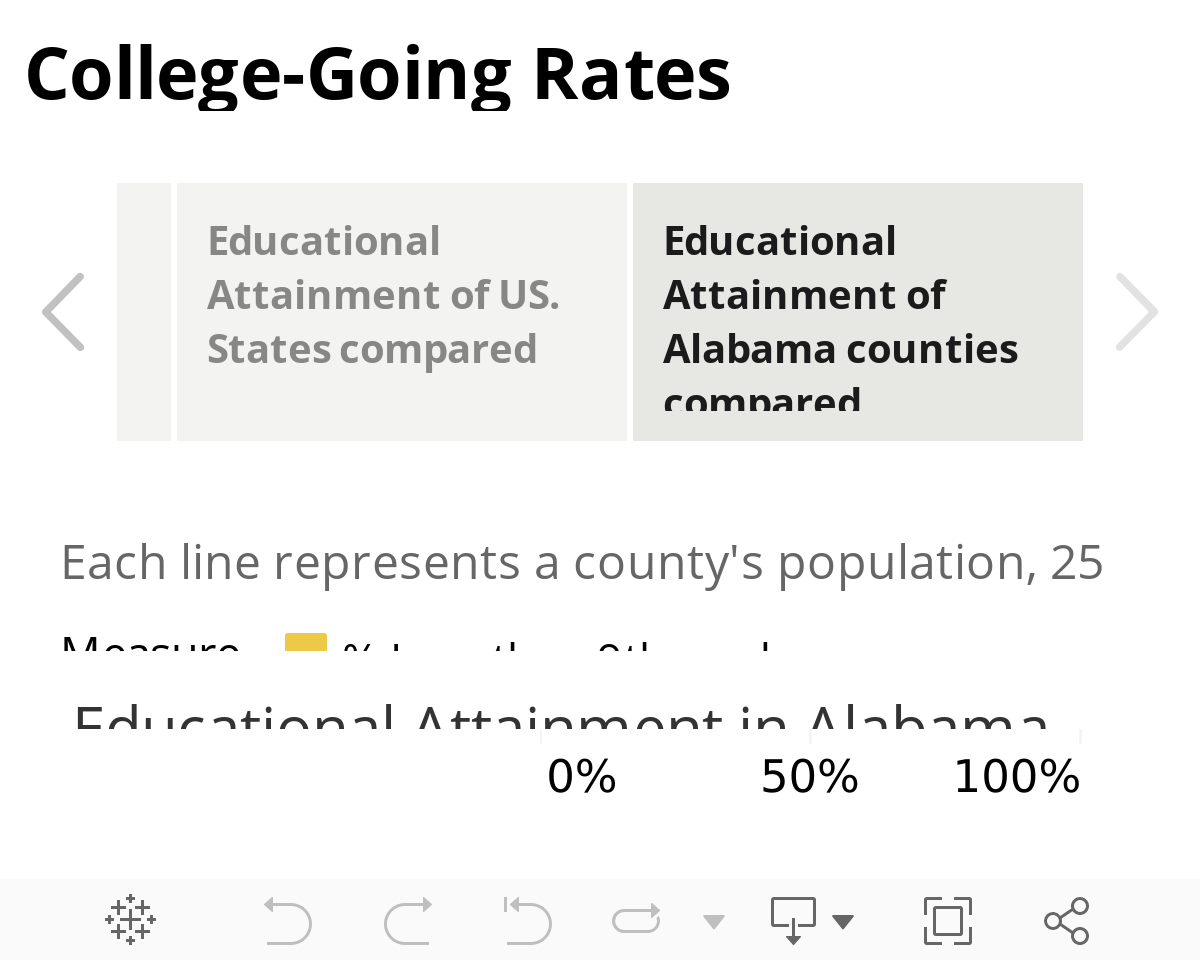
College-going rates are a building block for educational attainment, though entry into college is only one step on the journey to a degree. The rate at which student persist in and graduate from college is also important. Alabama lags behind other states in terms of educational attainment, according to statistics generated by the U.S. Census Bureau.
Educational attainment levels also vary widely by county. Half the adult population of Shelby County has an associates degree or higher, the highest level of educational attainment in the state.
On the opposite end of the rankings is Conecuh County, where only 14 percent of the adult population has an associates degree or higher, according to Census estimates.