Alabama’s 2016 school and system-level results for the ACT, the widely-known test of college readiness, are now available. With the interactive charts posted below, you can explore how well your local public school system or high school is preparing students for college-level academics.
The 2016 results are for those students who graduated from high school in 2016. Compared to 2015, both more graduates and a higher percentage of graduates took the test in 2016. The percentage of tested students demonstrating college readiness in English, science and reading fell slightly from 2015 levels, while the percentage found to be college ready in math and the percentage of students achieving all four benchmarks remained steady. The average composite scale score for Alabama students was 18.7.
This is the second year of results for which the state of Alabama made the ACT available to all students. In the past, only students who were college bound and who paid for the test themselves took the test. Now, it is offered to all high school students who take the test in their junior year. Some take it again in their senior year. The results reflect the final performance level of students who graduated from high school.
Because all Alabama students take the ACT, Alabama’s results shouldn’t be compared to the national average or to other states in which a more limited number of students take the ACT.
The ACT is one of several measures that state and local schools use to determine whether their graduates are ready for college and career.
In addition to succeeding on the ACT, a student can be classified college or career ready if he or she:
- Scored at either the silver, gold or platinum level on WorkKeys, a test that measures workplace skills
- Earned a passing score (3 or above) on an Advanced Placement or International Baccalaureate exam
- Received an industry-recognized credential recognized in the appropriate business sector
- Earned college credit through dual-enrollment at a two-year college or university
-
Successfully enlisted in the U.S. military
The cumulative college and career readiness rate for the Class of 2016 has not been published yet. For the graduating Class of 2015, the State Department of Education reported that 68 percent of graduates met one of those definitions of career/college readiness.
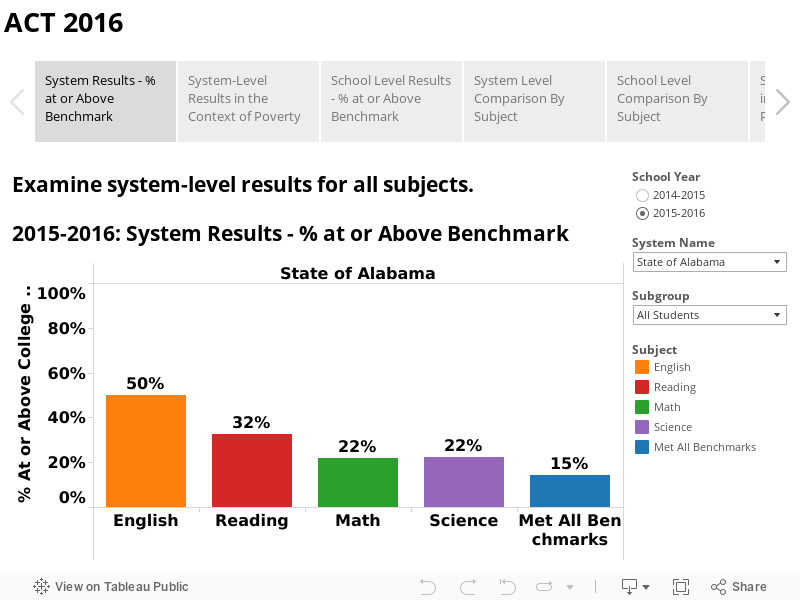
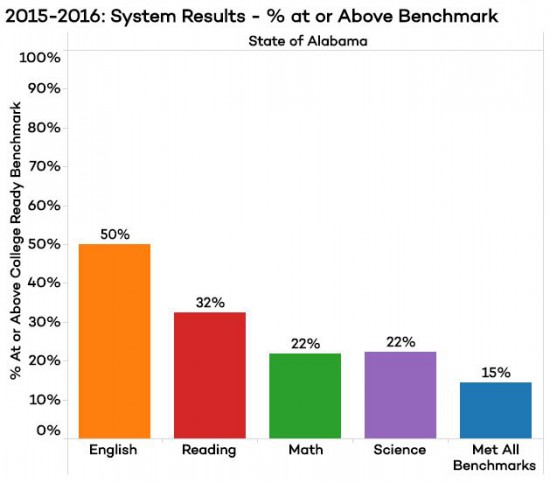
On the ACT, the state counts a graduate as college ready if he or she scores at or above the college-ready benchmark in one of four subjects on the ACT: English, reading, math, or science. According to the ACT, if a student meets or beats the college-ready benchmark in a subject, that student has a 50 percent chance of making a B or better in a college-level course in that subject and a 75 percent chance of making a C or better.
In 2016, statewide, 50 percent of students scored college ready in English (down from 52 percent in 2015); 32 percent achieved the benchmark in reading (down from 33 percent); 22 percent in math (level with 2015); 22 percent in science (down from 24 percent in 2015). Only 15 percent of students statewide scored, met or exceeded all four college-ready benchmarks (level with 2015).
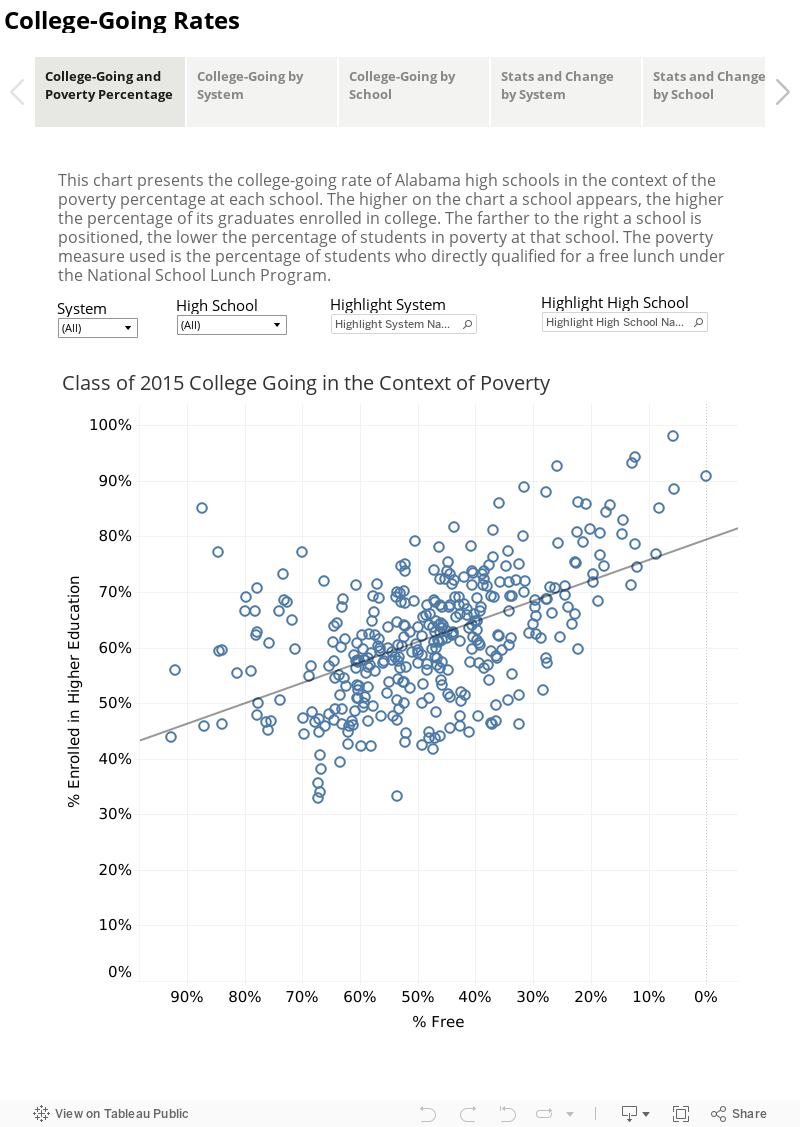
This year’s ACT results follow a similar pattern to results on the Aspire, the standardized tests given to children in grades 3-8 and 10th grade. In systems with lower rates of poverty, a higher percentage of students meet or exceed the college-ready benchmark. In systems with higher poverty percentage, a lower percentage of students score at or above the benchmark. In the statewide results, that gap in ACT performance can be seen when comparing the contrasting results between different demographic subgroups. For example, the percentage of nonpoverty students meeting or exceeding the benchmark in English is 68 percent, while the percentage of students from poverty households who meet or exceed the ACT English benchmark is 35 percent. The nonpoverty vs. poverty gap is 27 percentage points in reading and 24 percentage points in both math and science.
One warning when exploring the data: while the data provided by the state allows comparisons between subgroups, it is, in some cases, inaccurate where the poverty and nonpoverty results are concerned. The state classifies students as falling in the poverty subgroup if they are eligible to participate in the National School Lunch Program. Traditionally, students qualified for the free or reduced school meals because their family qualified for food stamps or other poverty relief programs. Additional students from families with documented financial need could also be deemed eligible. More recently, the federal government began allowing schools and systems with a high percentage of poverty students to offer free lunches to all students. In those schools, all students are included by the state in both the poverty and nonpoverty results. A list of participating schools and systems can be found on the State Department website. Consequently, care should be taken when making performance comparisons.