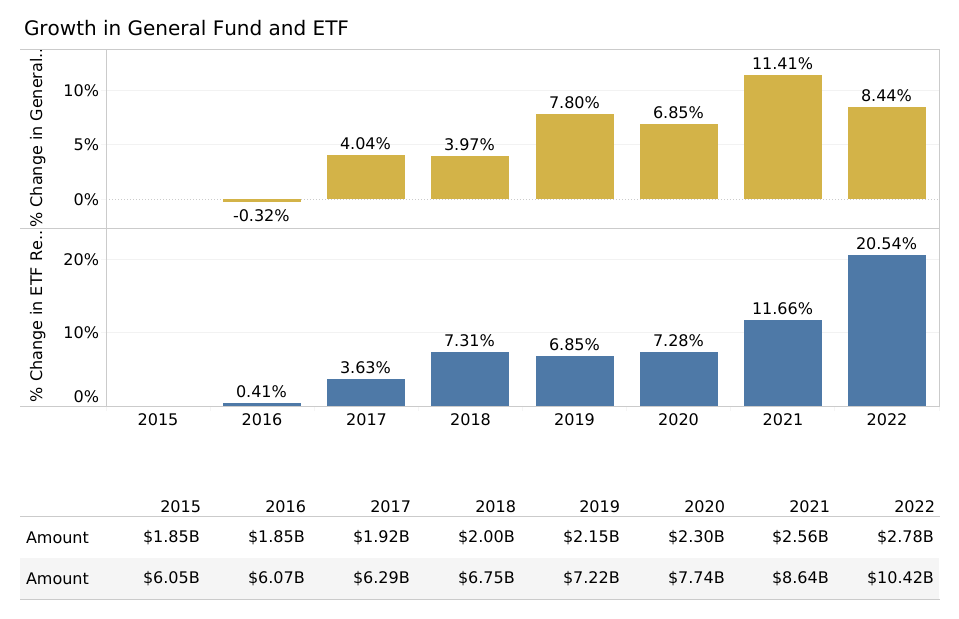
Alabama tax collections grew at an eye-popping rate in the 2022 fiscal year, with particularly strong growth in income tax collections (up 27% over 2021) and online sales (up more than 20%). The strong collections produced surpluses in both primary state accounts, the Education Trust Fund (ETF) and the General Fund (GF).
Printable PDF available here
While the growth is sparking talks of rebates and tax cuts, it will be important for legislators to keep in mind that inflation will increase the cost of operating state government. At the same time, rising interest rates and diminishing levels of federal relief will likely slow growth going forward.
Alabama has had a string of record years when it comes to tax collections, with no discernable drag caused by the pandemic shutdown and the subsequent recovery. Preceding the pandemic, Alabama experienced historically low unemployment and was beginning to increase labor force participation rates, drawing discouraged workers off the sidelines and contributing to income gains.
While the pandemic sent a sudden jolt through the economy, federal relief kept paychecks coming for many and provided stimulus money to households as well. Alabama’s dip in the second quarter of 2020 wasn’t as sharp as some states, and the economy reopened more quickly than some.
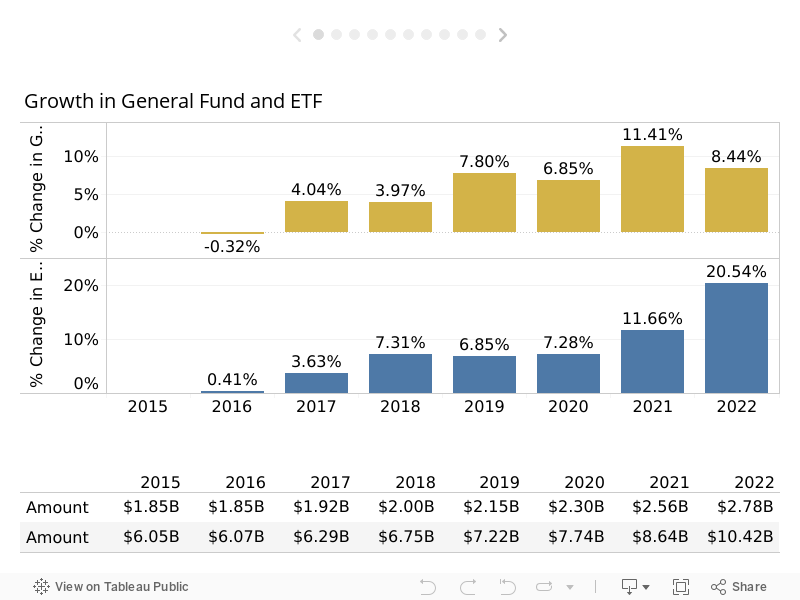
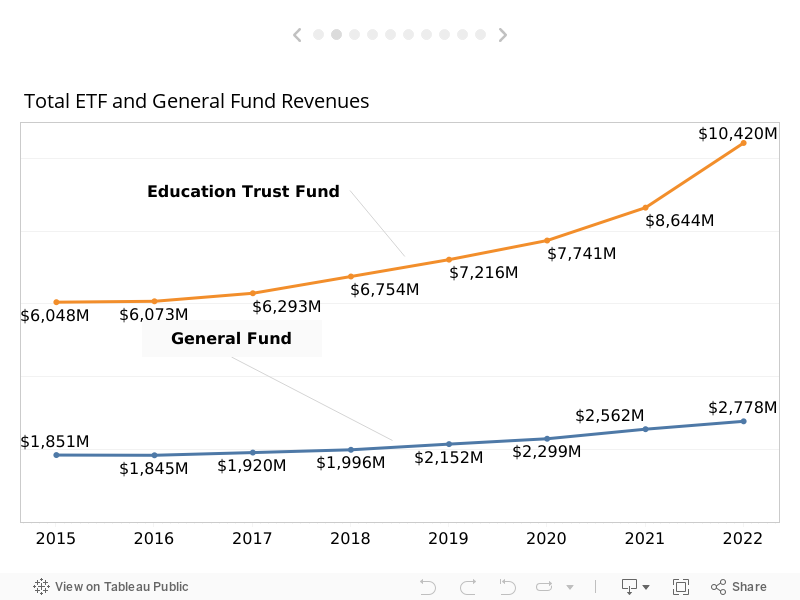
In FY 2021, the continued federal stimulus and the recovering job market produced record growth in tax collections. And in FY 2022, total collections grew even faster, 18% across both funds, with the strongest growth in the Education Trust Fund.
The Education Trust Fund
The ETF receives the receipts of state sales and income tax, plus a handful of other revenue streams.
Income and sales tax collections rise with a growing economy and can shrink when the economy contracts and goes into recession. Inflation, which has averaged below 3% over the past 20 years, averaged over 7% during 2022. Since people spend more, sales taxes rise, and tax collections also grow.
Income taxes
At the same time, during FY 2022, there was a strong demand for workers, with historically low unemployment. To attract and retain employees, employers increased wages. Alabama’s workforce returned to and exceeded pre-pandemic numbers in FY 2022. Alabama’s labor force participation rate is still 5% lower than the U.S. rate, but the strong job market has drawn more people back into the labor force.
During FY 2022, the number of people working in Alabama surpassed pre-pandemic peaks, though that didn’t occur until July 2022.
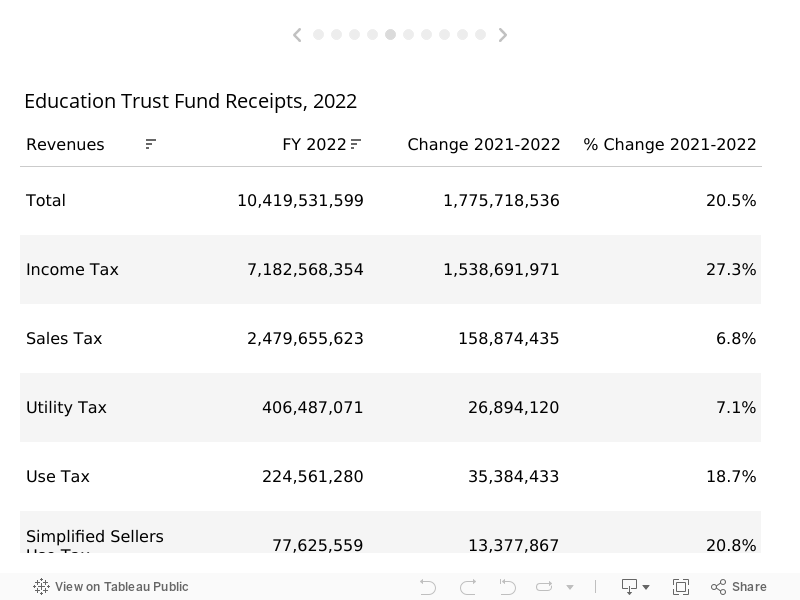
With more workers receiving higher pay comes higher income tax collections. The income tax receipts were up 27% in FY 2022, contributing a total of $7.2 billion to the ETF, up $1.5 billion from 2021. And 2021 wasn’t a down year. Income tax collections increased 21% in 2021. Even in FY 2020, the fiscal year that included the pandemic contraction, income tax collections rose almost 7%.
Rising income tax collections resulted from a variety of factors. In addition to rising wages, corporate profits have been, and continue to be, high. Alabama corporate income tax collections were up 33% in 2022, an increase of $325 million over FY 2022.
Another likely contributor to the substantial 2022 collections was stock market gains in 2021, a year in which the S&P 500 was up by 27%. Taxes on those gains would have flowed in during the 2022 fiscal year.
Considering the poor stock market performance in the 2022 calendar year, revenue from that source will be down in Fiscal Year 2023.
A final contributing factor to the growth of income tax collections is the return to a normal level of auditing by the government after pandemic-related restrictions on face-to-face interactions slowed those efforts. Some of the gains may be attributed to settlements from prior years and increased compliance in the current year.
Sales taxes
Meanwhile, state sales tax collections were up 7.66%. Inflation over the period is estimated to have been 7.7%. The state makes some adjustments to the sales tax before making a final deposit in the Education Trust Funds, which slightly decreased the percentage gain to the Education Trust Fund. Ultimately, revenue from sales taxes flowing to the ETF increased 6.8%, or $159 million. The Use Tax, a companion to the sales tax but assessed on out-of-state purchases of goods and machinery, was up 18%, contributing an additional $35 million to the ETF.
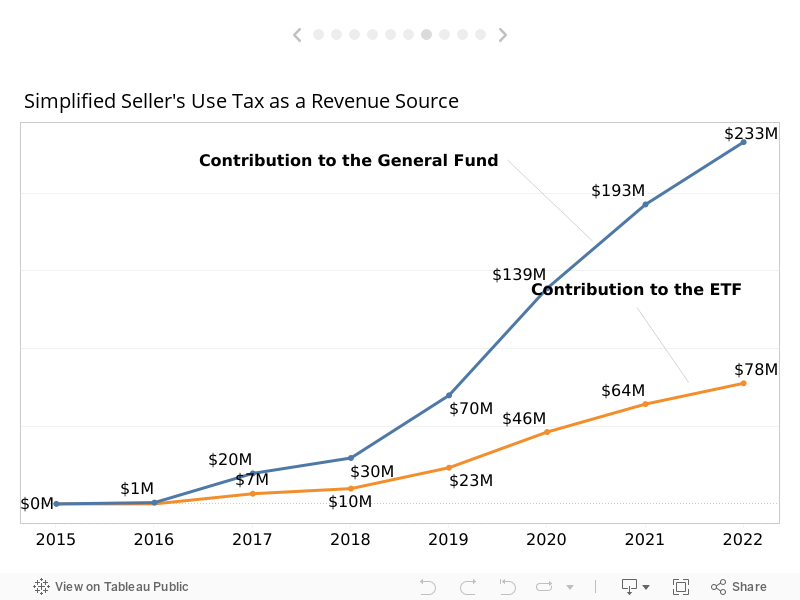
The state portion of the Simplified Sellers Use Tax (SSUT), a tax on online purchases, was up 21%, suggesting a continuing migration toward online shopping. Overall, the SSUT brought $311 million, but 75% of the proceeds went into the General Fund. The SSUT contributed $78 million to the ETF, $13 million more than in 2021.
Overall, the Education Trust Fund grew 21%, an increase of $1.78 billion, with total collections at $10.42 billion.
Because of the Rolling Reserve Act, the ETF is budgeted conservatively, with spending capped by a formula. That formula computes a historical growth rate for the fund, keeping lawmakers from overspending in periods of high growth and preserving funds for lean times. It more than did its job in FY 2022. The ETF bought in $2.75 billion more than the state budgeted for education spending in FY 2022.
When the Legislature convenes in March of 2023, the body will decide what to do with that surplus. While some are proposing tax rebates or cuts, others are urging caution.
The massive injection of federal aid for education, which amounts to over $3 billion over three years, will be tapering off in 2024. Teacher compensation will need to increase to keep pace with inflation and to attract young people into the profession. Regardless, the state has healthy reserves and has continued to budget conservatively with state funds. The FY 2023 ETF budget calls for spending $8.3 billion out of the ETF, $2 billion less than what was collected in FY 2022.
The General Fund
The General Fund also grew, but not at the same rate. This has been typical of the General Fund compared to the Education Trust Fund performance pattern. The Education Trust Fund grows fast when the economy grows, while the General Fund sees a slower growth rate. The General Fund is made up of a hodgepodge of revenue sources. It supports the operation of all the government’s non-education agencies, including Medicaid and the state prison system.
The Legislature has made several adjustments in recent years to increase growth in the General Fund. That’s important because expenses inevitably rise. Not only that, the state has chronically underinvested in some supported by the General Fund, the Department of Corrections, for example. A stable, growing revenue base is needed to address longstanding needs.
Simplified Seller’s Use Tax
The most successful of those adjustments was the establishment of the Simplified Sellers Use Tax (SSUT). The Legislature chose to devote 75% of this tax on Internet sales to the General Fund, which has been one of the state’s fastest-growing revenue sources. The move continued to pay dividends in Fiscal Year 2022.
Revenue from the SSUT was up 21%, an increase of $40 million, for a total contribution to the General Fund of $233 million.
While it continues to grow rapidly as more commerce moves online, the SSUT’s growth rate is slowing. Between 2019 and 2020, revenue from the SSUT doubled, then grew by almost 40% in 2021. In the first years of the tax, revenue grew quickly as vendors who previously hadn’t collected online sales taxes joined the system. Digital commerce also grew especially quickly during the pandemic. The shift toward digital commerce will continue, but revenue gains won’t likely advance as rapidly going forward.
Other sources
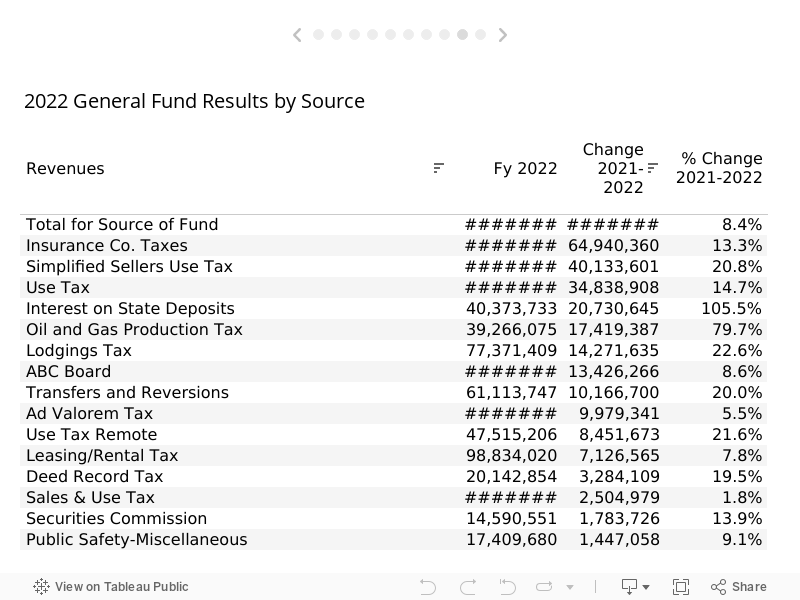
Insurance company taxes also provided a major boost to the General Fund in 2022, up 13% or $65 million more than it did in FY 2021. The tax is assessed on the value of insurance premiums issued. The Insurance Company tax is the largest tax source in the General Fund at $554 million in FY 2022. Before FY 2021, $30 million of the Insurance Company Tax was transferred to the Education Trust Fund. That has ended, providing more support for the General Fund.
The Use Tax, at $272 million, was the second largest contributor to the General Fund. This is a tax on purchases of cars, machinery, boats, mobile homes, or other goods in other states for use in Alabama. A 2015 change in the distribution formula for the Use tax has allowed a greater portion of the tax to flow to the General Fund. In 2022, revenue to the General Fund from the Use Tax increased by 18%, providing an additional $35 million than in 2021.
Rising interest rates increased revenue from the interest earned off State deposits. Revenue doubled, increasing by $20 million to $40 million.
Higher energy prices boosted the tax revenue from Oil and Gas Production taxes, up by 80%, an increase of $17 million.
Total growth in the General Fund increased 8.4%, a slightly higher rate of increase than the inflation rate during the period. Total collections increased from $2.56 billion to $2.87 billion, up $31 million. By the end of 2022, receipts to the General Fund were $351 million above FY 2022 budgeted expenses. The Legislature anticipated the surplus and applied it to the 2023 budget.
The Big Picture
The revenue flowing into the General Fund and the Education Trust fund presents only a portion of the state government spending in Alabama. In addition to the taxes earmarked for the Education Trust Fund and the General Fund, other state revenue streams flow directly to agencies. For example, taxes on motor fuels flow to the Alabama Department of Transportation for highway building. State colleges and universities collected tuition. Federal funds help pay for highways, Medicaid, education, and social services.
About half of Alabama’s public spending is for education, and half is for non-education agencies.
Rainy Day
If a recession does cause a contraction in revenues, Alabama is in a better position to weather a downturn than in the past. According to a recent analysis by Pew Charitable Trust, Alabama has the 20th strongest reserves, with $1.4 billion stashed away in Rainy Day Funds. According to Pew’s calculations, Alabama could run 49 days on the amount it has in reserve.