The ACT Aspire, a suite of standardized tests given statewide to students in grades 3-8 and 10, has been the State of Alabama’s primary tool for measuring the academic progress of Alabama public schools since the 2013-2014 school year.
Over the course of four administrations of the Aspire, students showed progress on most measures. By 2017, the percentage of children scoring proficient on the Aspire had improved in most grades and subjects, in some cases significantly. (To explore the data on your own, including views that allow for interactive comparisons between selected schools and systems, follow this link. To view the visualization in full screen, click the button on the bottom right corner).
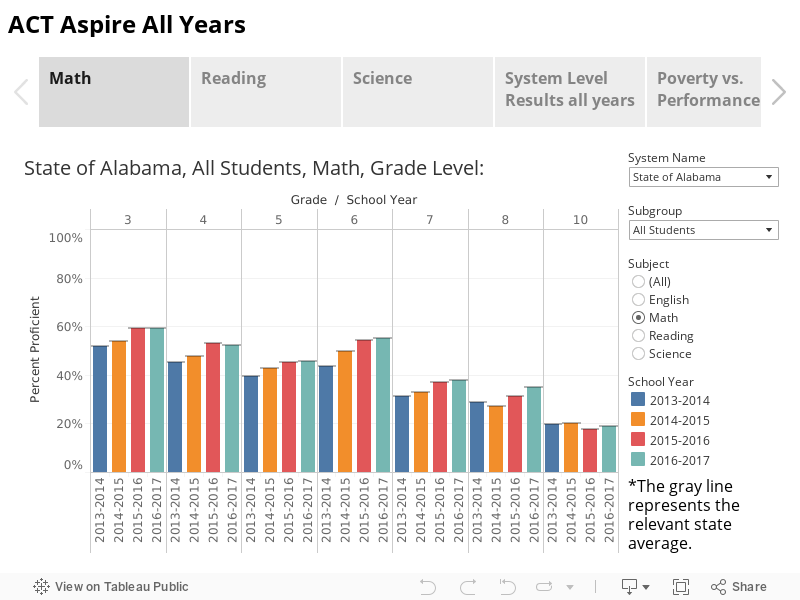
The gains in math were the strongest. All grades saw steady improvements, except for 10th grade where the percentage proficient was basically flat. The implementation of Aspire roughly coincided with the adoption of new state standards in mathematics, which were intended to increase students’ depth of understanding of mathematical concepts. Though the Aspire has now been replaced by a different standardized testing system developed by Scantron, math proficiency levels will continue to be of crucial interest. On the National Assessment of Educational Progress (NAEP), the national benchmark testing system, Alabama students have been at or near the bottom of the country. On the 2017 NAEP, Alabama students posted slight gains (Click here for Alabama 2017 NAEP Results). Continued improvement in mathematics instruction is needed.
In reading, the percentage of children scoring proficient improved modestly in grades 3-6, but results for grades 7, 8 and 10 were mixed. Alabama had made significant progress in reading achievement, progress that coincided with investment in and deployment of the Alabama Reading Initiative (ARI). In the wake of the Great Recession, funding for the program was cut and school systems were given the flexibility in their use of ARI funds. The most recent state budget included a $4 million increase for ARI but stipulated that the program return to its initial focus on early grade reading.
Aspire tests for science were not uniformly administered for all grades in all years, but in the years and grades available, gains were also made in that subject.

In Alabama and across the country, the differences in the proficiency rates among various subgroups of students remains a concern. In both the state and the nation, the percentage of students from poverty backgrounds scoring proficient is about 25-30 percentage points lower than the percentage of nonpoverty students scoring proficient. Similar gaps between whites and blacks, and whites and Hispanic students.

As a result of those gaps, the percentage of the student body in a school system tends to predict the overall proficiency levels achieved by the students on these standardized tests. The scatterplot chart below shows this general correlation between proficiency levels and poverty levels. A school system’s proficiency rate determines its vertical position on the chart (higher on the chart, the higher the proficiency rate). A system’s poverty percentage, based on the percentage of students directly qualifying for free meals under the National School Lunch Program, determines the system’s position on the horizontal axis, with higher poverty districts to the left of the chart and lower poverty districts progressing to the right.
Though the correlation is obvious, it is also obvious that systems with similar poverty levels often show very different proficiency levels. In other words, the school systems can and do exceed expectations, through effective teaching, resources, and organization.

As a testing tool, Aspire had both fans and detractors. Critics complained that resources for preparing for the test were lacking and that results were not provided quickly. They also questioned whether the tests were properly aligned with the state’s course of study. Fans appreciated the fact that Aspire results were aligned with the ACT, the widely used college entrance exam. Thus, a student’s score on the Aspire tests served as a predictor for eventual performance on the ACT.
The test’s results, which showed lower proficiency rates than the previous state test, the Alabama Reading and Math Test, were also considered by many a more accurate reflection of students’ performance. Aspire proficiency levels for Alabama students were closer to the results Alabama students produced on the National Assessment of Educational Progress, though Aspire proficiency percentages were still higher than Alabama NAEP proficiency levels. Here is a comparison of Aspire and NAEP results for Alabama, with the proficiency levels for national public schools included for comparison.
| Jurisdiction | Test | % of students at or above Proficient | |
|---|---|---|---|
| 4th Grade Math | National public | NAEP | 40% |
| Alabama | NAEP | 31% | |
| Alabama | Aspire | 49% | |
| 4th Grade Reading | National public | NAEP | 35% |
| Alabama | NAEP | 31% | |
| Alabama | Aspire | 39% | |
| 8th Grade Math | National public | NAEP | 33% |
| Alabama | NAEP | 21% | |
| Alabama | Aspire | 30% | |
| 8th Grade Reading | National public | NAEP | 35% |
| Alabama | NAEP | 28% | |
| Alabama | Aspire | 46% |