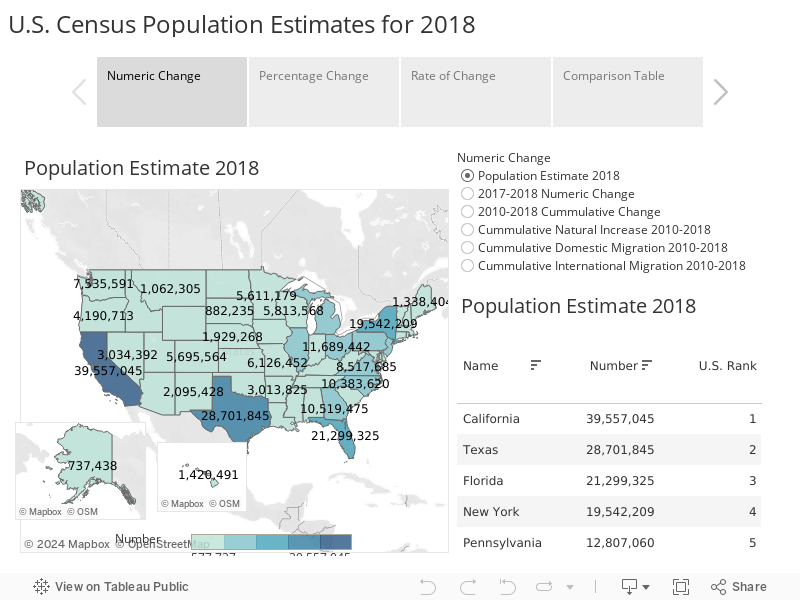
As Alabama approaches its 200th birthday, the state is still adding population but at a slower rate than most of its Southeastern neighbors.
The U.S. Census Bureau released new state-level population estimates in December, providing estimates of state populations as of July 1, 2018. The data release also includes state-level estimates for the underlying components of population change. A closer look at the components provides insight on the factors affecting Alabama’s growth rate. According to the Census, Alabama has:
- The second highest death rate among U.S. States. West Virginia’s is the highest.
- The fourth lowest rate of international in-migration.
- A positive rate of domestic in-migration, but a rate that is slower than some Southeastern neighbors.
For the most part, the 2018 estimates extend trends among Southeastern states that have been in place since 2010: more rapid growth along the East Coast and in Tennessee, slower growth and even some estimated population loss in the Southeastern interior states.
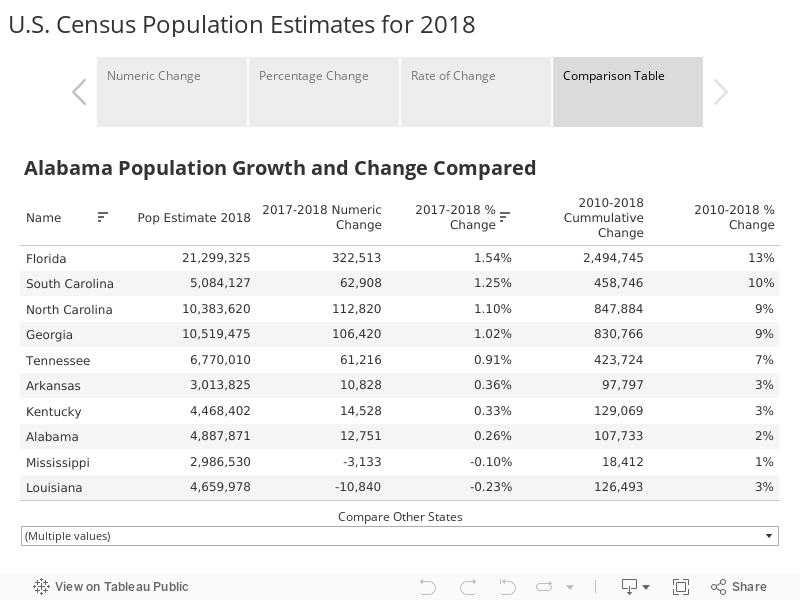
In the national context, the highest percentage population growth is taking place in the Mountain West states of Nevada, Idaho, Utah, and Arizona, with Texas and Florida also placing near the top. A second group of states — Washington and Oregon on the West Coast; Colorado in the Mountain West; and the Carolinas and Georgia on the East Coast; constitute a second tier of growth states with population increases of 1 percent or greater. Alabama falls into a third tier, with growth under 1 percent. Alabama’s population increased an estimated 0.3 percent increase. Eight states, including Mississippi and Louisiana, in the Southeast, lost population in 2018, according to the Census estimates.

To estimate population change, Census tracks births and deaths in a state and estimates the number of people moving in and moving out. According to the 2018 estimates, these are estimated totals for Alabama:
| State | Distribution (billions) |
|---|---|
| Alabama | $1.901 |
| Alaska | $1.250 |
| Arizona | $2.822 |
| Arkansas | $1.250 |
| California | $15.321 |
| Colorado | $2.233 |
| Connecticut | $1.382 |
| Delaware | $1.250 |
| Florida | $8.328 |
| Georgia | $4.117 |
| Hawaii | $1.250 |
| Idaho | $1.250 |
| Illinois | $4.914 |
| Indiana | $2.610 |
| Iowa | $1.250 |
| Kansas | $1.250 |
| Kentucky | $1.732 |
| Louisiana | $1.803 |
| Maine | $1.250 |
| Maryland | $2.344 |
| Massachusetts | $2.673 |
| Michigan | $3.873 |
| Minnesota | $2.187 |
| Mississippi | $1.250 |
| Missouri | $2.380 |
| Montana | $1.250 |
| Nebraska | $1.250 |
| Nevada | $1.250 |
| New Hampshire | $1.250 |
| New Jersey | $3.444 |
| New Mexico | $1.250 |
| New York | $7.543 |
| North Carolina | $4.067 |
| North Dakota | $1.250 |
| Ohio | $4.533 |
| Oklahoma | $1.534 |
| Oregon | $1.635 |
| Pennsylvania | $4.964 |
| Puerto Rico | $2.241 |
| Rhode Island | $1.250 |
| South Carolina | $1.996 |
| South Dakota | $1.250 |
| Tennessee | $2.648 |
| Texas | $11.243 |
| Utah | $1.250 |
| Vermont | $1.250 |
| Virginia | $3.310 |
| Washington | $2.953 |
| West Virginia | $1.250 |
| Wisconsin | $2.258 |
| Wyoming | $1.250 |
| Subtotal | $141.239 |
| Territories | $263 |
| Tribal governments | $8 |
| District of Columbia | $495 |
| U.S. TOTAL | $150,000,000,000 |
To be able to compare those numbers to other states, it is necessary to compute a rate for each measure. The Census expresses rates as a number per 1,000 residents. For example, Alabama had a death rate of 10.9, that’s 10.9 deaths for every 1,000 residents. Alabama’s death rate has been consistently high according to Census estimates, which are based on population estimates and death records collected by public health agencies. Alabama’s population is older than the average state. That effects population in two ways. Older residents are more likely to die, and younger people are more likely to have children. In addition, Alabama residents, by many measures are less healthy than residents in other states and have a shorter life expectancy than residents of most other states. Alabama’s high death rate ultimately depresses the state’s rate of natural increase, which ranks 43 among U.S. states.
| Allowed Expenditures | Disallowed Expenditures |
|---|---|
| Direct medical expenses | Damages covered by insurance |
| COVID-19 testing | Payroll or benefits expenses for employees whose work duties are not substantially dedicated to mitigating or responding to the COVID-19 public health emergency. |
| Emergency medical response | Expenses that have been or will be reimbursed under any federal program. |
| Public telemedicine | Reimbursement to donors for donated items or services. |
| Public health communications | Workforce bonuses other than hazard pay or overtime. |
| Personal Protective Equipment | Severance pay |
| Cleaning and disinfecting public areas | Legal settlements |
| Quarantine expenses | |
| Payroll for public safety, public health, health care, human services, and similar employees responding to COVID-19 | |
| Food delivery to vulnerable populations | |
| Facilitating distance learning for schools | |
| Costs of sanitation and social distancing in prisons and county jails | |
| Care for homeless populations | |
| Unreimbursed unemployment insurance costs related to COVID-19 |
The other way states grow or shrink is residents leaving or new residents moving in. Alabama has a positive rate of domestic migration, netting 5,718 new residents that moved to Alabama from other U.S. states. However, Alabama doesn’t attract many transplants from other countries. Alabama ranked 47th in its international migration rate, adding only 3,344 new residents from other countries. That left the state’s overall migration rate in the midrange of U.S. states.
According to the estimates, Alabama continues to be outpaced in population growth by South Carolina, a demographically similar state that was smaller than Alabama at the time of the 2010 Census. Since 2018, South Carolina’s population growth has accelerated, particularly in terms of domestic migration. Since 2010, South Carolina has surpassed Alabama in population, adding more than 450,000 new residents, while Alabama has added just over 100,000. The interactive maps and charts below allow you to explore the data and make your own comparisons of numeric change, percentage change and rates of change. Expand the display by clicking on the full screen icon on the bottom left of the graphic.