After a year and a half of Covid-clouded schooling, only about half of Alabama students, grades 3-8, scored proficient in reading, and less than a quarter reached the proficient level in math on the state’s new statewide standardized test, the Alabama Comprehensive Assessment Program (ACAP). If the Alabama Literacy Act were in full effect this year and the reading cut score was set at the level recommended by experts, 23% of third-graders taking the test, or almost 12,000 students statewide, would be in jeopardy of being held back, based on the results.

The results are both shocking and familiar. At the same time, though, it’s hard to know what to make of them.
- It’s the first year of a new test, the 4th variety of statewide assessment given over the past decade (5th if you include the NAEP).
- ACAP was taken in the spring of 2021, after Covid’s unprecedented disruption of the education system. A significant number of students did not have a full-year of in-person instruction.
- Because of the disruption, the results are not being considered by the state accountability system. Schools will not be graded based on the scores.
- Statewide, 93% of students took the ACAP, an impressive percentage considering the conditions, but participation was significantly lower in some districts.
- The acheivement levels for the test have just been set and need additional evidence to establish their validity.
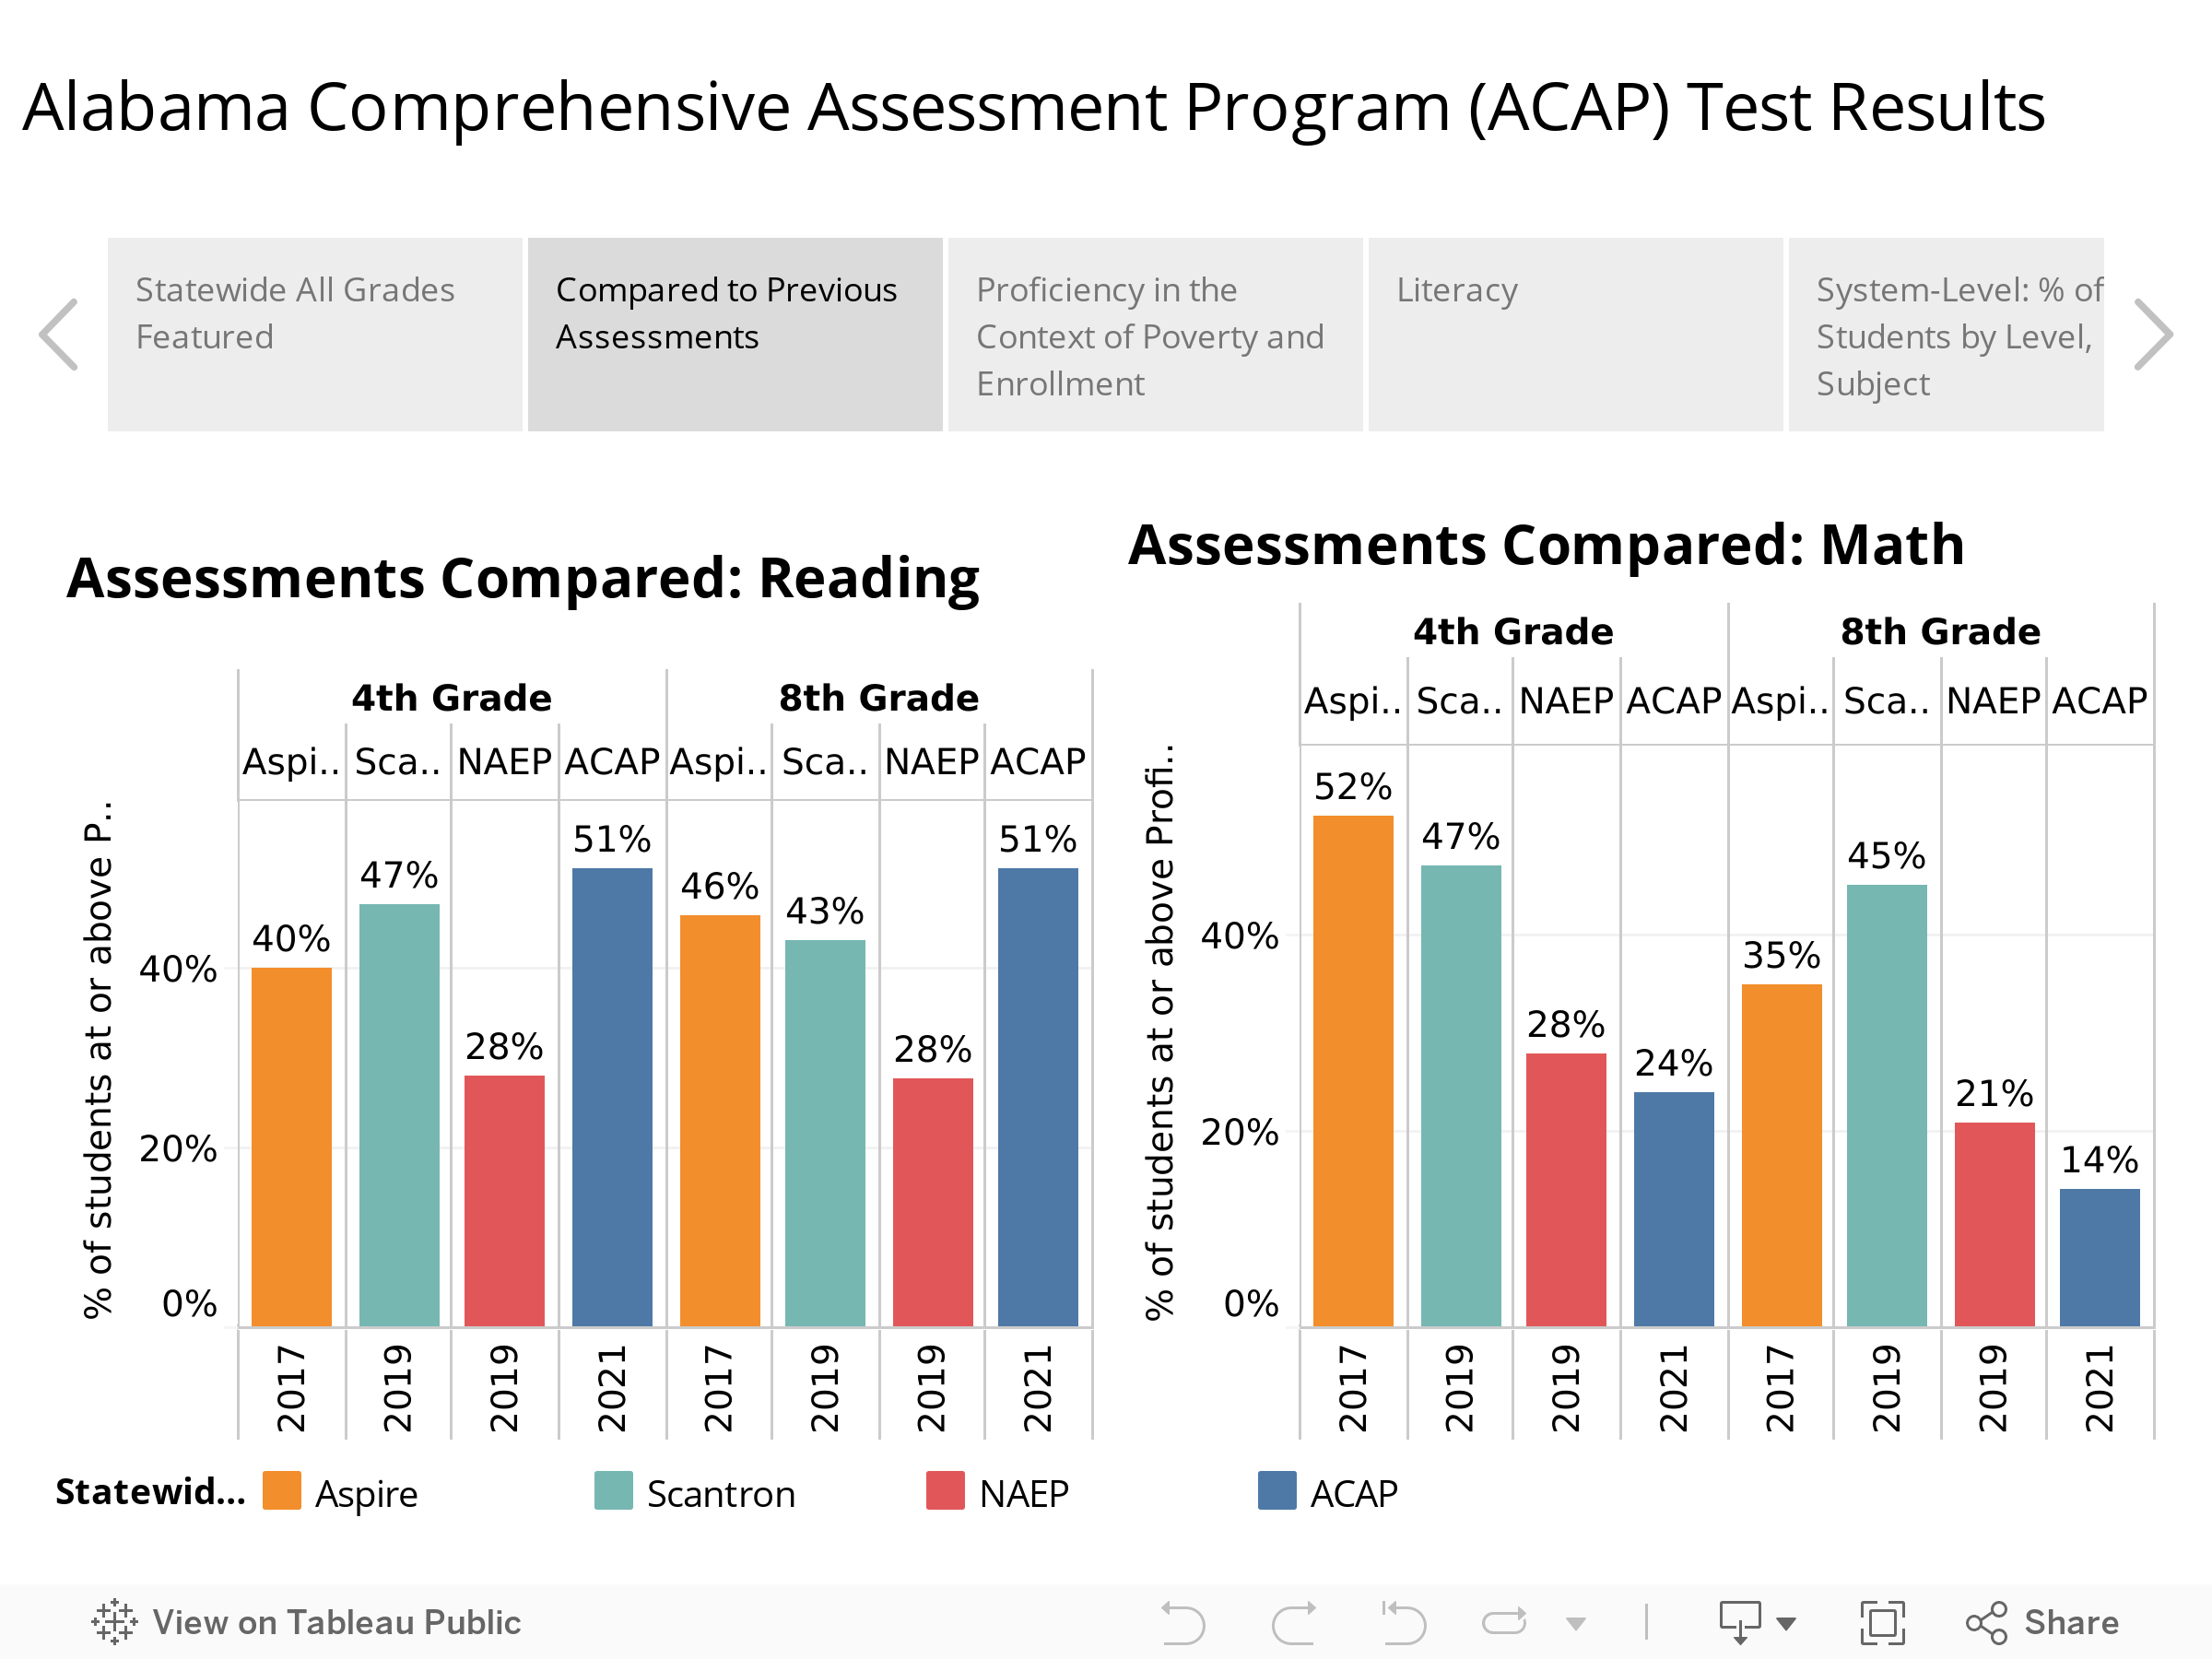
Accepting all those caveats, a deeper look shows familiar patterns. Figure 2. compares Alabama student scores on the ACAP and the two standardized tests the state has used to judge performance: the Aspire, given most recently in 2017, and Scantron, most recently administered in 2019. Also in the comparison is the 2019 National Assessment of Educational Progress (NAEP), a national test given to a representative sample of each state’s students. NAEP, also known as The Nation’s Report Card, is the only test that allows for comparison with students in other states.
ACAP results in English Language Arts (ELA) are higher but in roughly the same range as prior state assessments, with half of students proficient. However, only 28% of Alabama students scored proficient or above in reading on NAEP in 2019.
ACAP’s math percentages (24% of 4th graders and only 14% of 8th graders) are close to and even worse than Alabama’s performance on the NAEP in 2019. Alabama has consistently scored at or near the bottom on math for a decade on the NAEP. ACAP’s low math results contrast with the higher proficiency percentages generated by Scantron and the Aspire in math.
An optimistic view of the test results is that during a period of disrupted learning, students maintained progress in English and reading. The loss of in-person instruction and practice time may have done more damage in math. Regardless, the results indicate that Alabama needs to develop the same level of urgency about math as it is currently directing at reading.
Literacy Act Implications
ACAP’s results are also being closely studied because of the impending impact of the Alabama Literacy Act, which requires that students be reading on grade level by the end of the third grade. If students fail to meet that benchmark, they are to repeat third grade.
ACAP scores serve as the first identifier for those students vulnerable to being held back. Starting this spring, third-grade students who don’t make a specified cut score on the reading portion of the English Language Arts ACAP will receive intensive intervention, further evaluation, and perhaps retention. The State Board has not finalized that cut score yet but is scheduled to at its next meeting. At its October 14, 2021, meeting the board received recommendations from a technical advisory committee on what the cut score should be.
If the committee’s recommended cut score were in place this year, 23% of students would be judged to be below grade-level expectations in reading and, potentially, could have been held back. However, the technical advisory committee also unanimously recommended that the retention provision of the law not go into effect this coming spring. Committee members said that an additional year of test results are needed, results generated in more normal conditions, in order to affirm the validity of the cut score.
Earlier this year, the Legislature passed a bill delaying the retention provision, but Gov. Kay Ivey vetoed the bill. In issuing her veto, Ivey said the Legislature could revisit the issue after seeing the 2021 test results.
When the retention provision does take effect, students who don’t make the ACAP reading benchmark would be offered intensive intervention at a summer literacy camp and would be retested later in the summer. Other conditions and evidence would also be considered before the child is recommended for retention. For instance, students who have been previously provided with two years of reading intervention or students who already have an Individualized Education Plan in place would be eligible to progress with their classmates, though they would still be provided with continued support to get them up to grade level on reading.
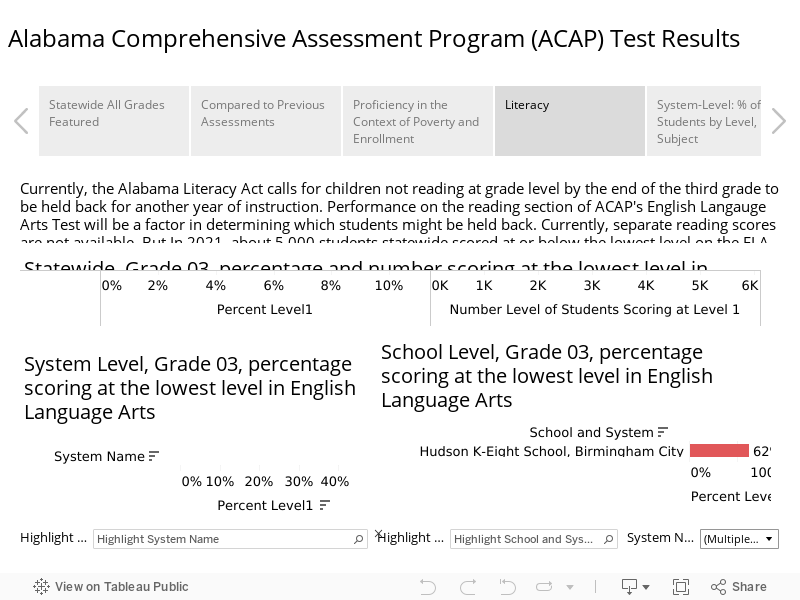
The reading results are not available at the school level because the cut score has not been set, nor have the results been calculated or published. However, the scores on the ELA section of ACAP provide some insight into how students performed across the state.
About 10 % of students, or 5,008 of the 55,000 third graders, scored at the lowest level, Level 1, on the ACAP’s ELA section. The number and percentage falling below the cut score on the reading subsection would be higher considering the figures presented by the technical advisory committee, a little more than double.
In the 30 best-performing school systems, less than 5% of third-graders scored in Level 1 range. However, in the 15 lowest-performing systems, 20% or more of the students scored at Level 1. That includes 32% of Birmingham City School students or close to 500 students in that system.
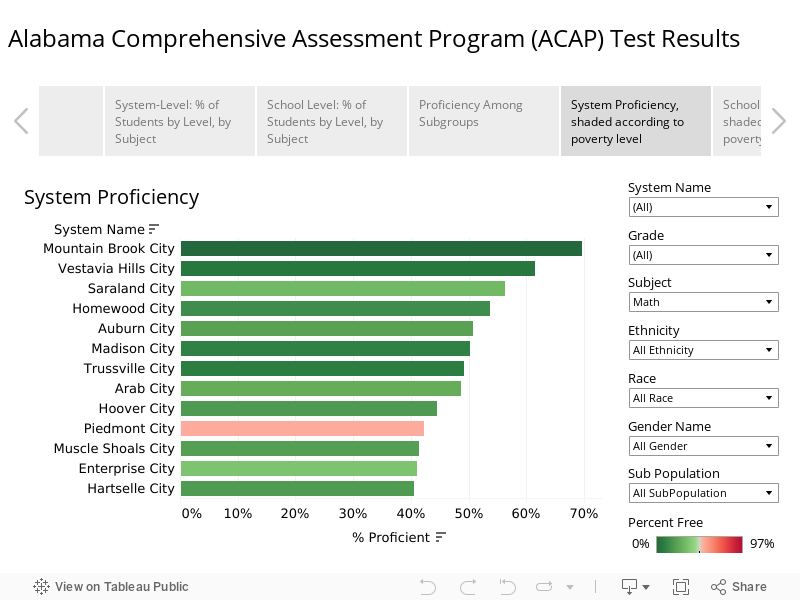
New Tests, Similar Relative Results
Regardless of where the proficiency bar is set, the relative performance of the state’s various school systems on these standardized tests tends to remain constant. There is a socioeconomic component: the higher the percentage of economic disadvantage in a school, the lower the percentage of students scoring proficient. Figure 3 shows that as poverty decreases, proficiency rates increase. At the same time, Figure 3 shows that systems with the same level of poverty can produce vastly different proficiency rates. In Tarrant, 53% are economically disadvantaged, and only 10% of students tested were proficient. By contrast, Piedmont’s rate of economic disadvantage is the same. Still, half its students scored proficient, exceeding the state’s average despite having a higher poverty percentage than the state as a whole. So while income matters, a system’s approach, its setting, resources, and community support, can make a difference.

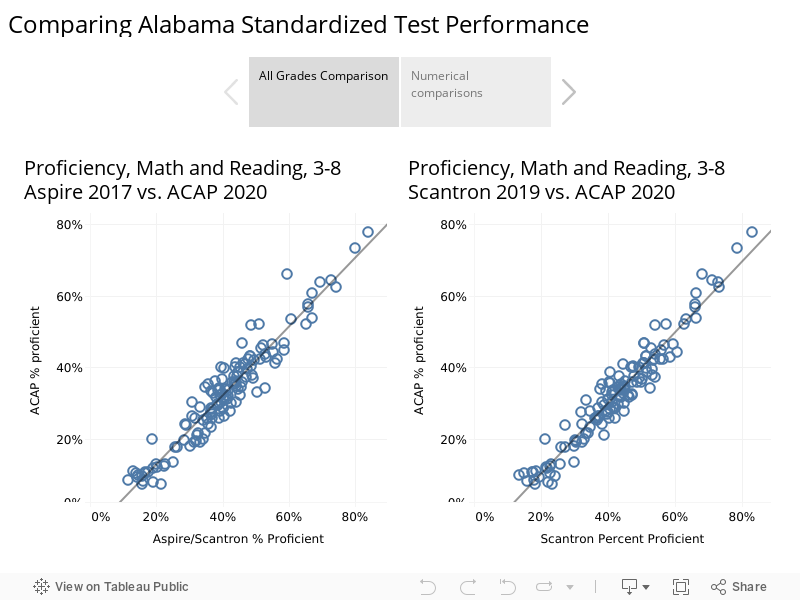
And despite the complaints about previous tests, the new ACAP tests, which are specifically designed for Alabama and its academic standards, showed very similar patterns in relative performance. Schools systems that performed well on previous tests did well on ACAP. Those that struggled previously struggled again. The graphs in Figure 4 compare ACAP results with prior results on Aspire and Scantron for Alabama school systems. The tight grouping along the line of prediction indicates a strong correlation between ACAP performance and performance on previous standardized tests.
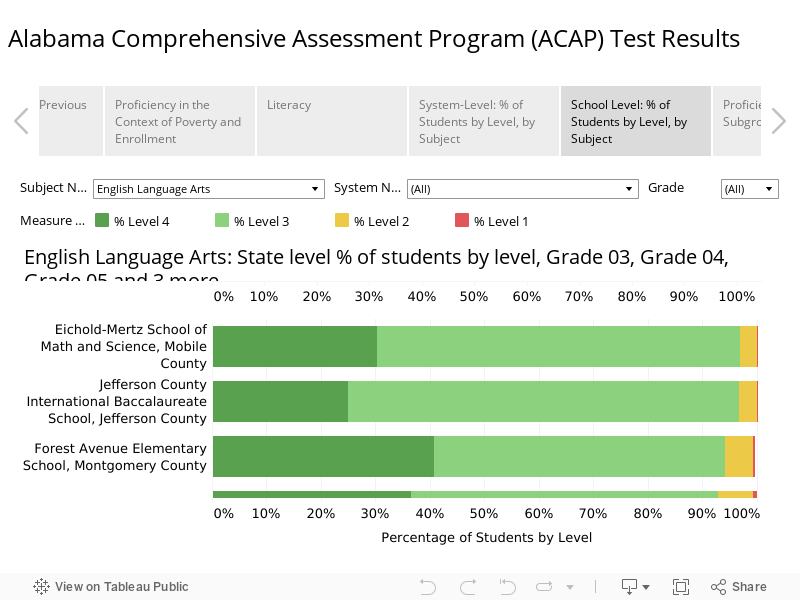
Performance by Level
As noted above, student scores are divided into four levels. Students scoring in Levels 3 and 4 are considered proficient for their grade level. The percentage scoring proficient in the graphic below is represented by shades of green (dark green for Level 4 and light green for Level 3). The percentage of students at Level 2 is illustrated in yellow, while the percentage at Level 1 is represented in red. The menu allows a choice between subjects.
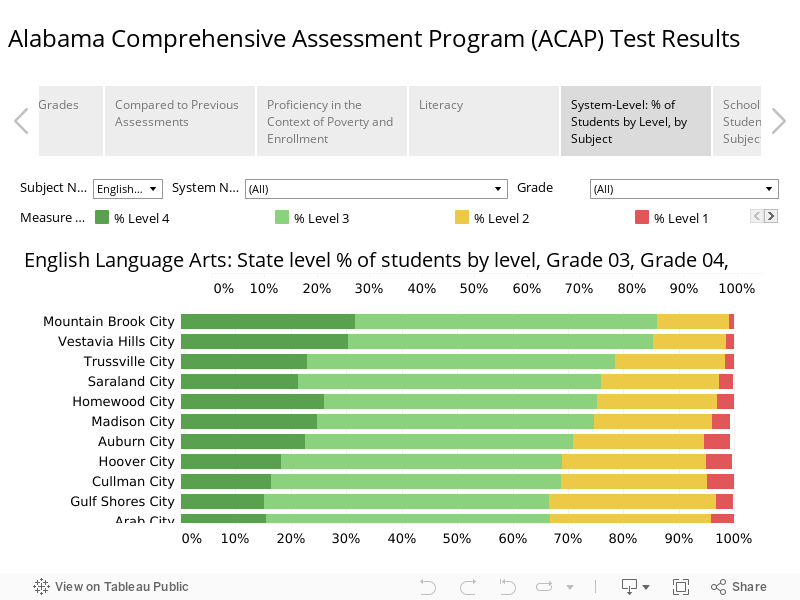
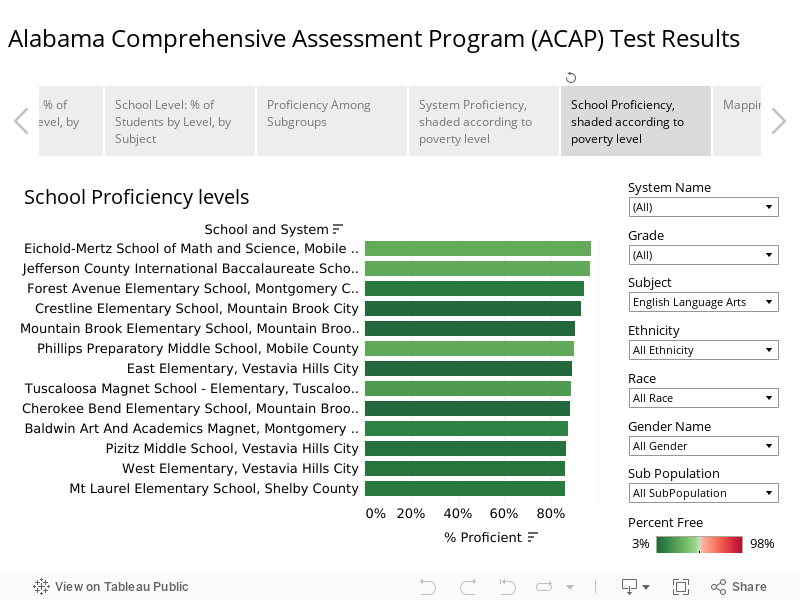
That display by level is also available for schools.
System, School, and Subgroup Performance
The charts below allow for a deeper exploration of the data, including the ability to report on performance by gender, race, ethnicity, and by other subpopulations of students. In systems and schools where there are small numbers of students within a subgroup, results are not displayed in order to protect student privacy.

The menus on the right allow a user to drill down into the results by subject, grade, gender, race, ethnicity, and subpopulation.
Results are also available at the school level.
And finally, the ACAP proficiency levels can be explored through this interactive map. Toggle between subjects and grade levels using the controls to the right of the map.
