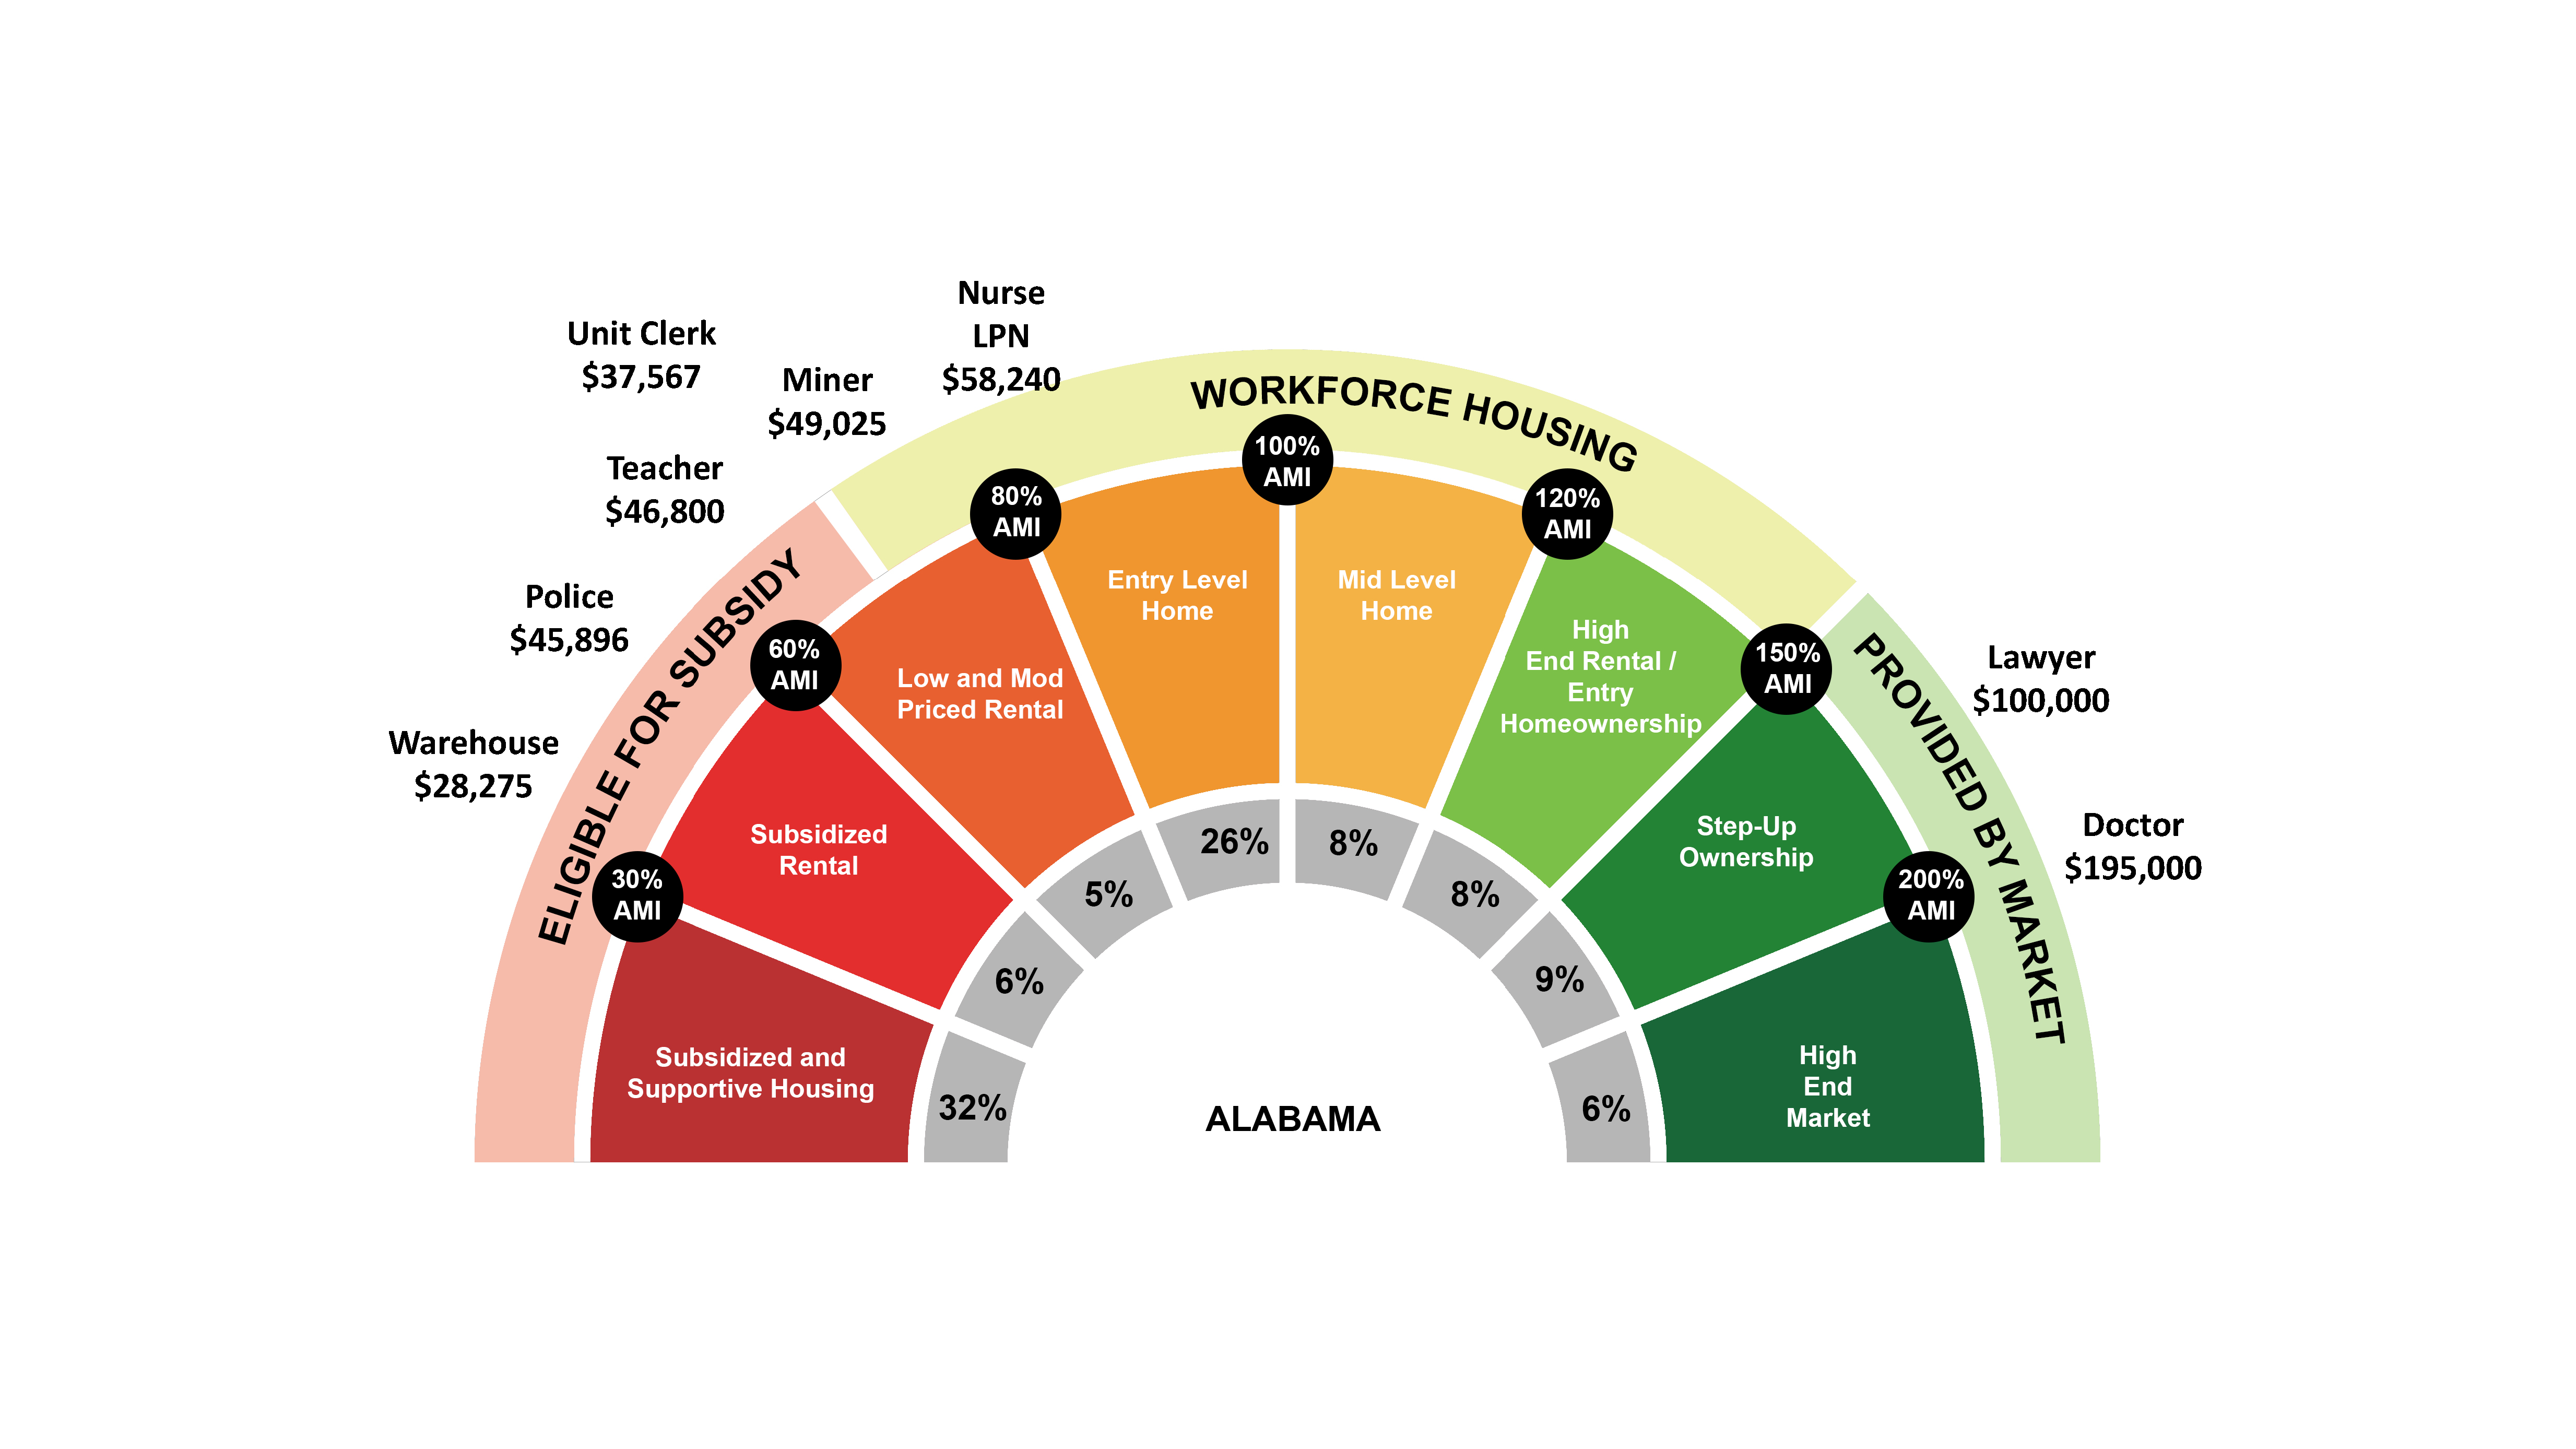
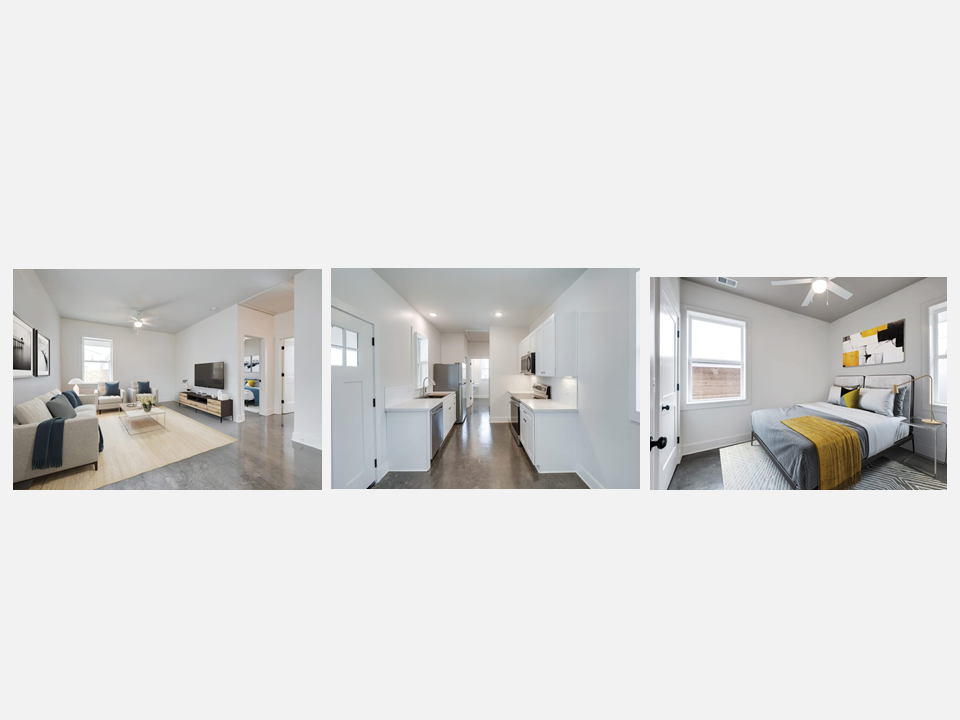
Housing inventory continues to fall, and prices continue to rise. Pressures on the housing market ripple across the economy but may have the most significant impact on middle-income workers – those earning between 80% and 120% of the median income. As housing prices increase, middle-income workers often struggle to live where they work. The shortage of affordable housing complicates hiring and threatens our economic health and community vitality.
For example, while median income in Alabama is $60,000. The median home sale price in January was $263,000, one of the largest gaps in our history. Likewise, the Alabama median income supports rent of $1,240, but average rent for a three-bedroom apartment in Alabama is $1,500.
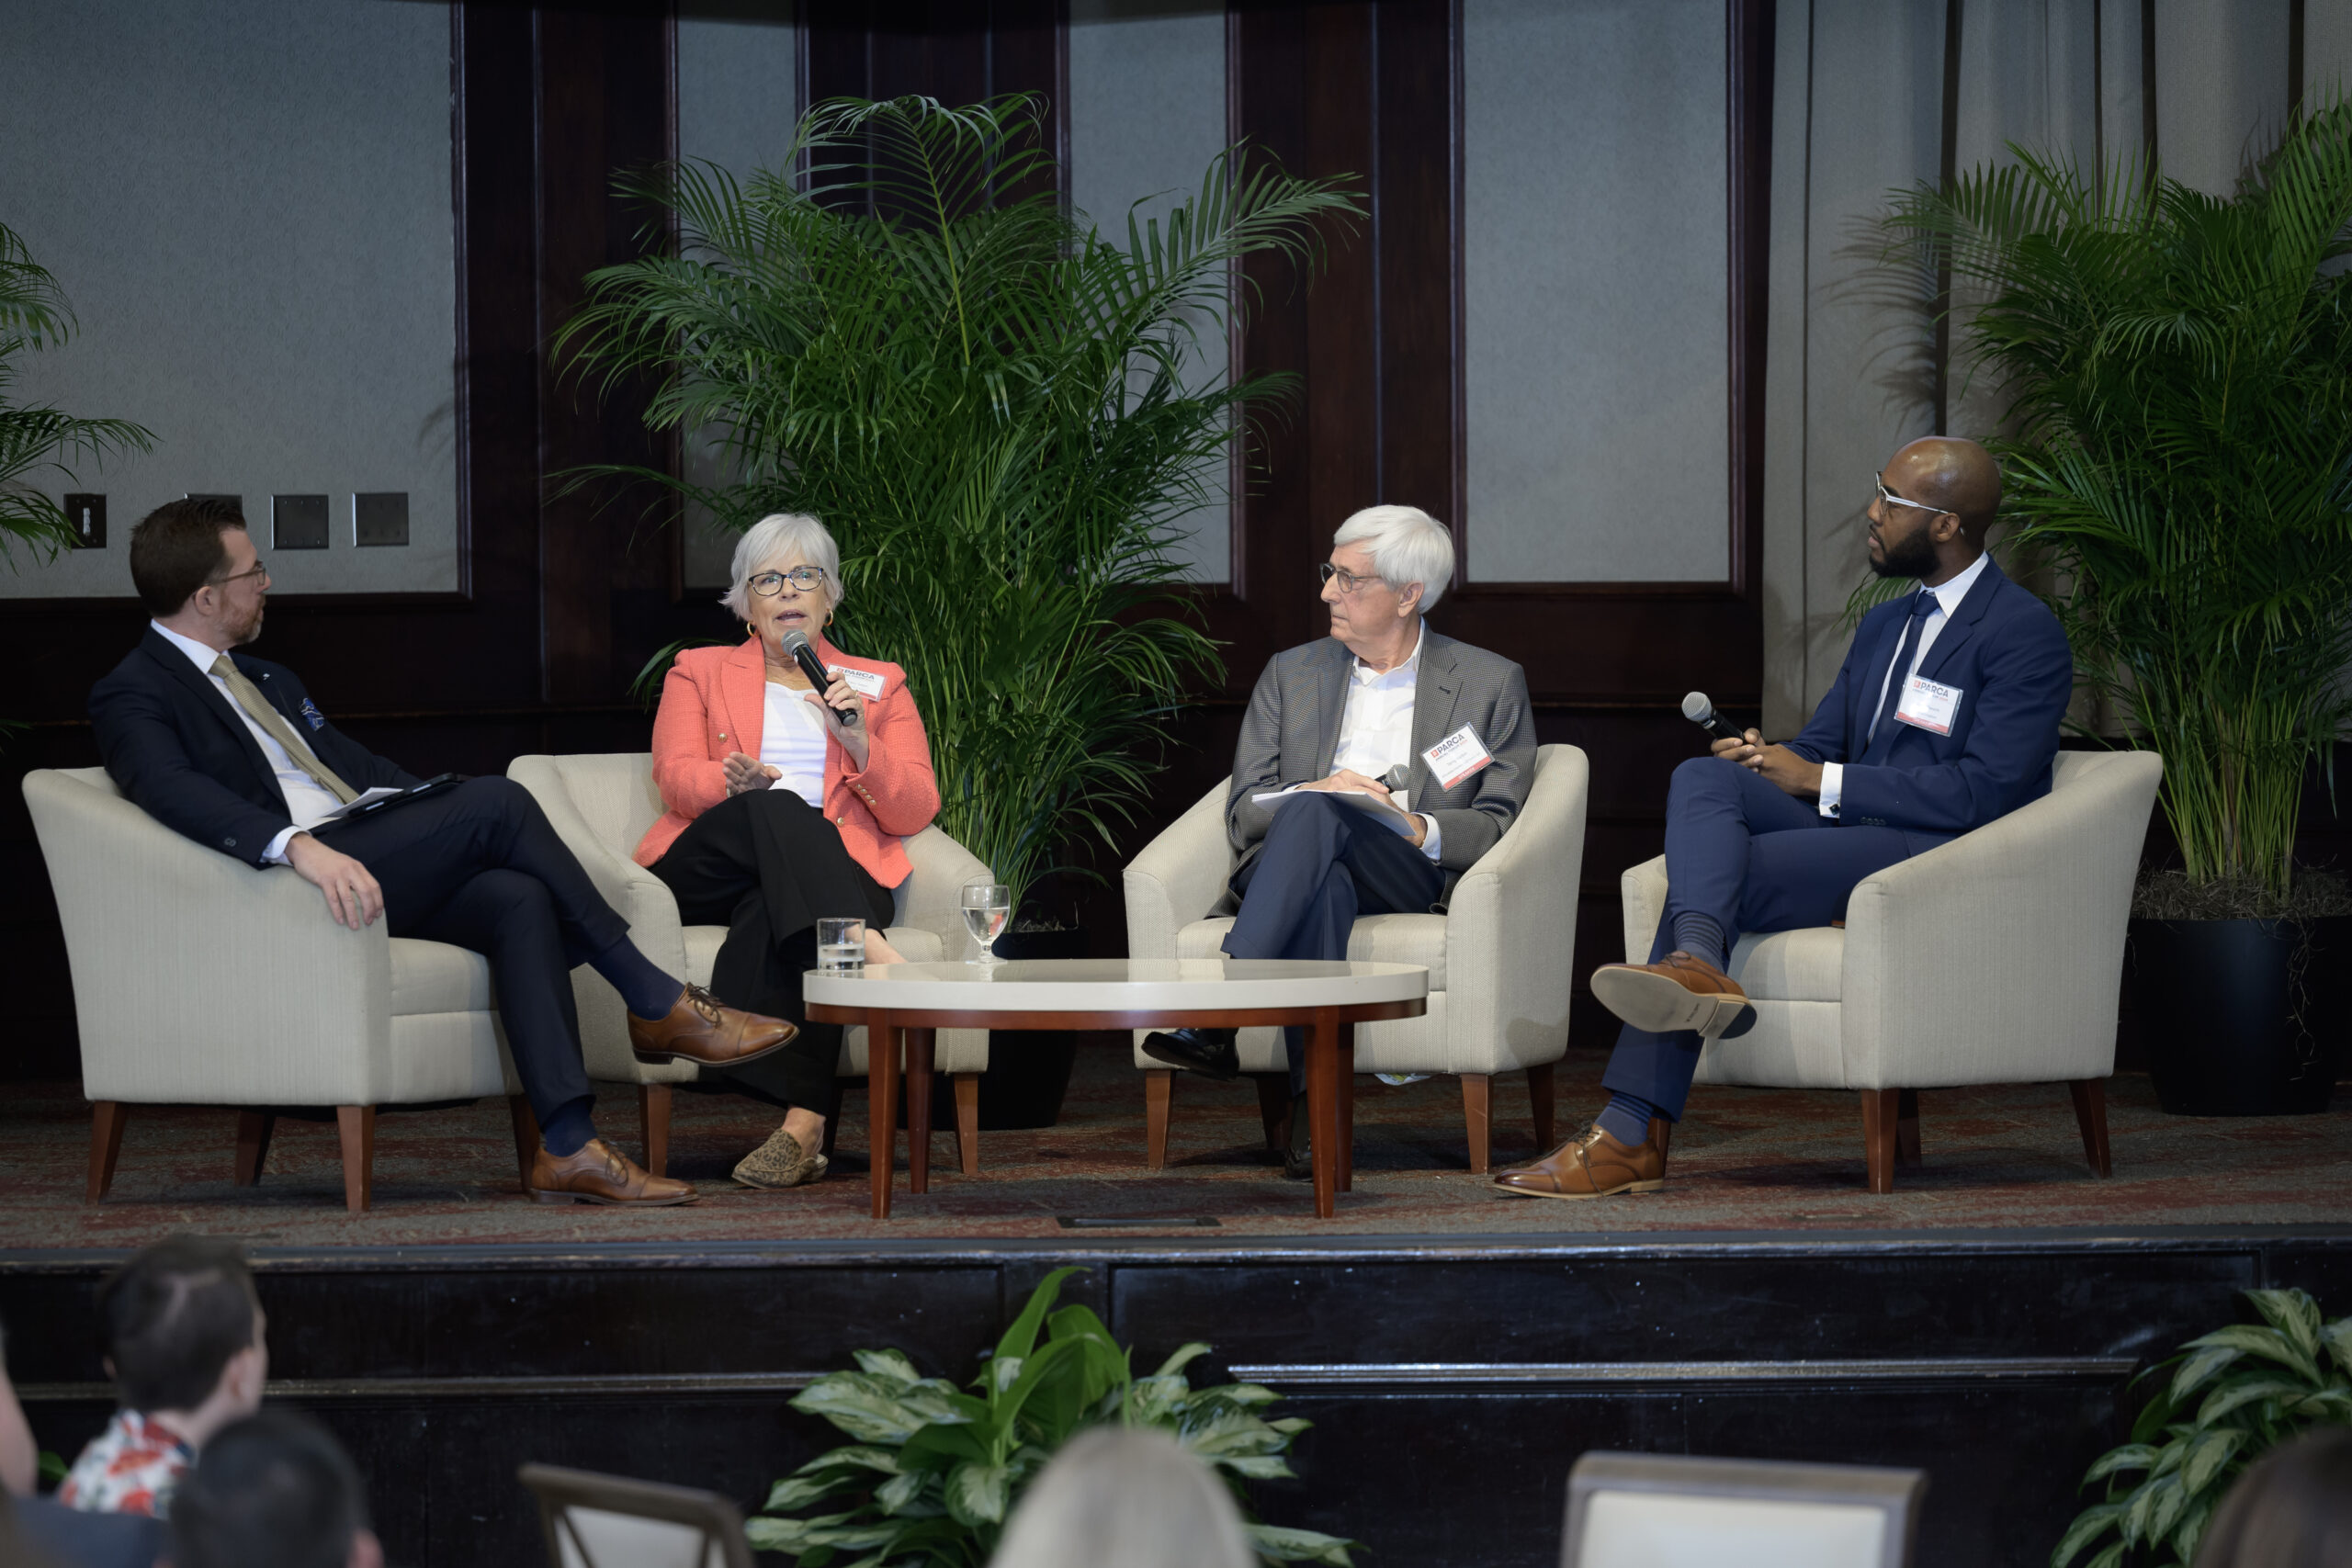
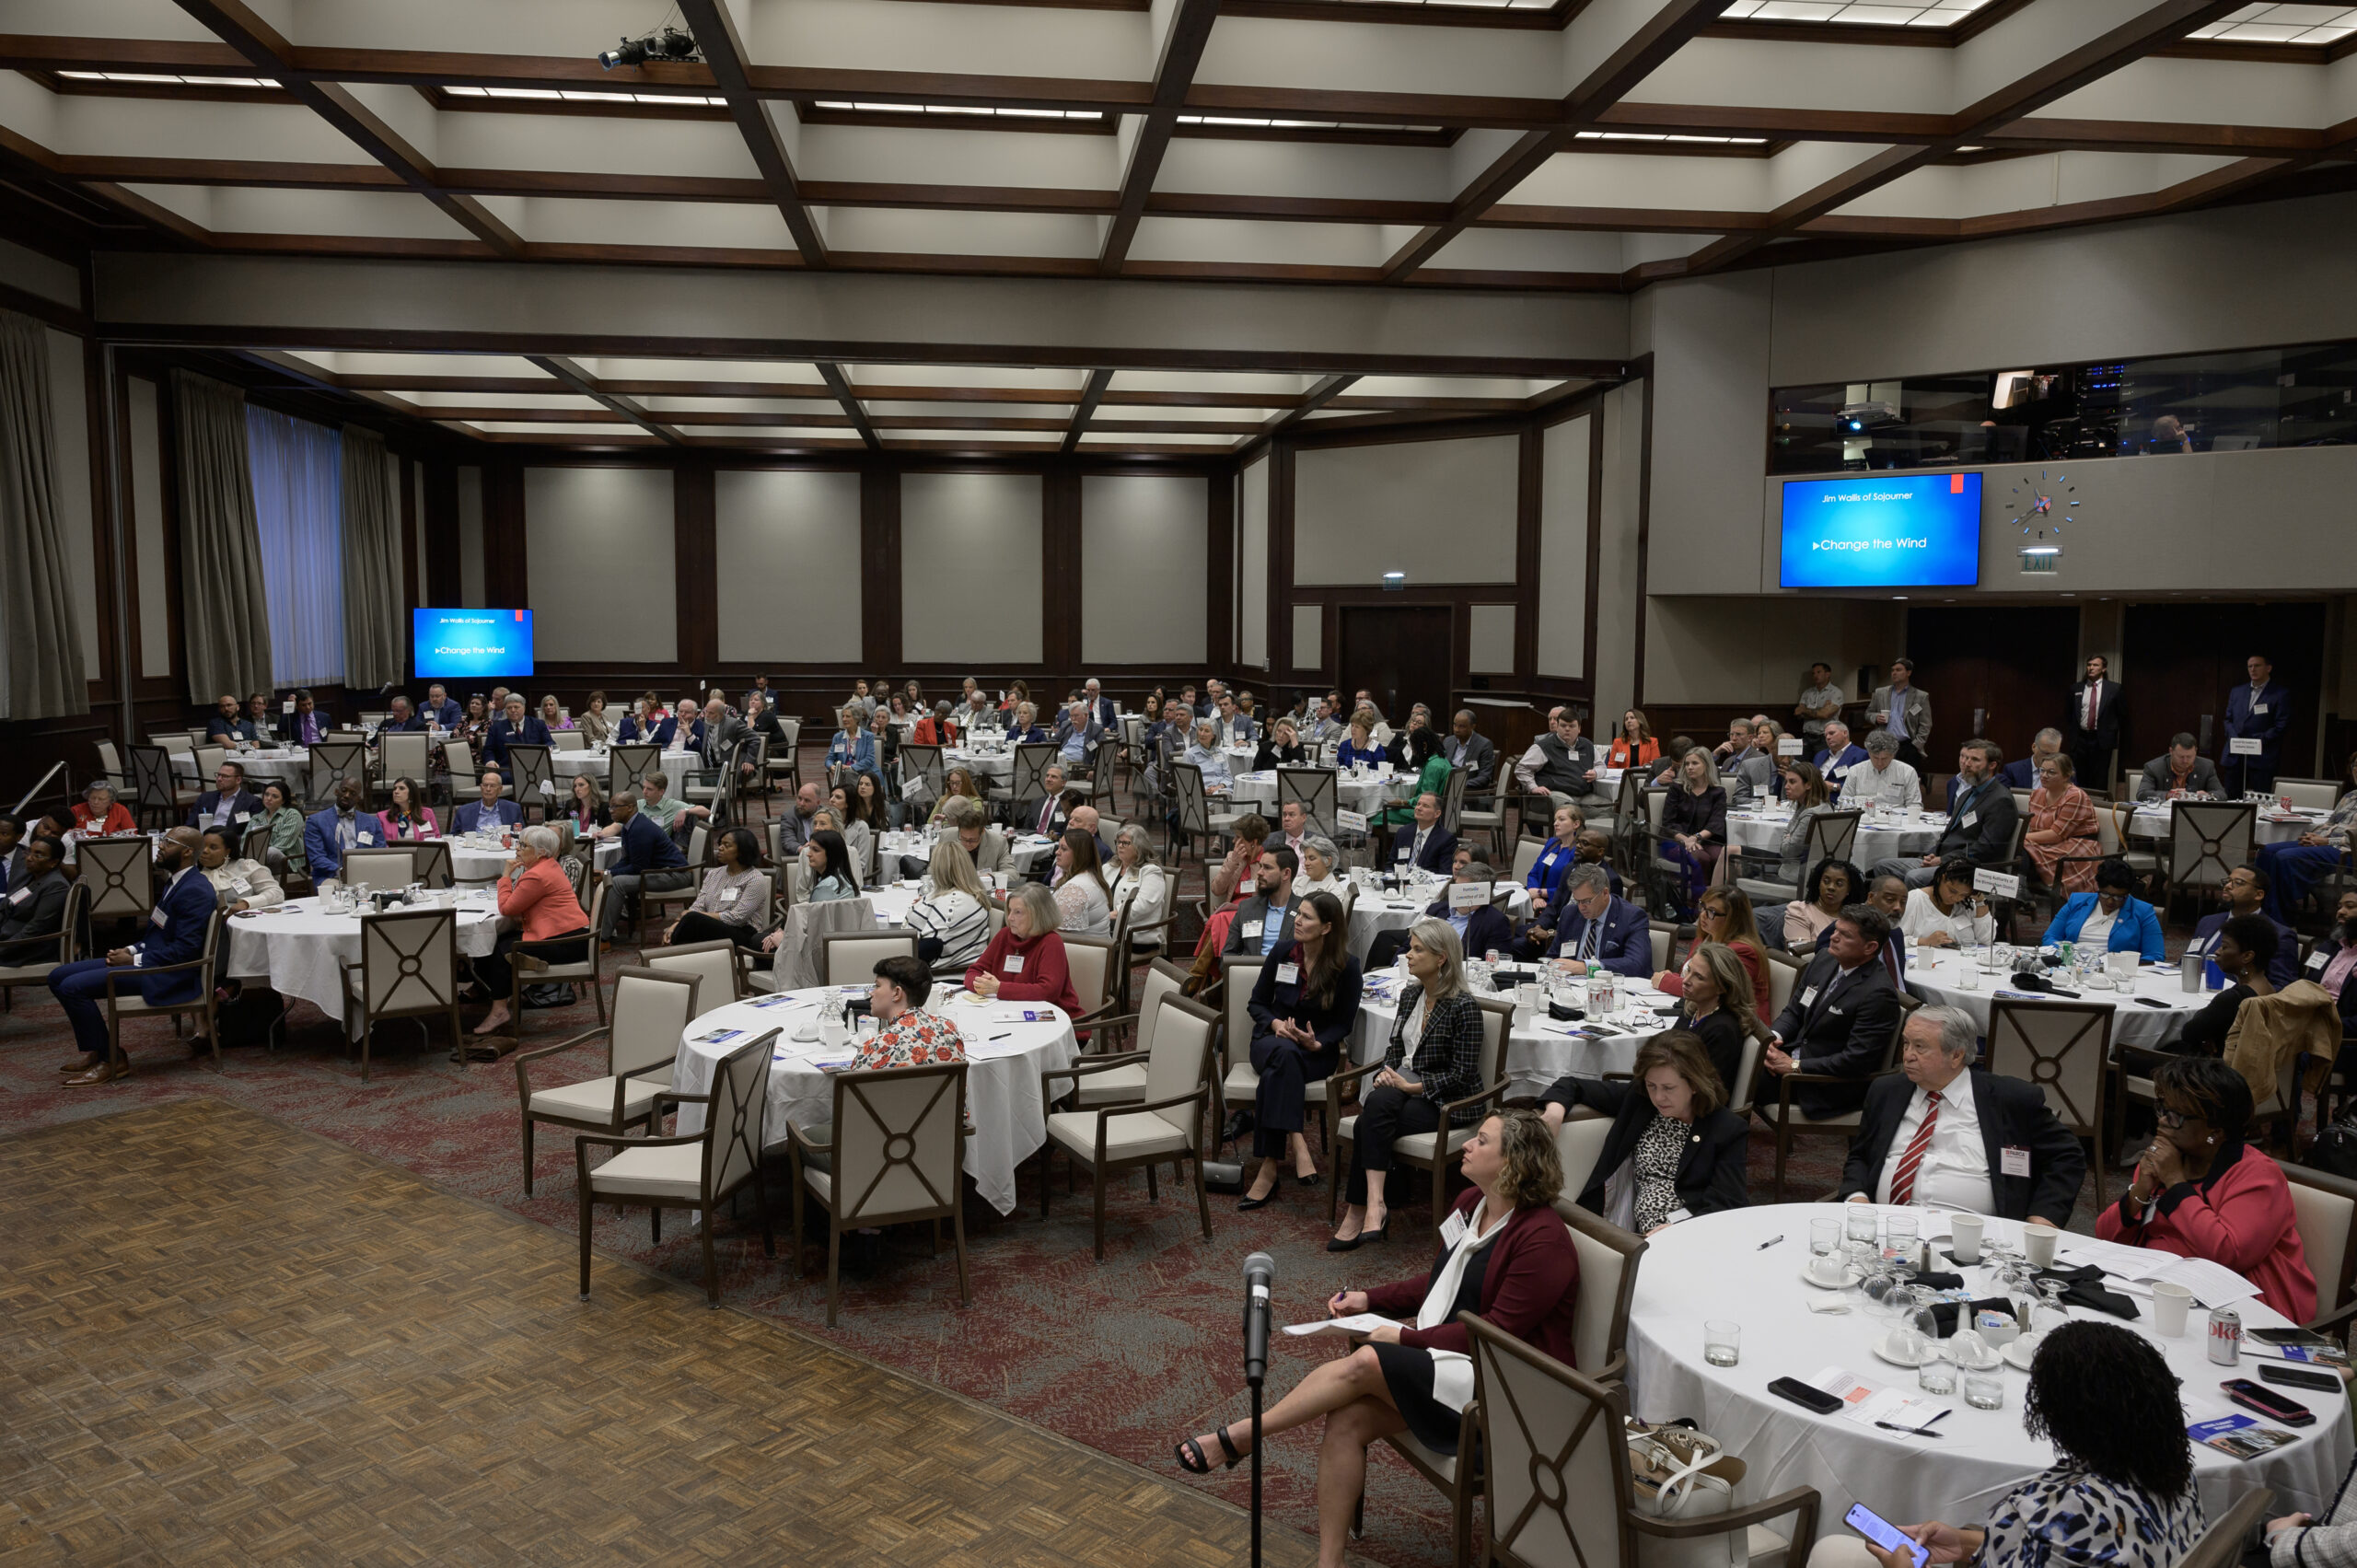
These challenges were the focus of PARCA’s 2024 Annual Forum: Housing Alabama’s Workforce.
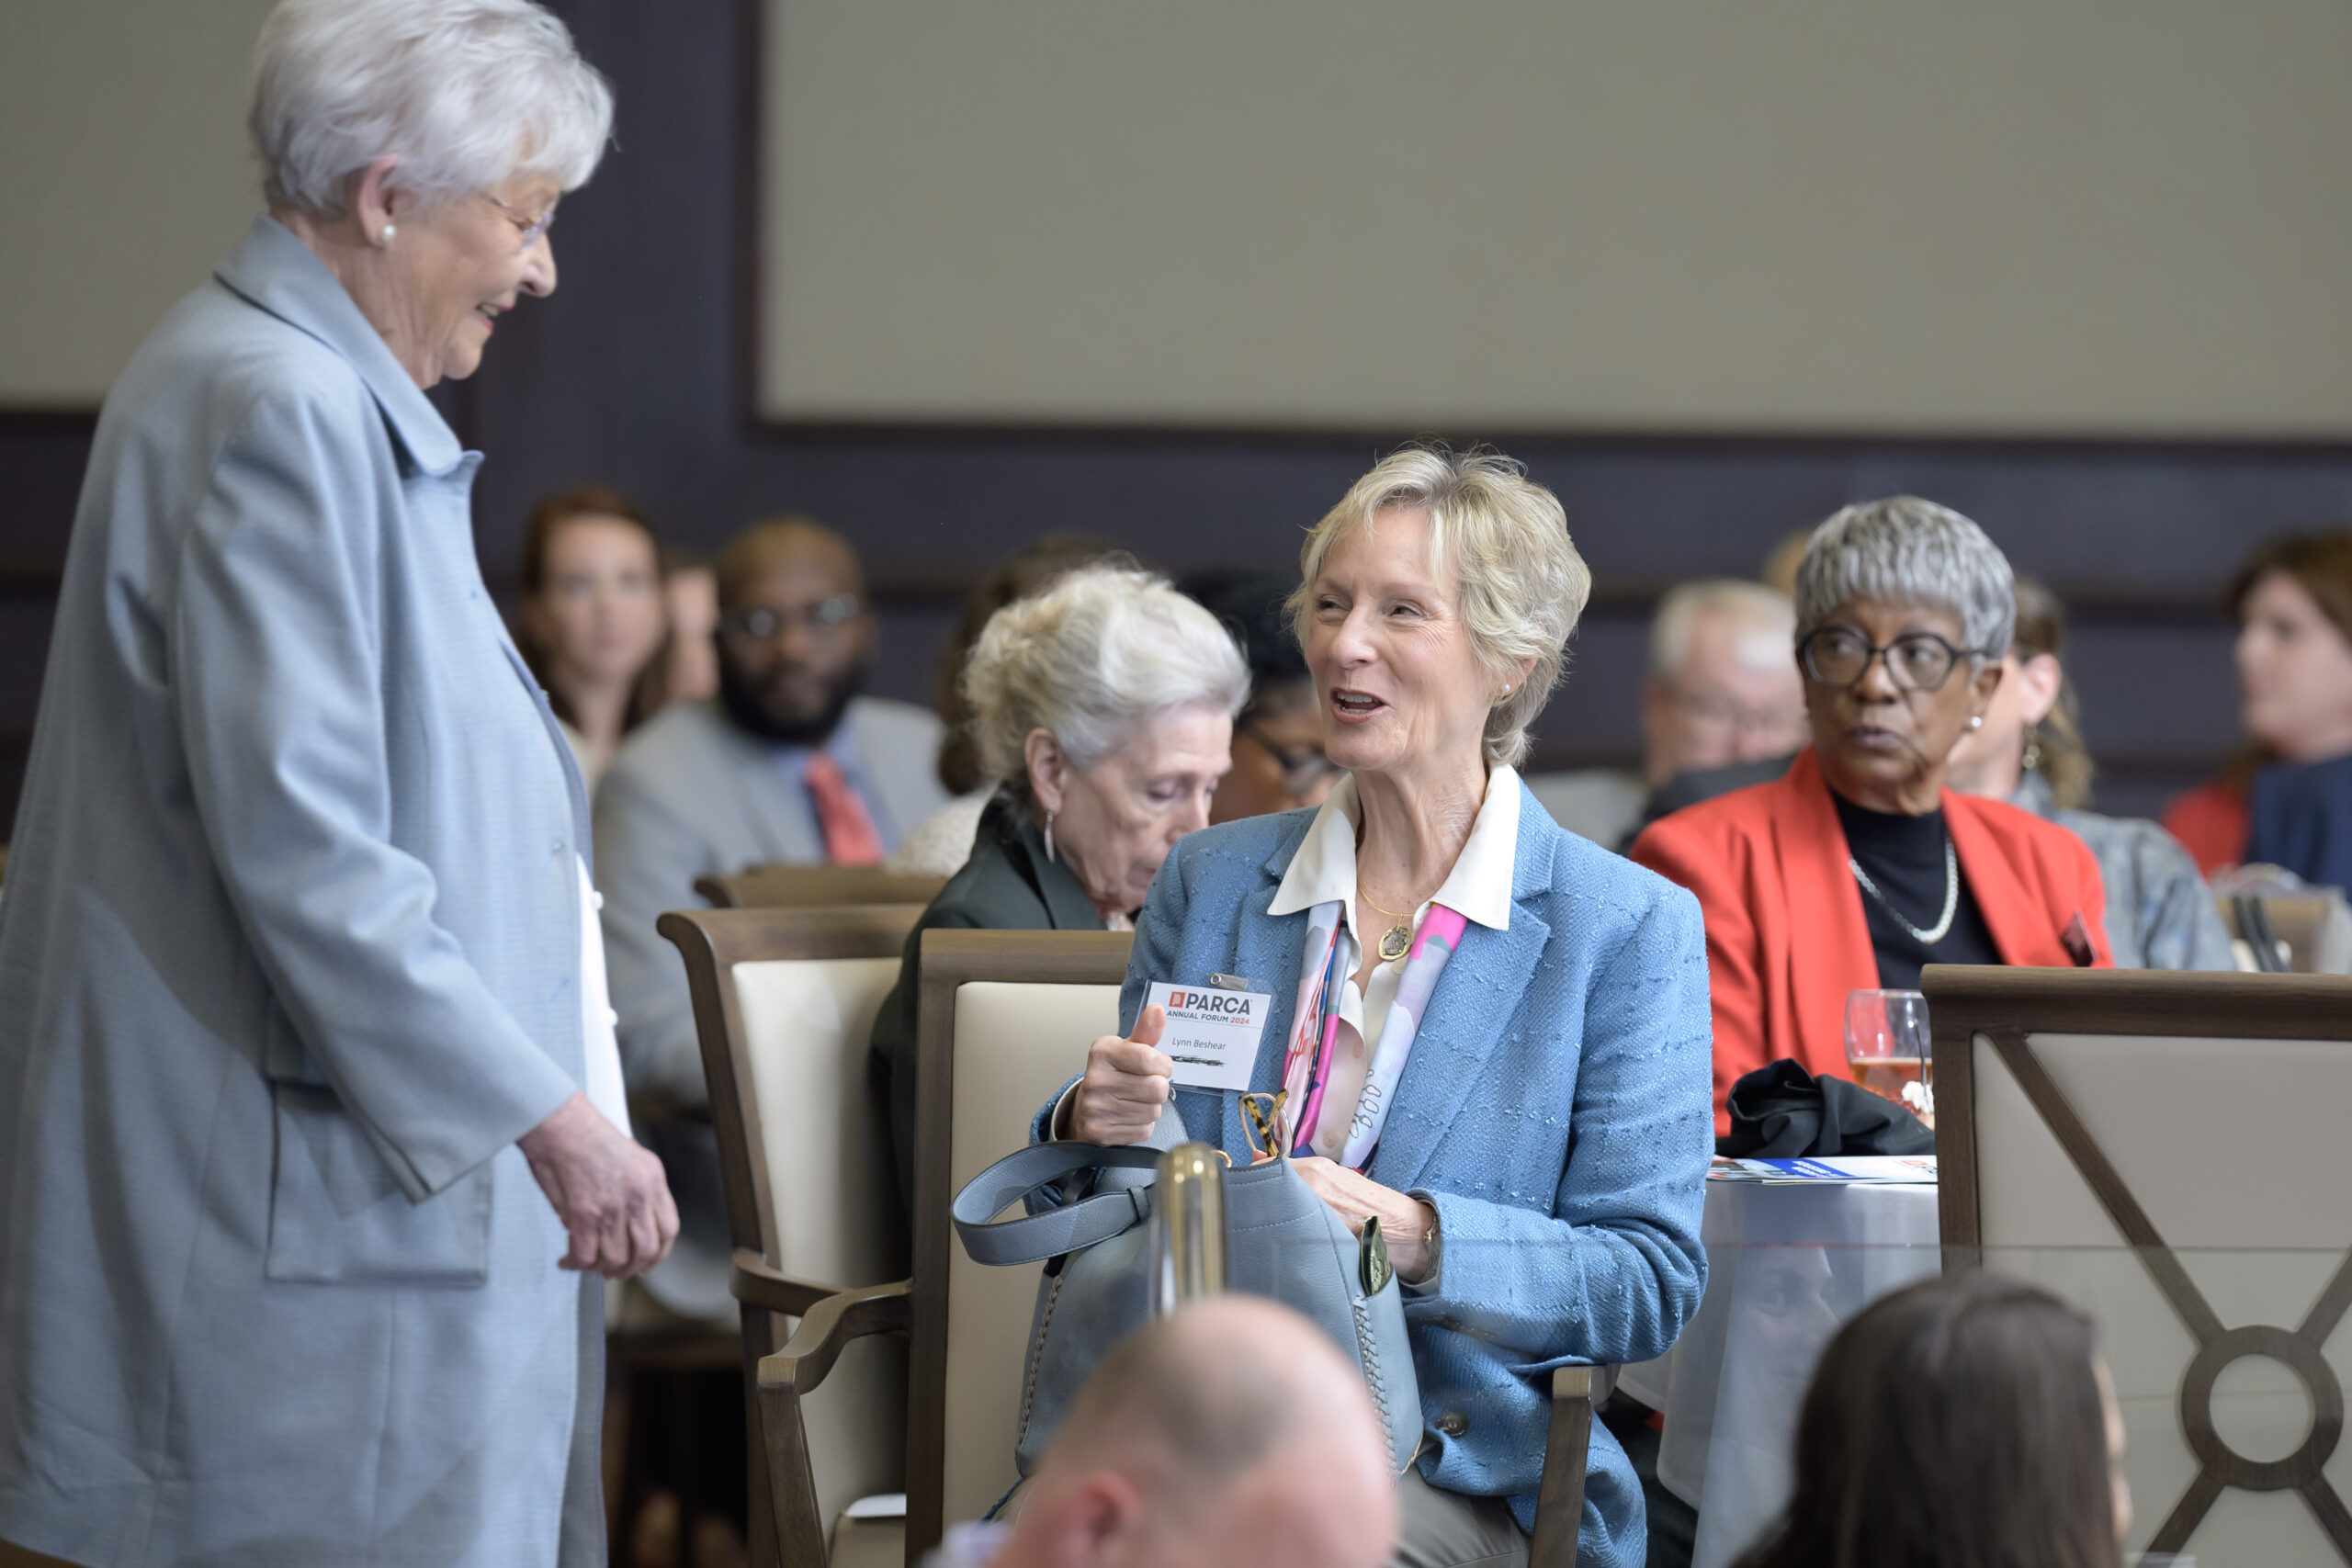
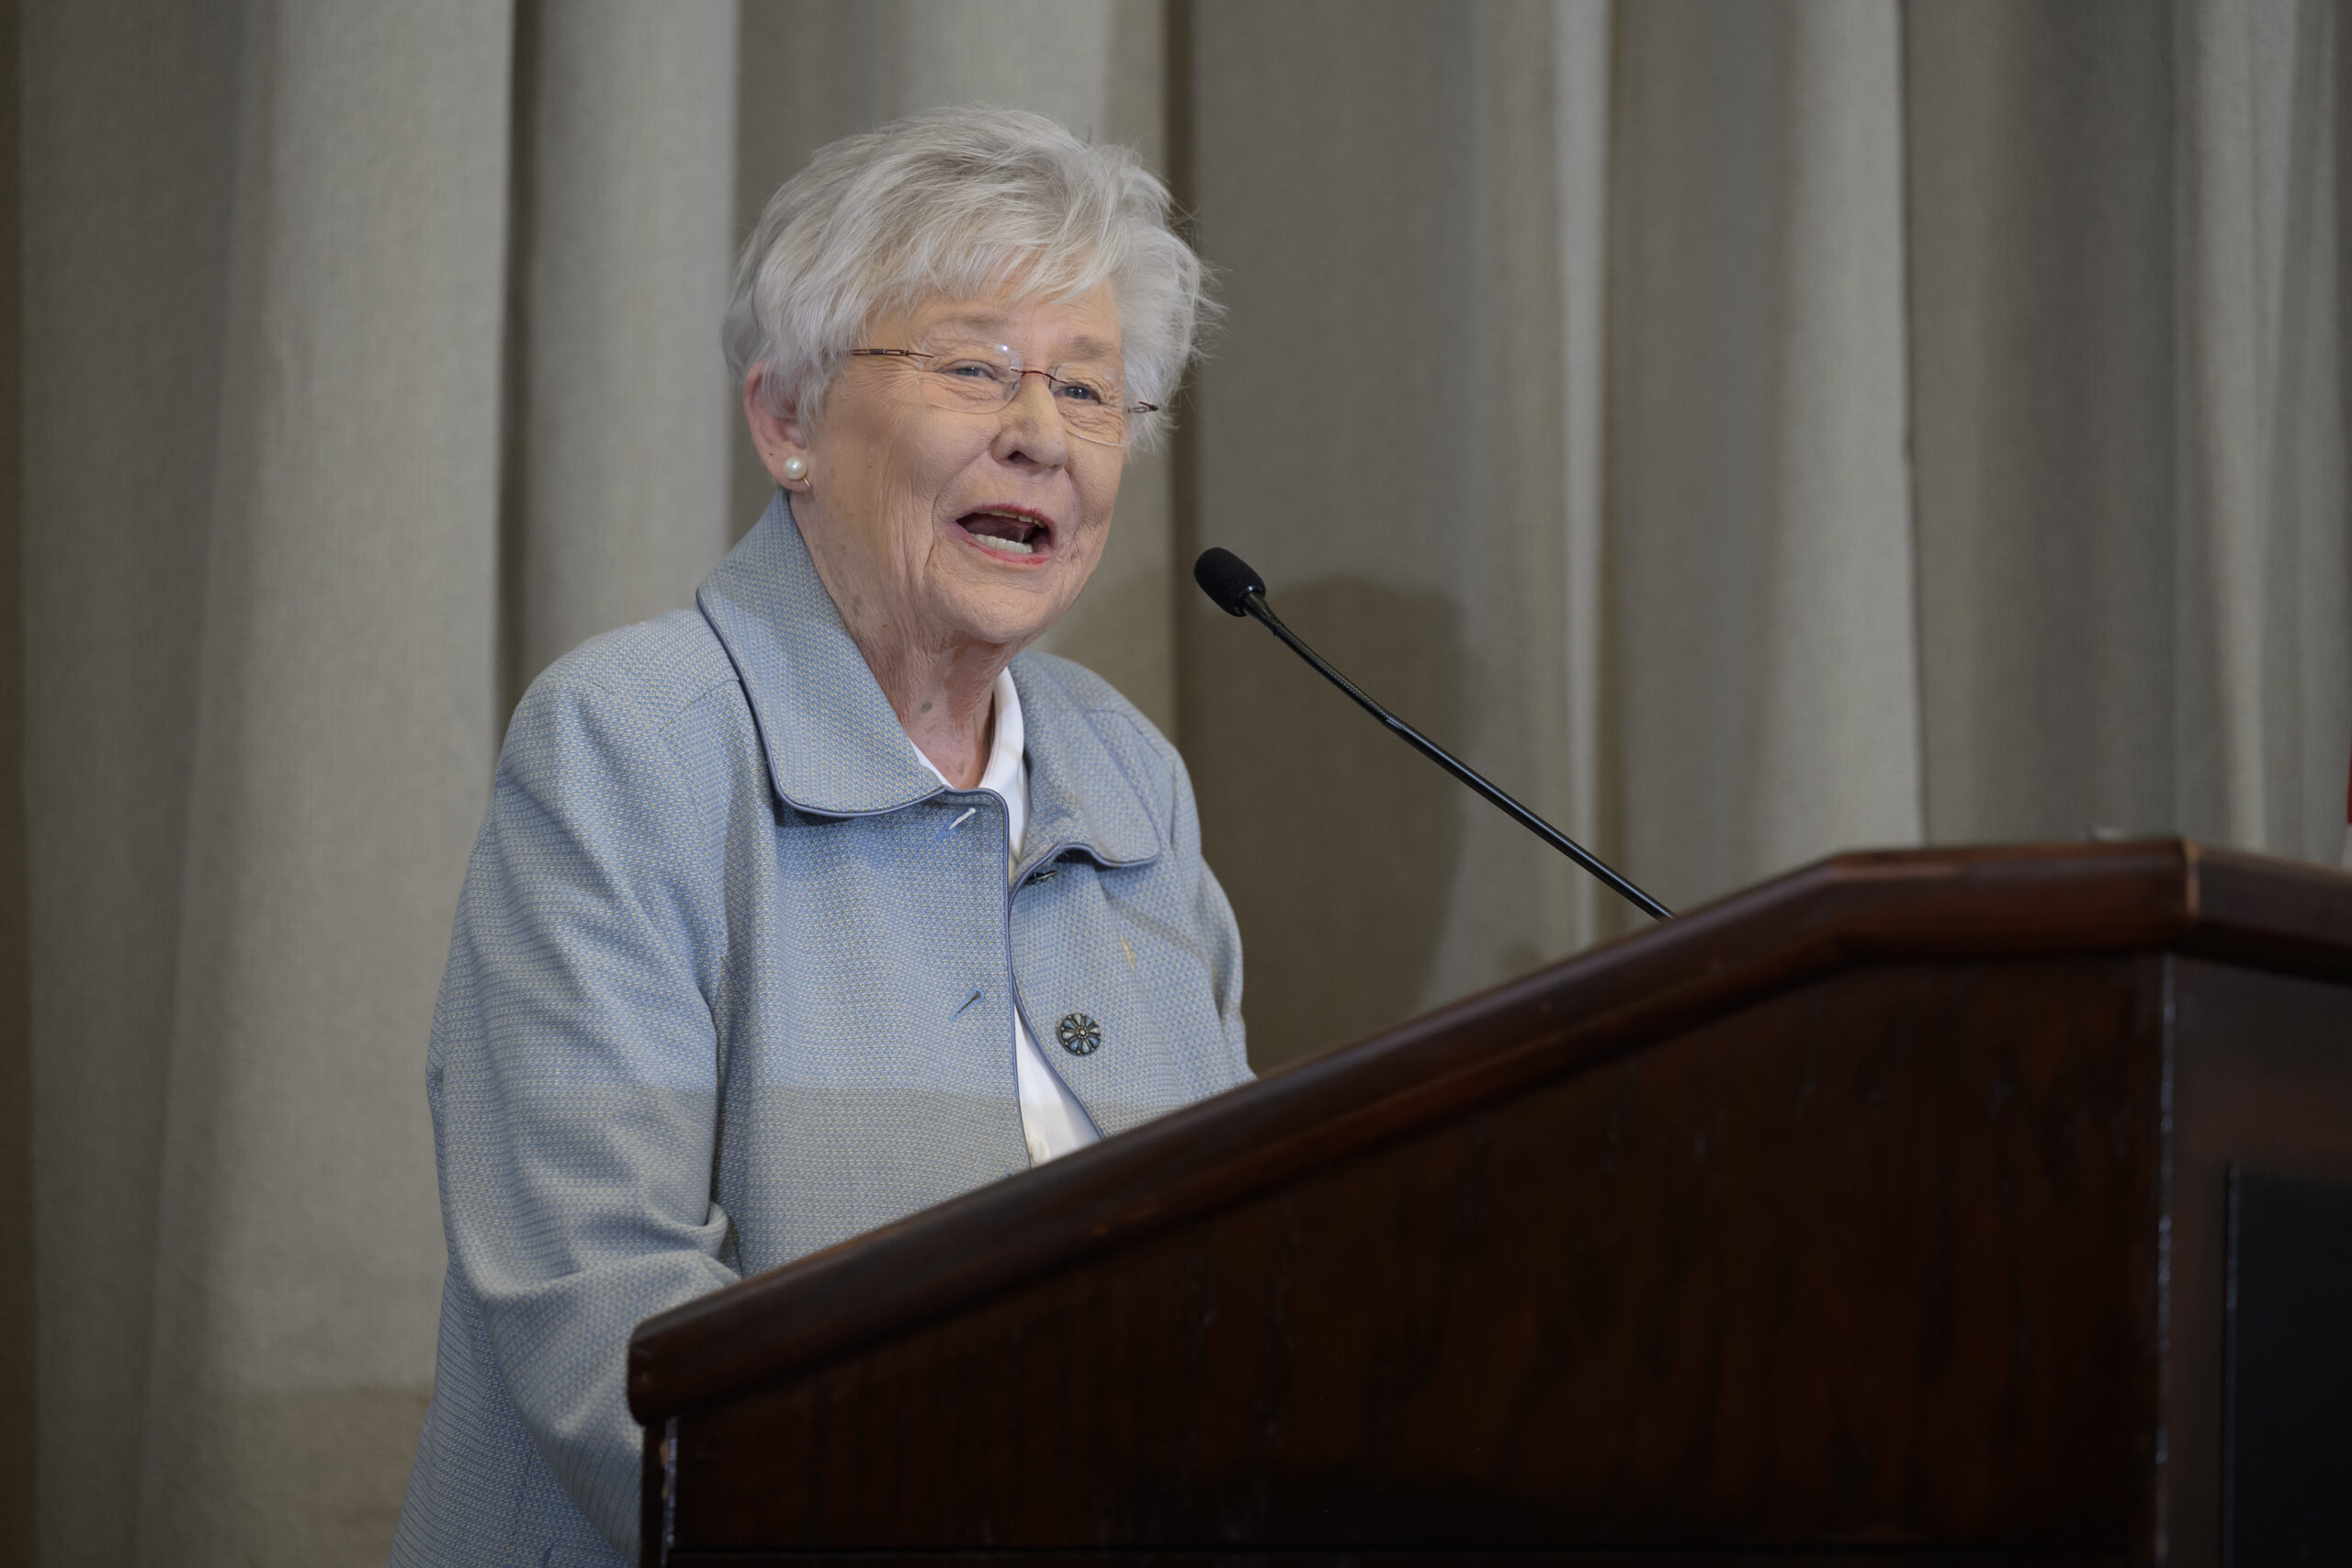
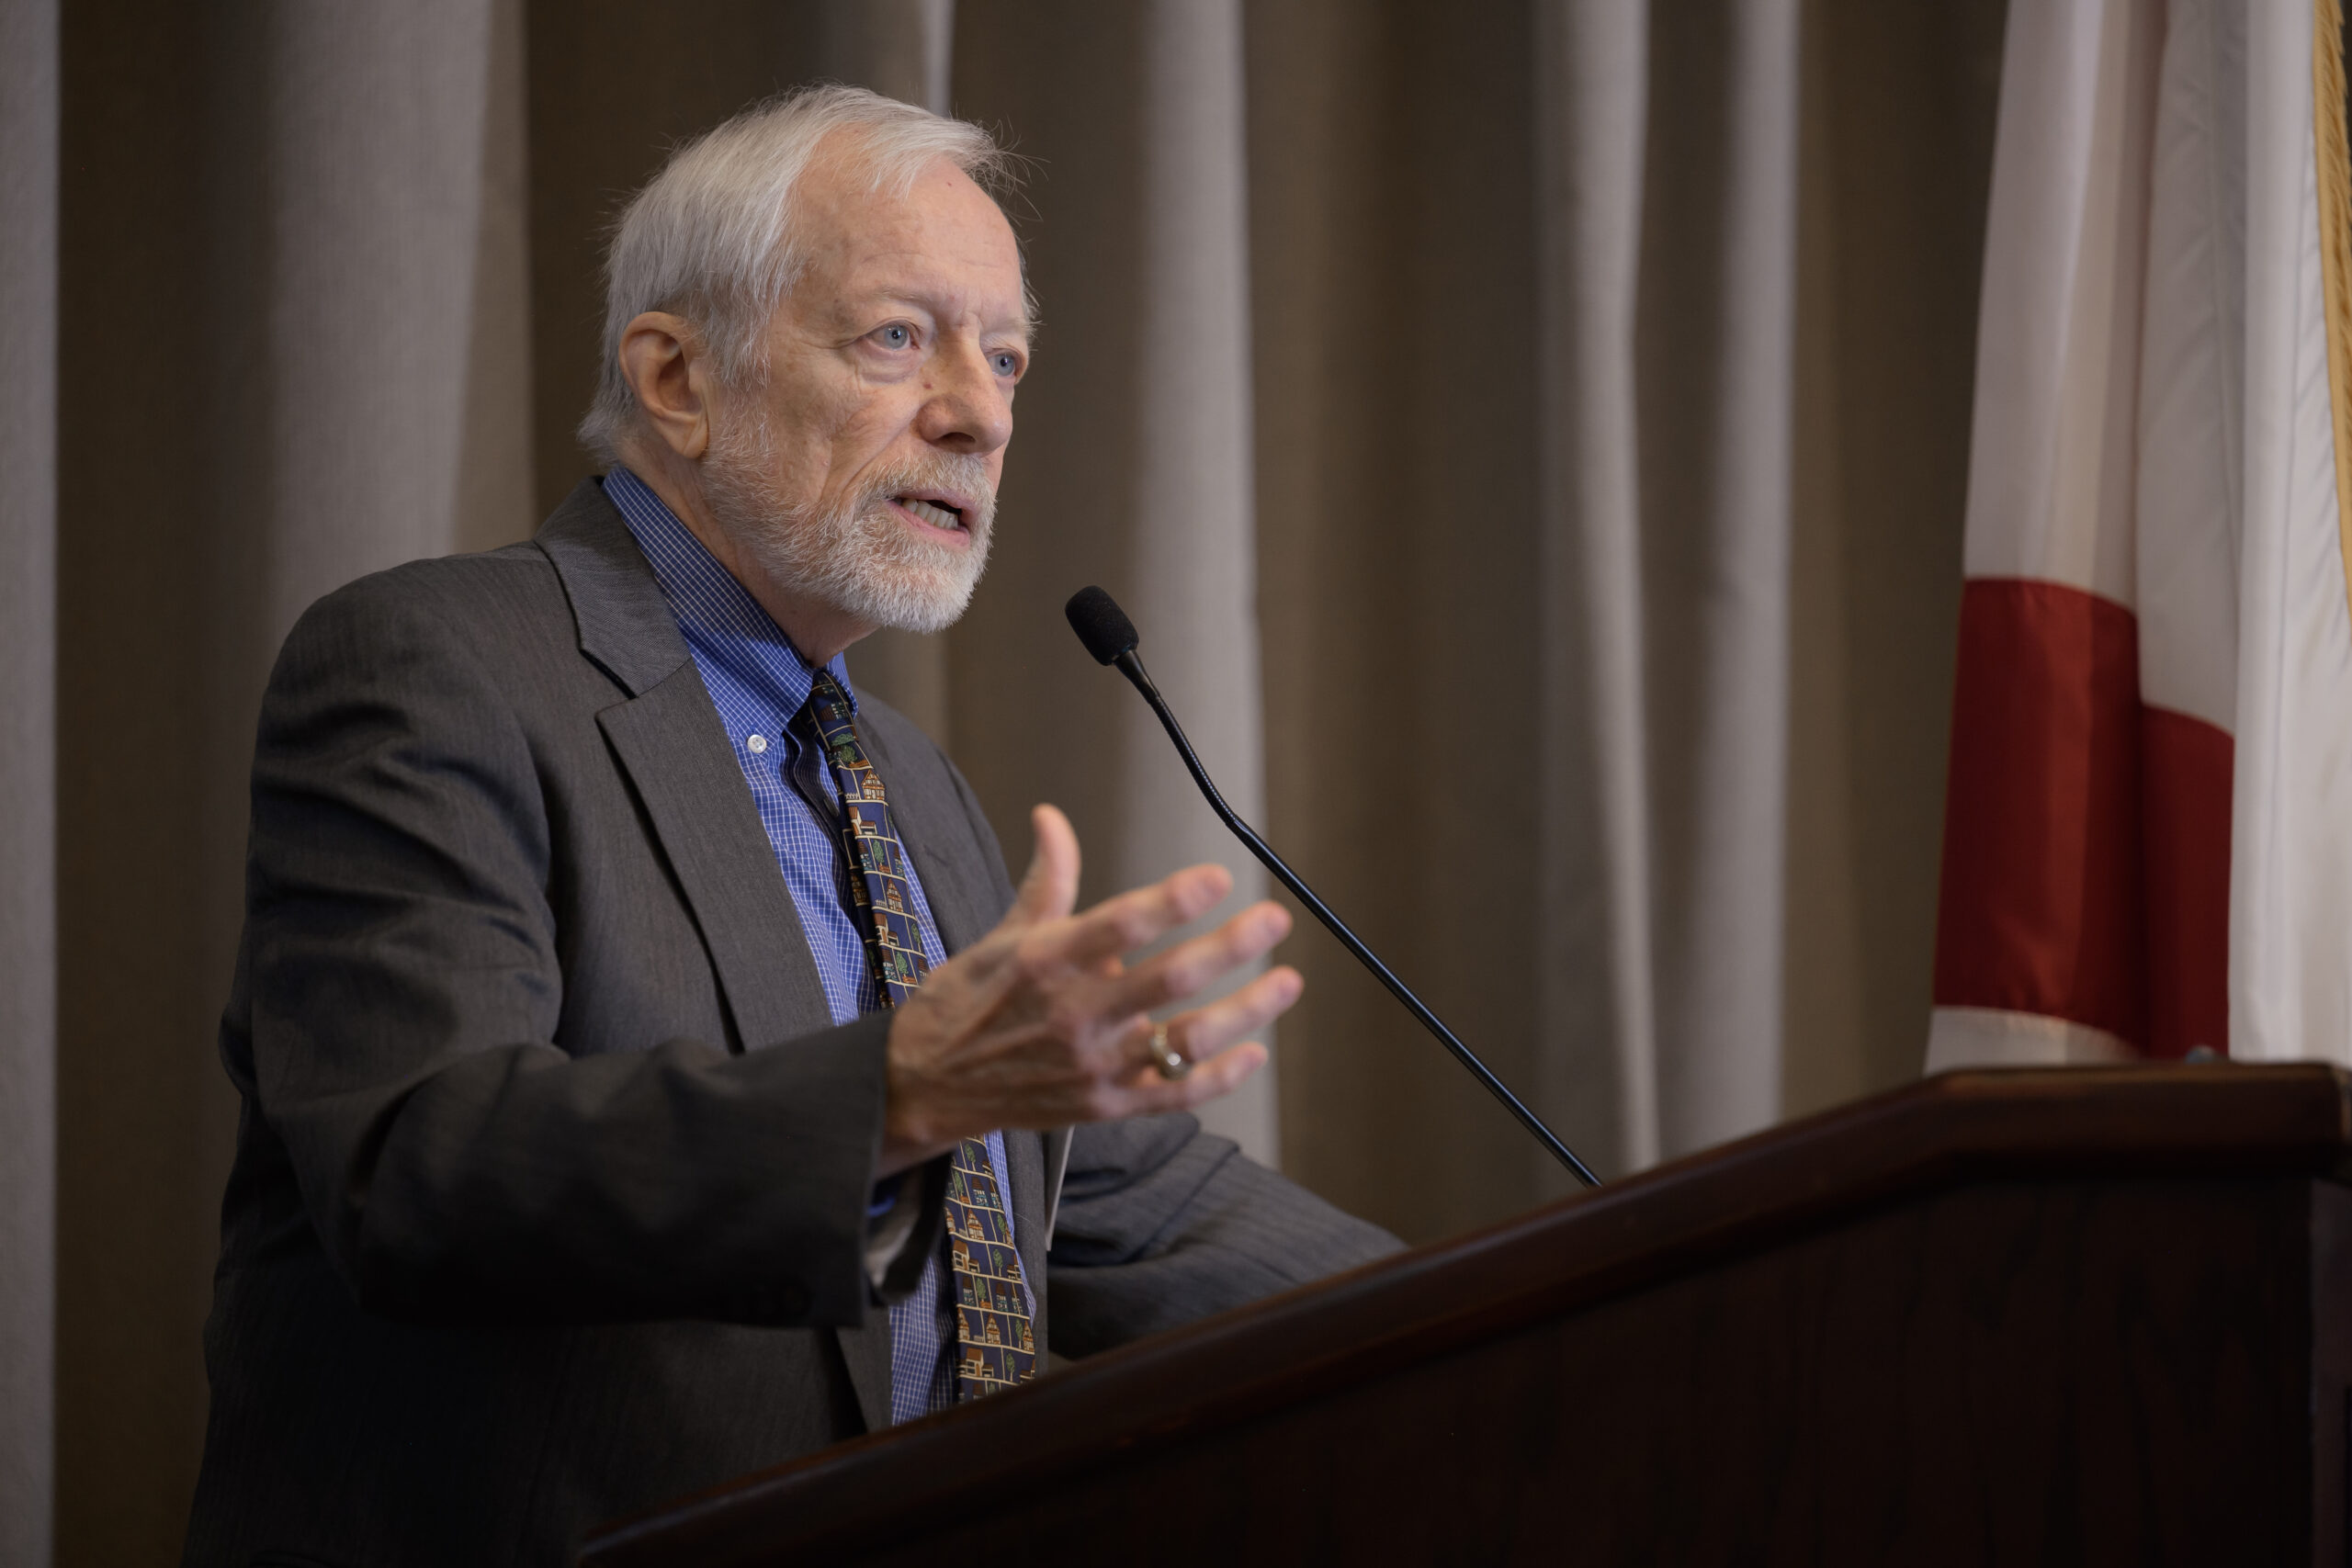
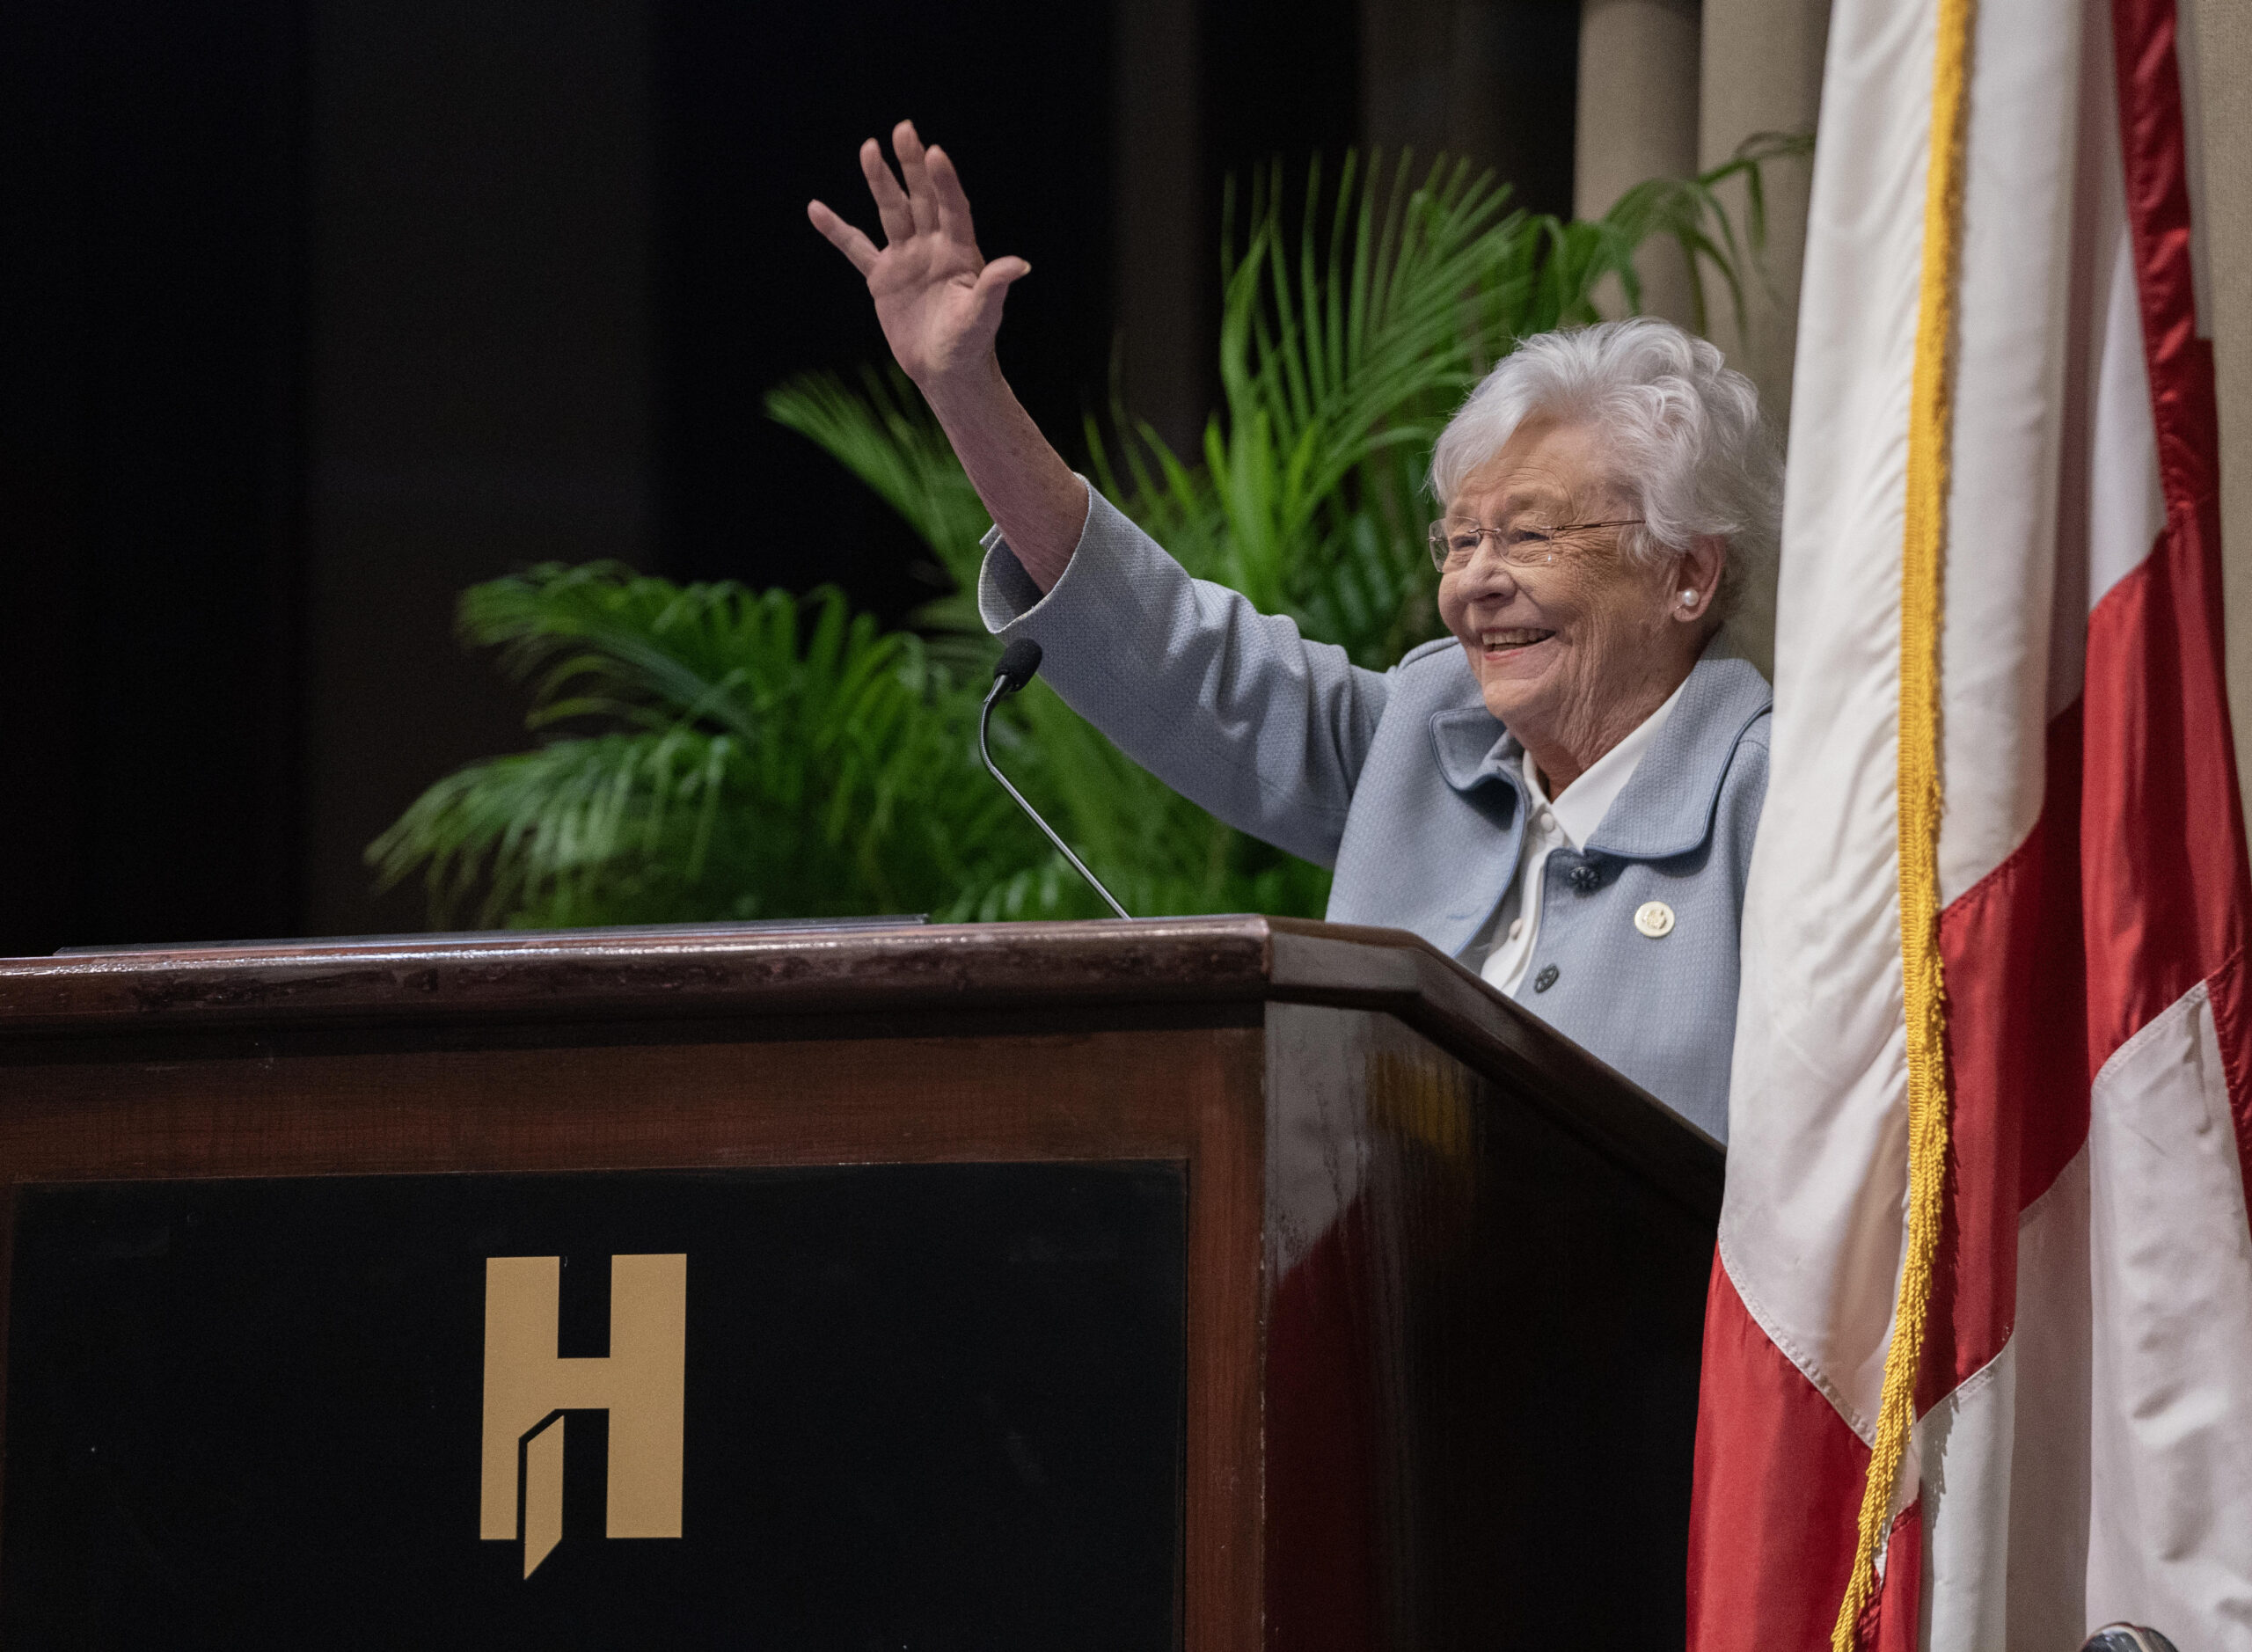
The March 7 event welcomed over 300 state and local leaders gathered at the Harbert Center on March 8 to consider these issues and hear an address from Governor Kay Ivey.
PARCA Annual Forum 2024PARCA Annual Forum 2024Governor Kay Ivey’s lunch addressPARCA Annual Forum 2024
The speakers explored the housing challenges facing the state’s middle-income workers—those vital to the economy and well-functioning communities, such as teachers, nurses, and first responders.
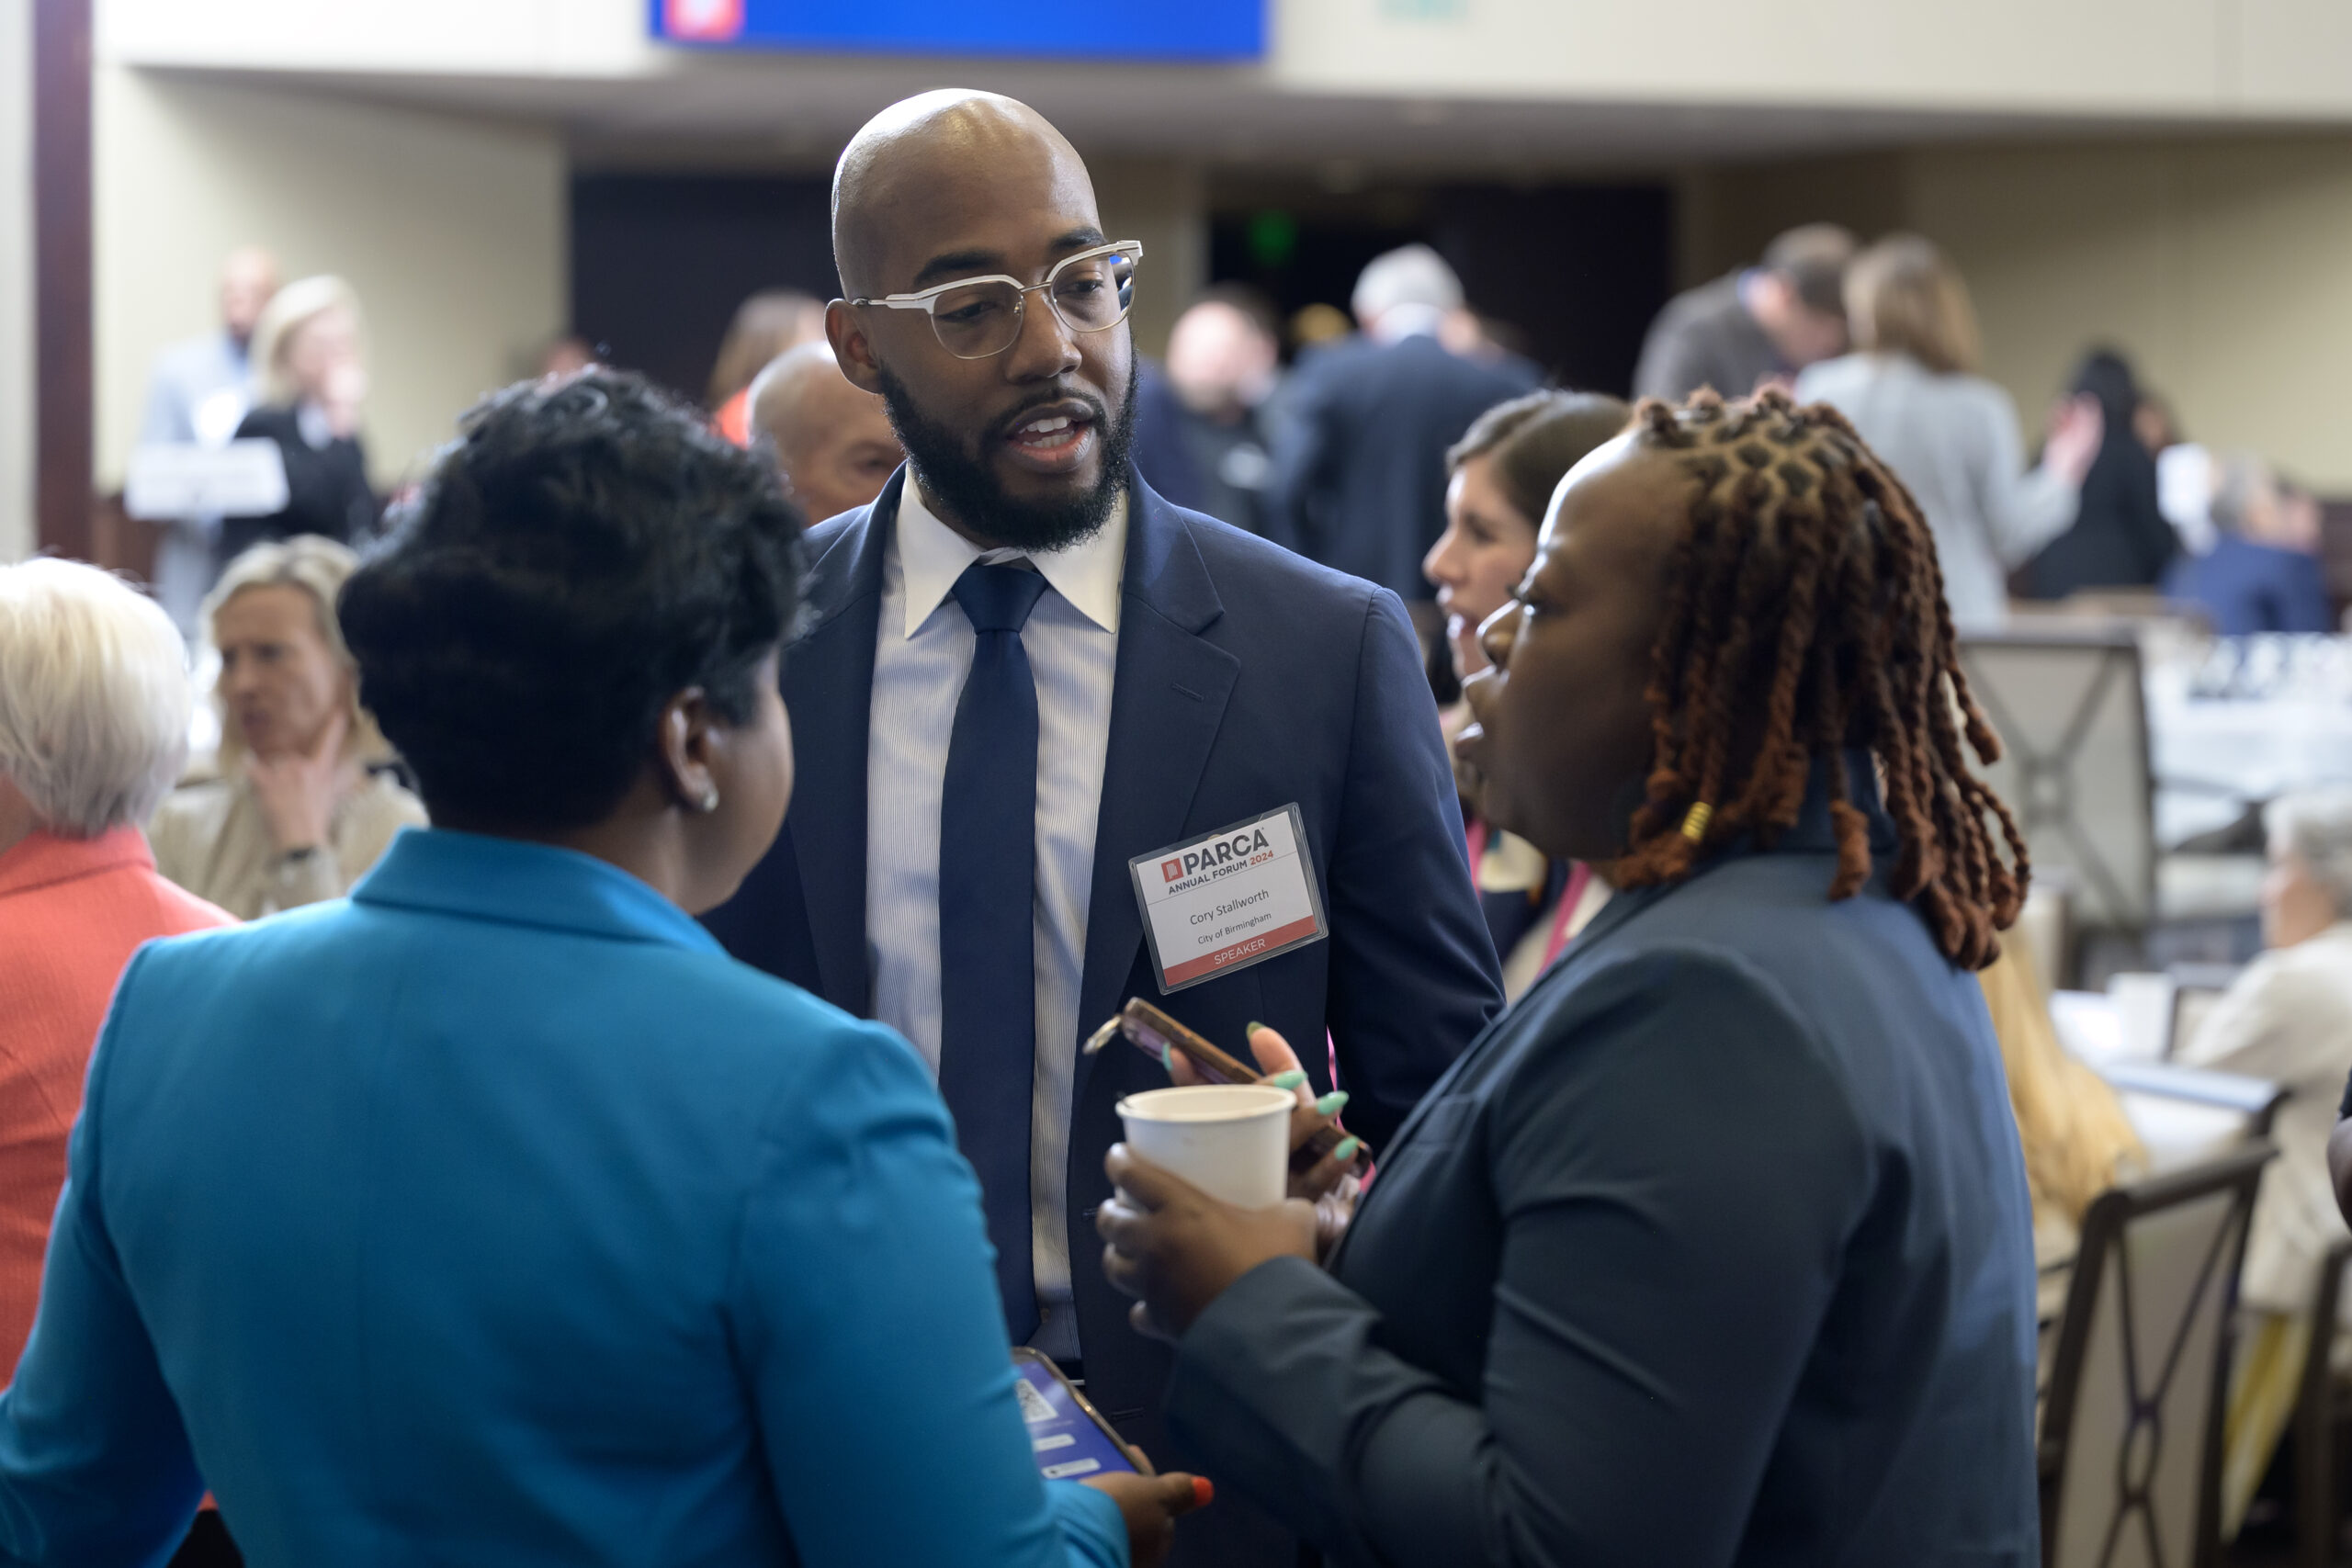
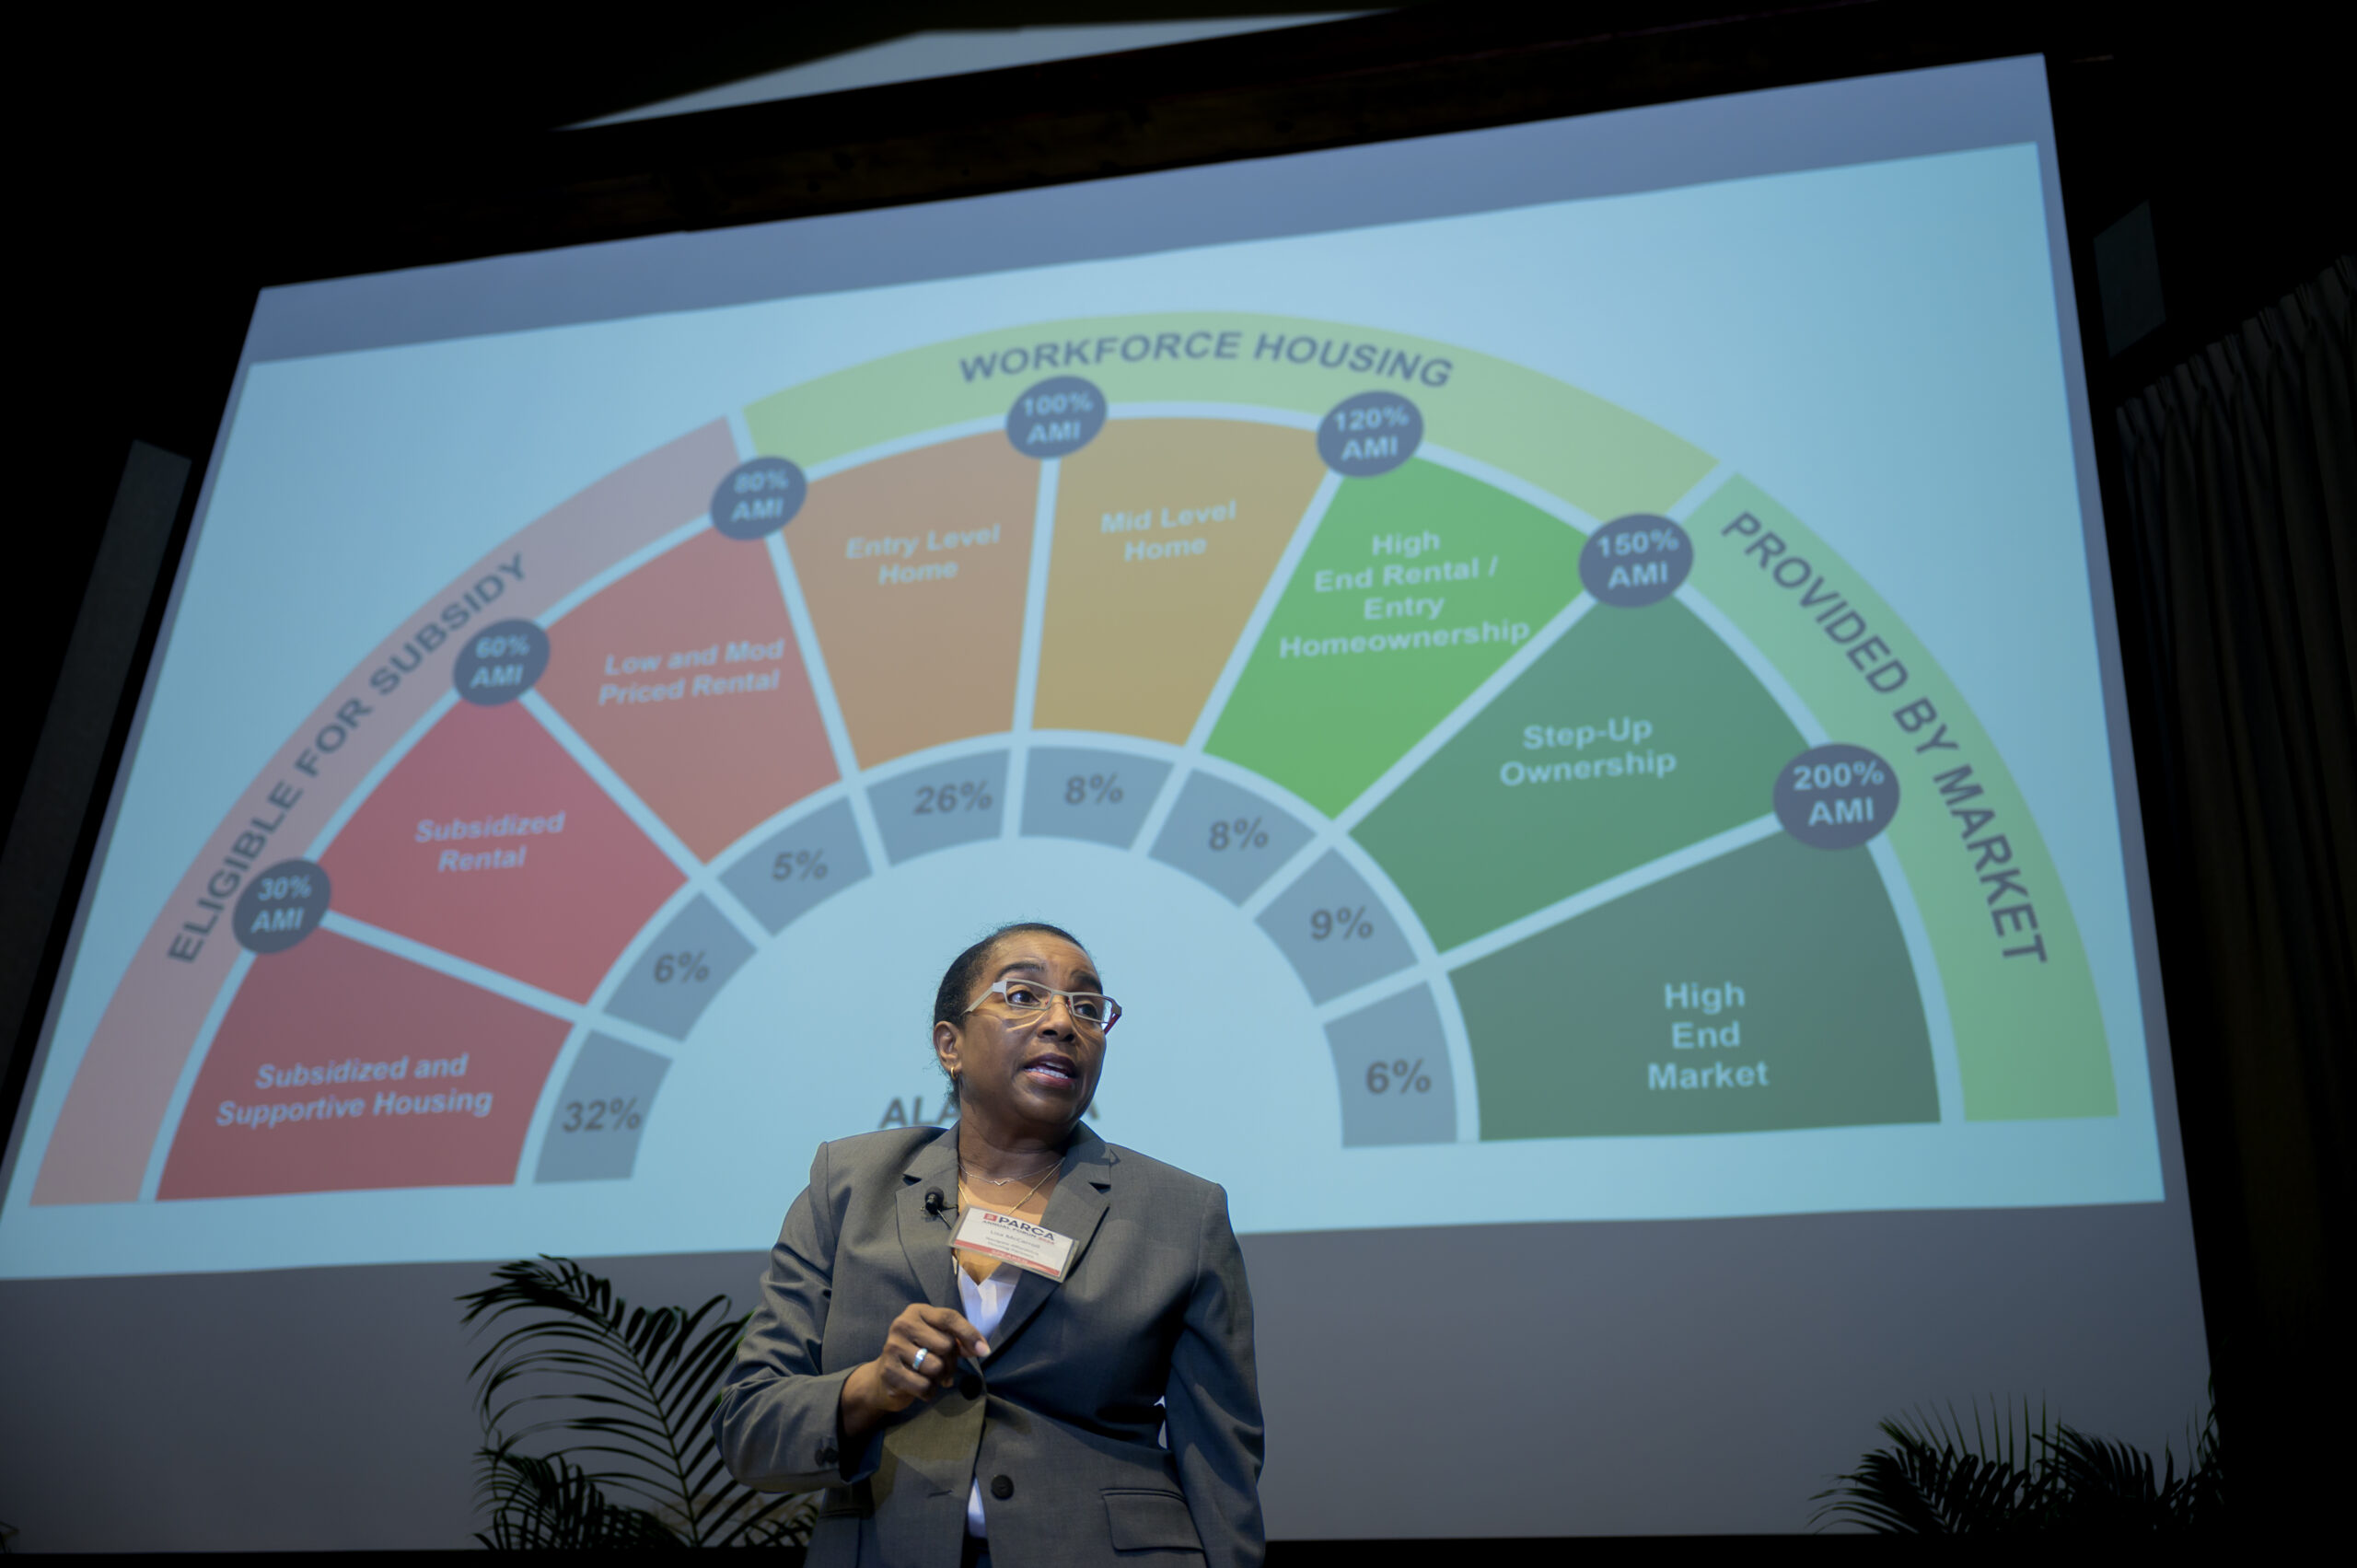
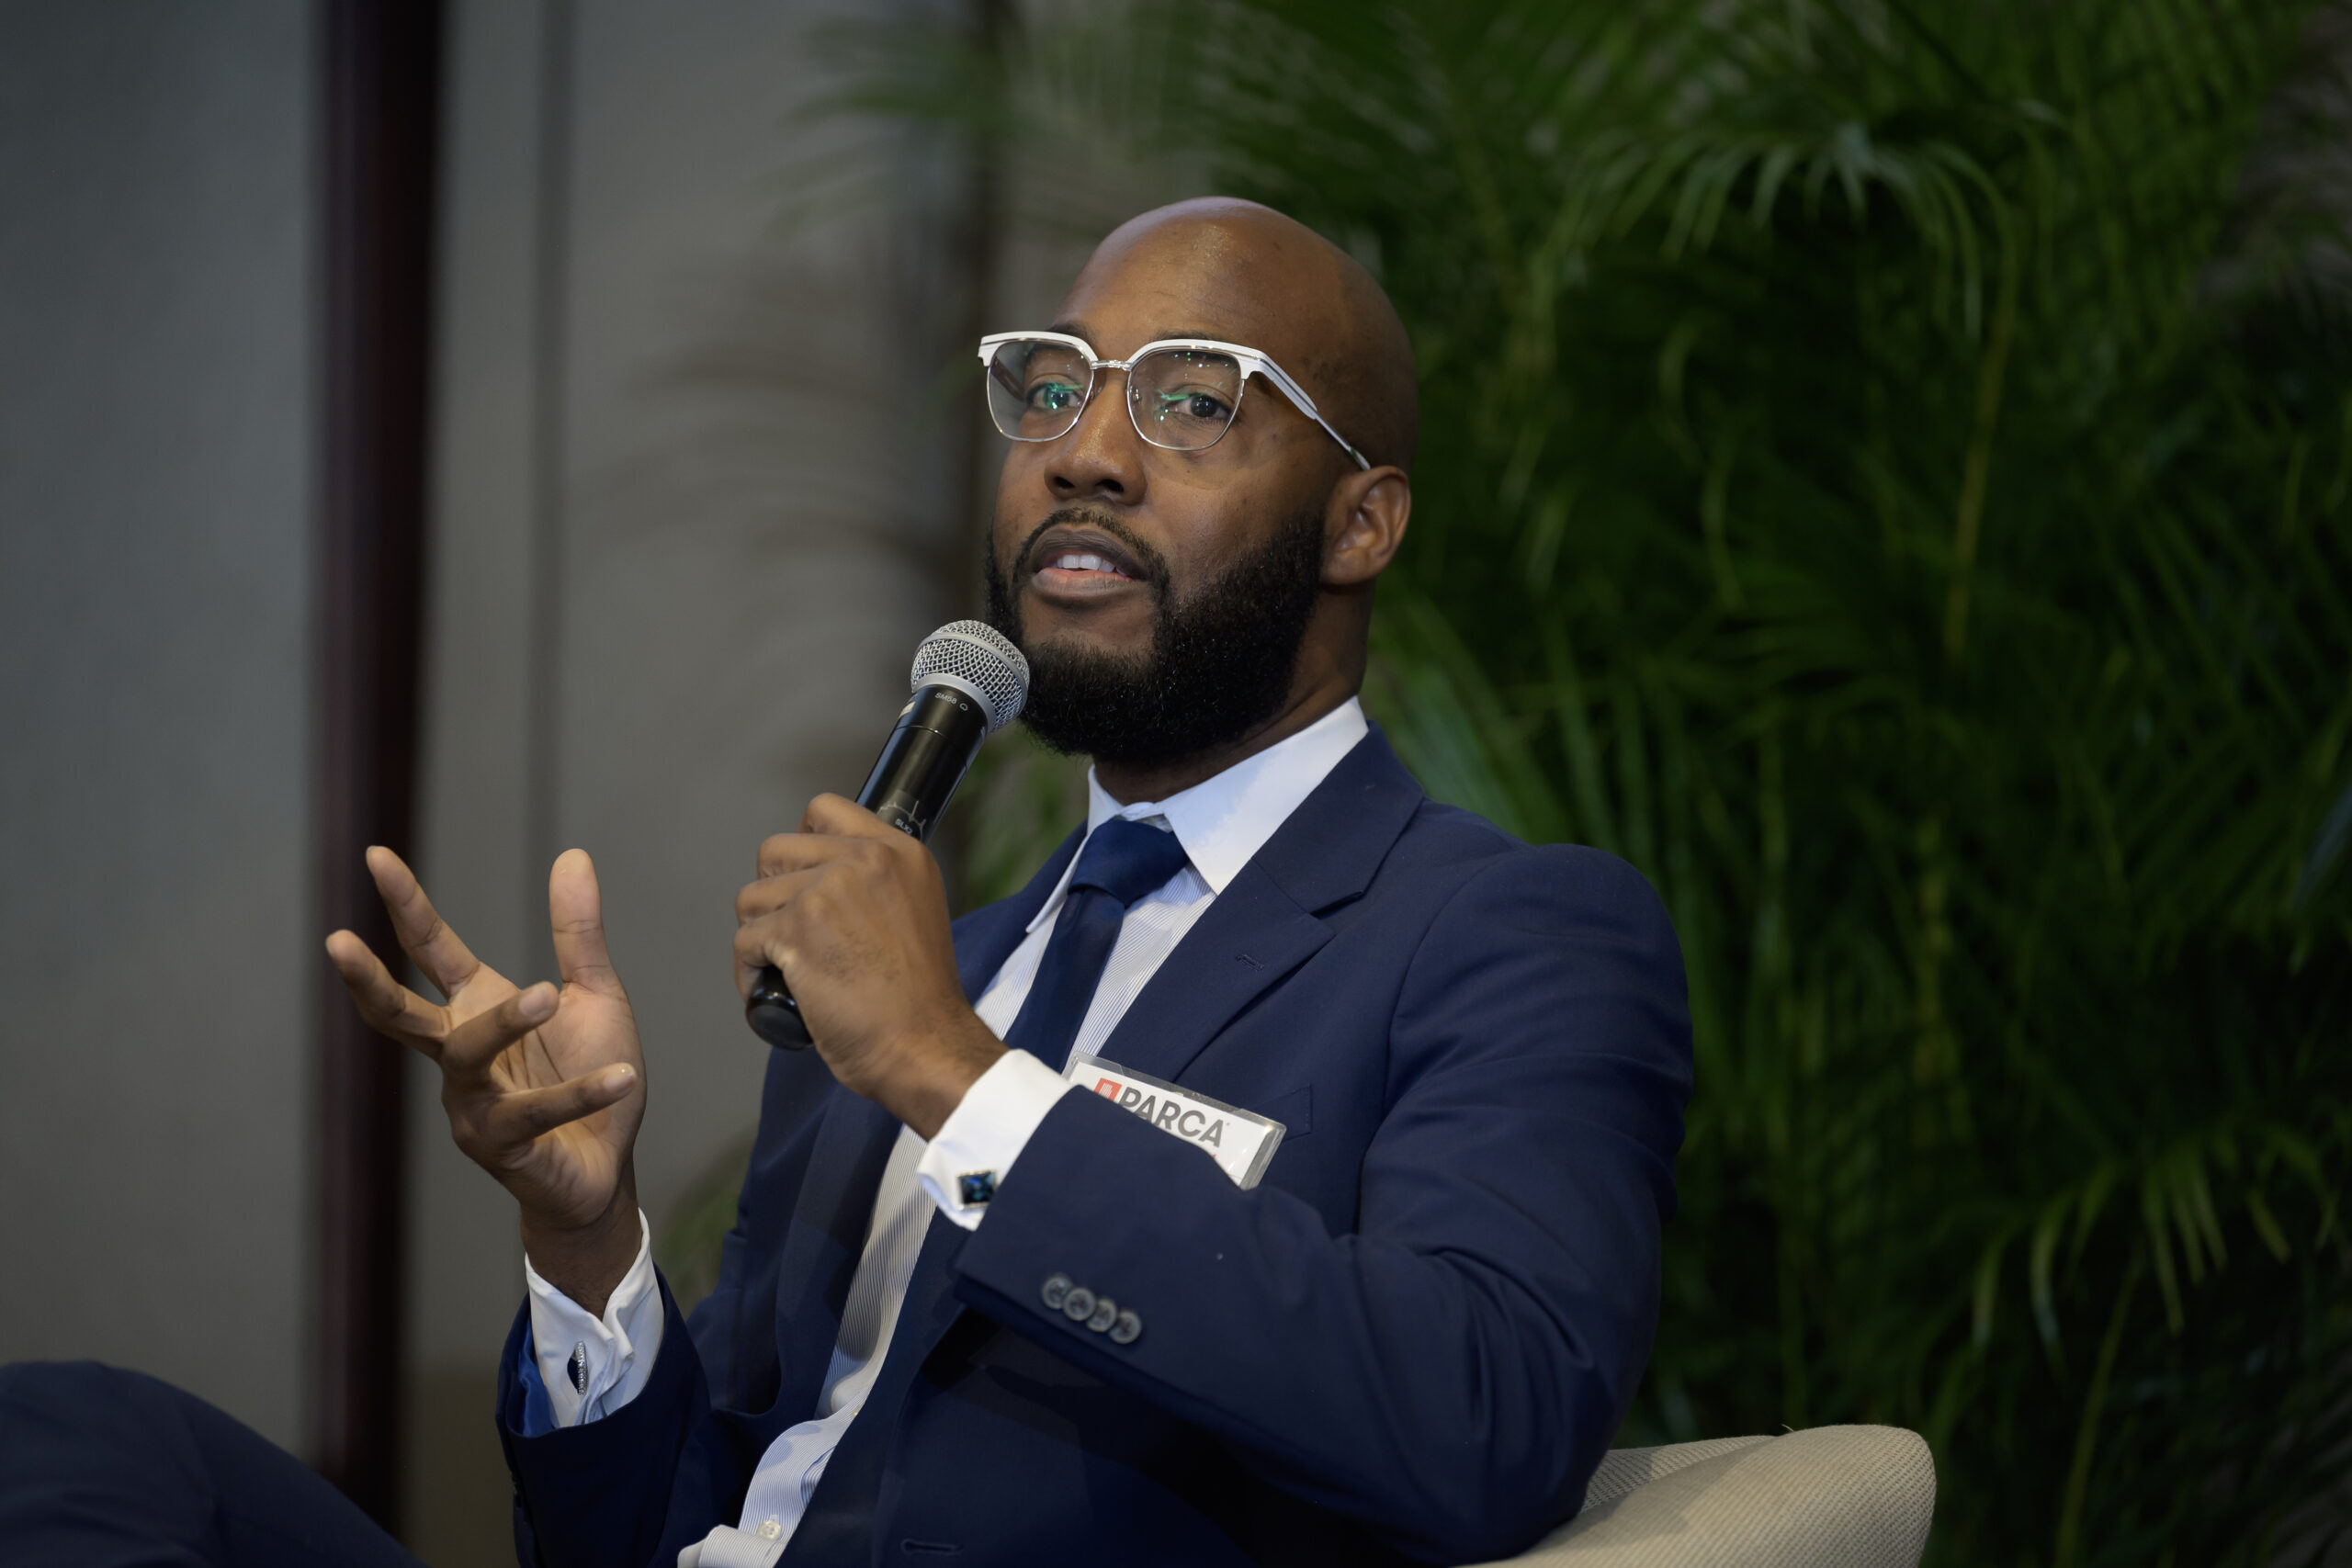
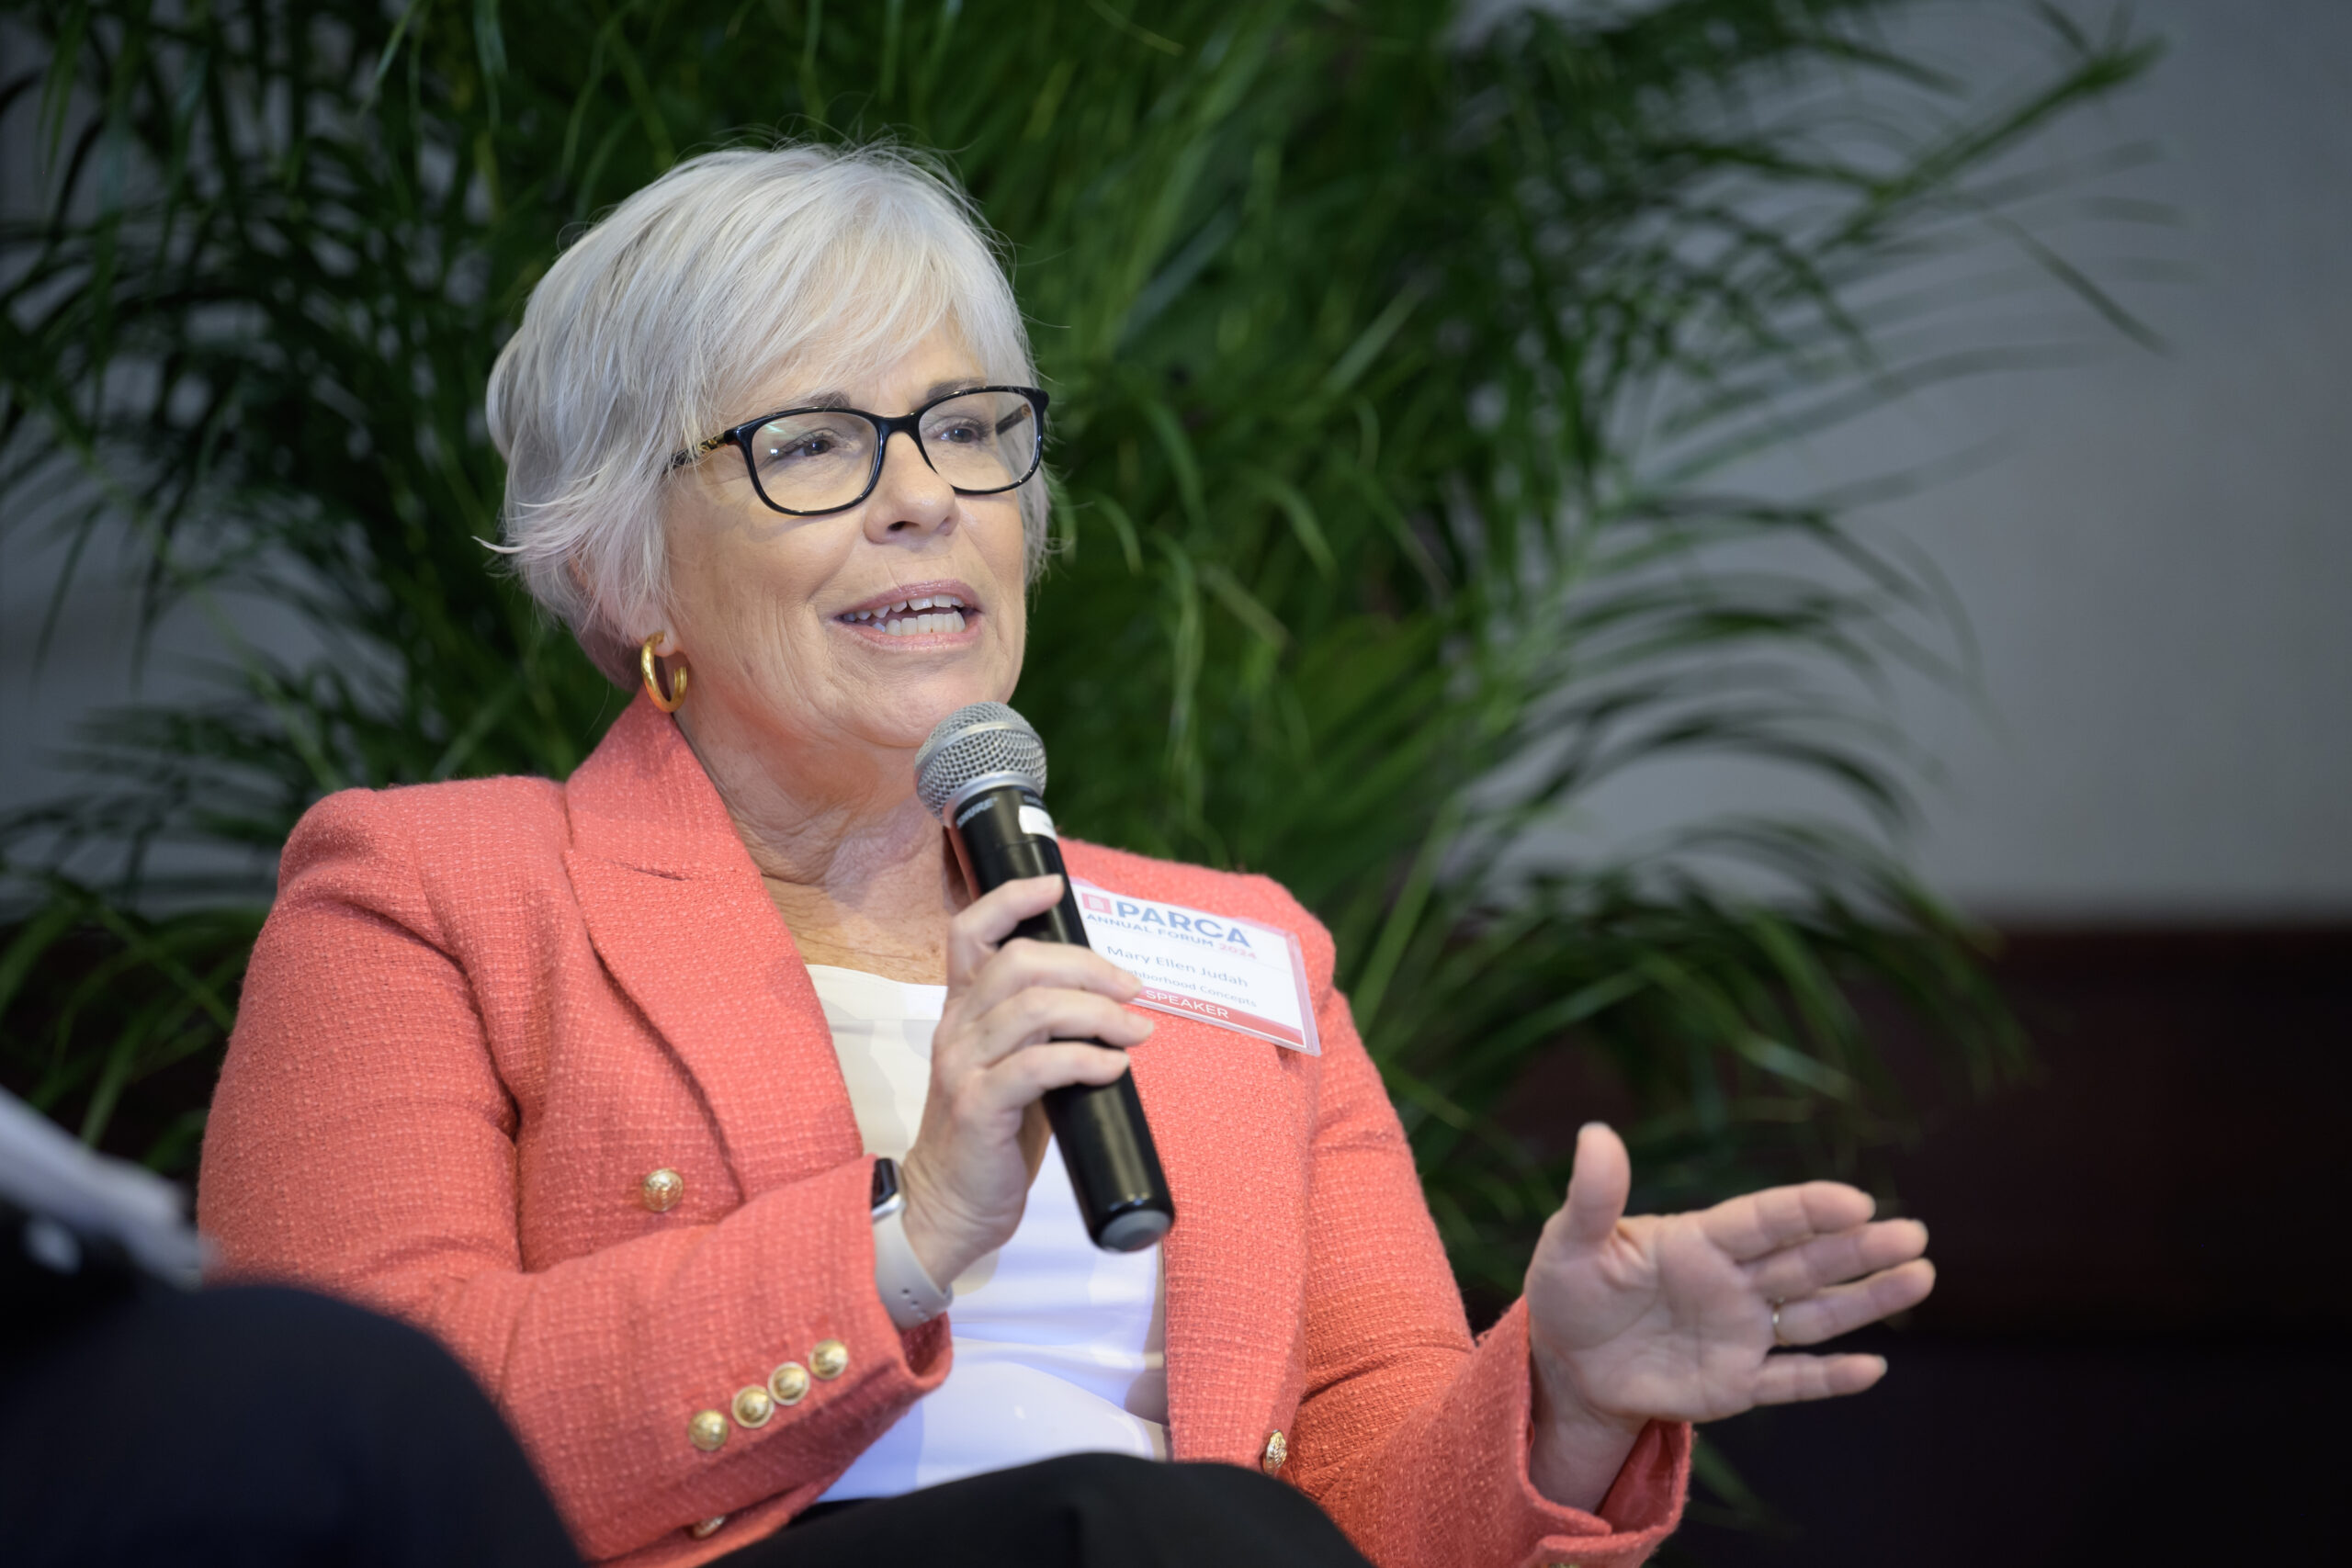
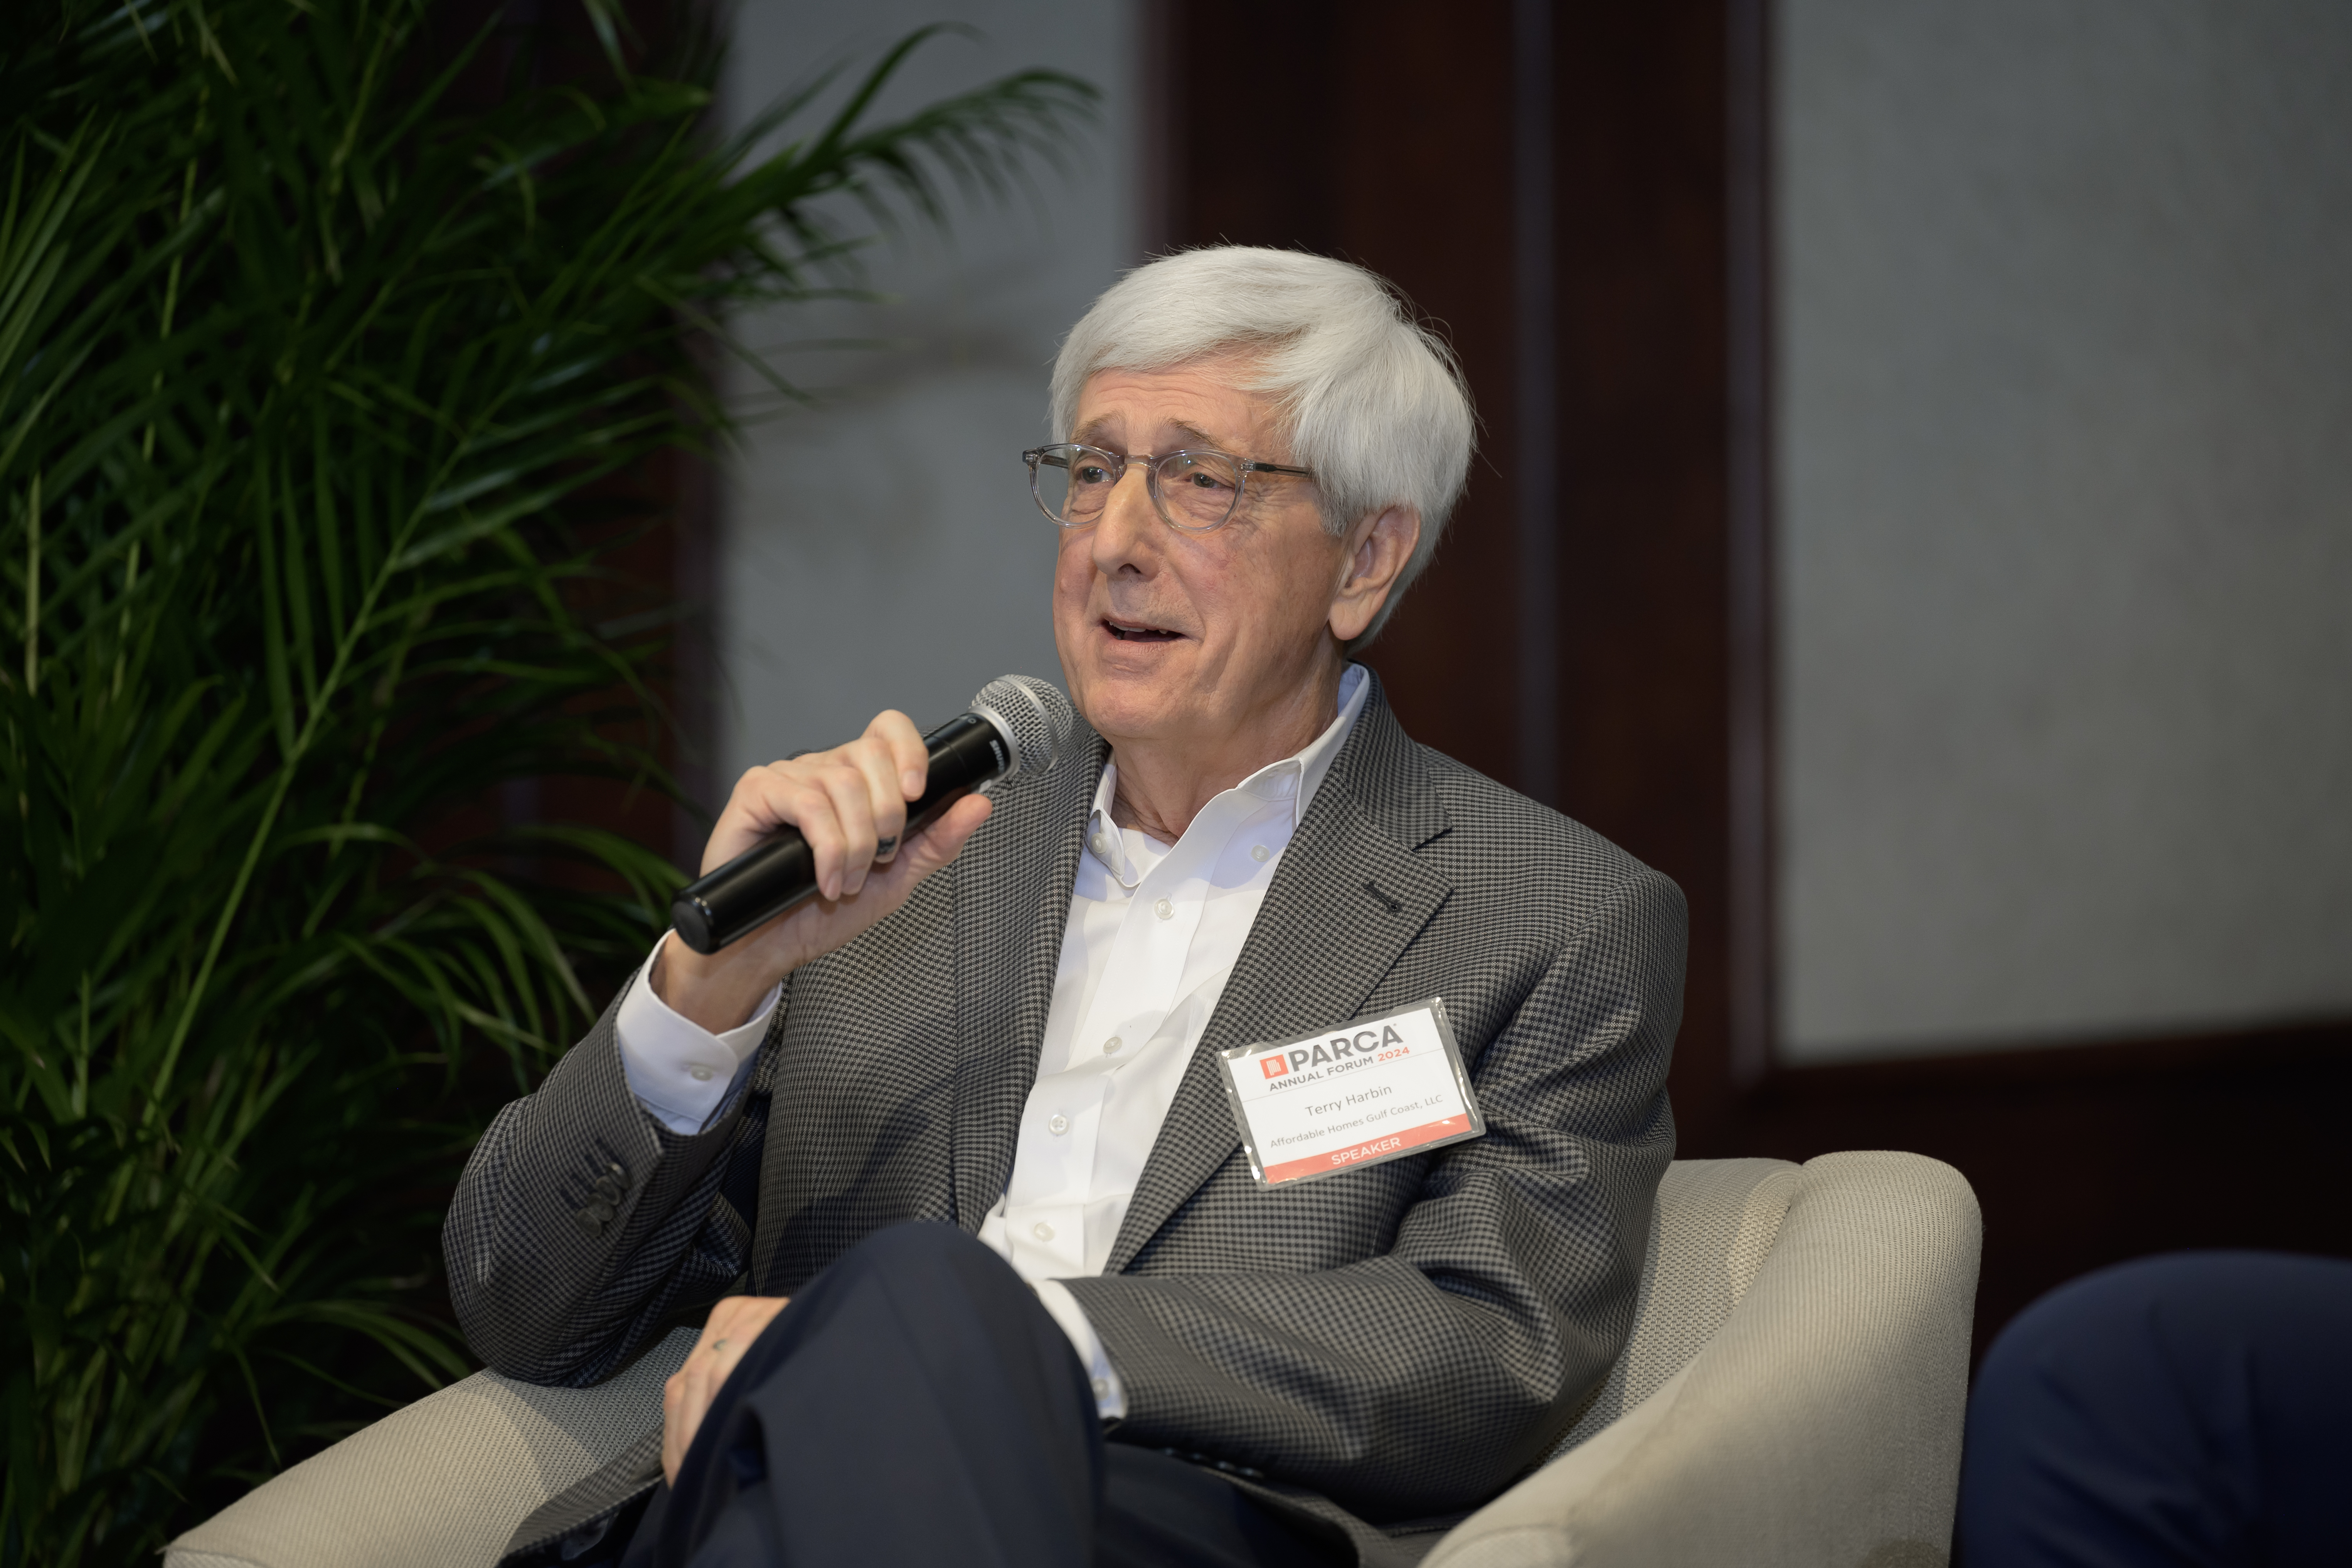
Lisa McCarroll, Navigate Housing PartnersAmanda Loper, David Baker ArchitectsCory Stallworth, City of BirminghamMary Ellen Judah, Neighborhood ConceptsTerry Harbin, Affordable Homes Gulf Coast
Lisa McCarroll made the point well, noting that some 40% of Alabamians may qualify for some type of subsidized housing. Another 44% do not qualify, but earn far less than necessary to afford market rate housing.
Amanda Loper offered examples of creative housing around the county that is both affordable and builds community.
Terry Harbin, a for profit developer Mobile, Mary Ellen Judah, Executive Director of the Huntsville-based nonprofit, Neighborhood Concepts, Cory Stallworth of the City of Birmingham, shared their differing approaches to addressing the shortage of workforce housing.
They highlighted the fact that federal tax credits for developing affordable housing in Alabama are restricted to one per county. And currently, Alabama has no state credit, though one has been introduced in the Legislature this session.
Jim Stockard challenged the audience with a series of questions to consider, including:
What are the types of publicly owned sites that might lend themselves to housing construction in Alabama cities?
Where are the existing market rate apartment buildings in your cities that might be re-purposed as mixed income complexes that could serve the workforce in their cities
What should the state allow or even mandate in terms of local zoning ordinances?
What level of assistance might cities or the state be willing to provide to assist households in becoming homeowners?
Encouraged…
Attendees noted they were encouraged to know there are people in Alabama working to address these concerns and that there are actually new things that the state can do.
More than 80% of surveyed attendees reported no, slight, or only moderate knowledge of housing policy before the event–and 90% of those same attendees reported the event improved their knowledge of the topic.
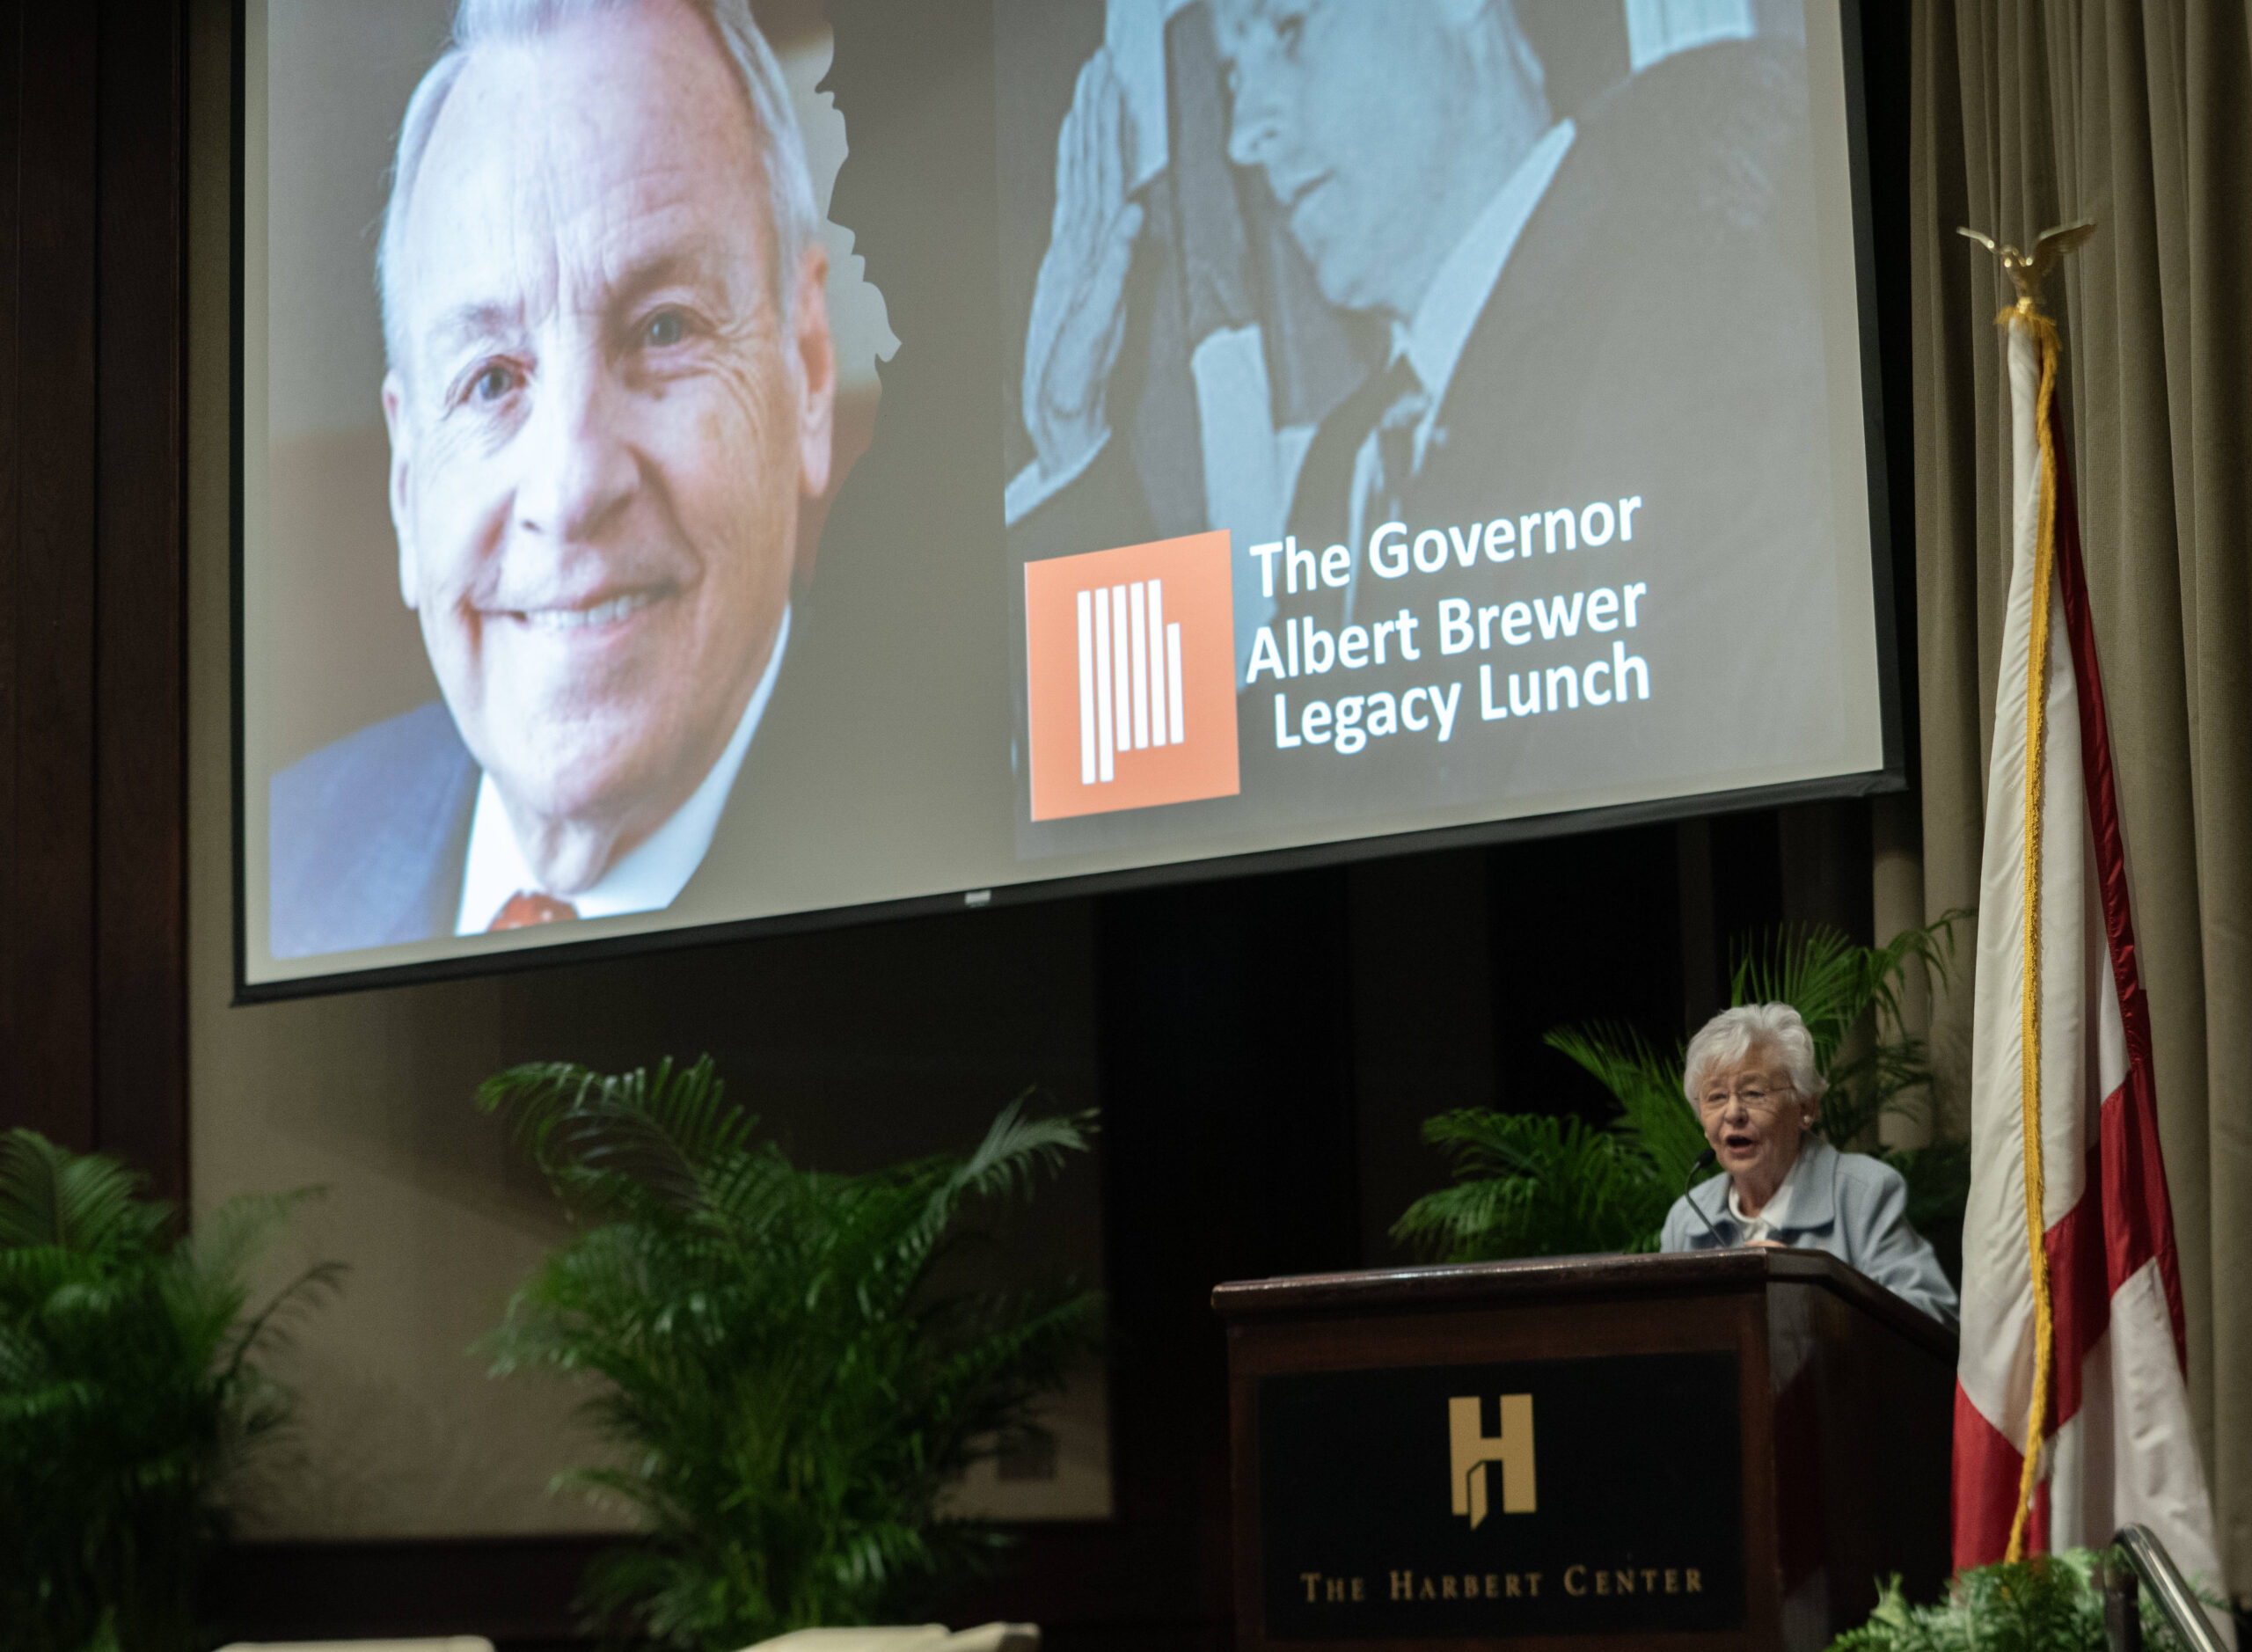
Governor Albert Brewer Memorial Lunch
Governor Ivey addressed the audience as part of the Governor Albert Brewer Memorial Lunch
Governor Kay Ivey gave remarks to the PARCA 2024 Governor Albert Brewer Legacy Luncheon at the Herbert Center Friday, March 8, 2024 in Birmingham, Ala. (Governor’s Office /Hal Yeager)Governor Kay Ivey gave remarks to the PARCA 2024 Governor Albert Brewer Legacy Luncheon at the Herbert Center Friday, March 8, 2024 in Birmingham, Ala. (Governor’s Office /Hal Yeager)
More Students Workforce Ready in the Class of 2023
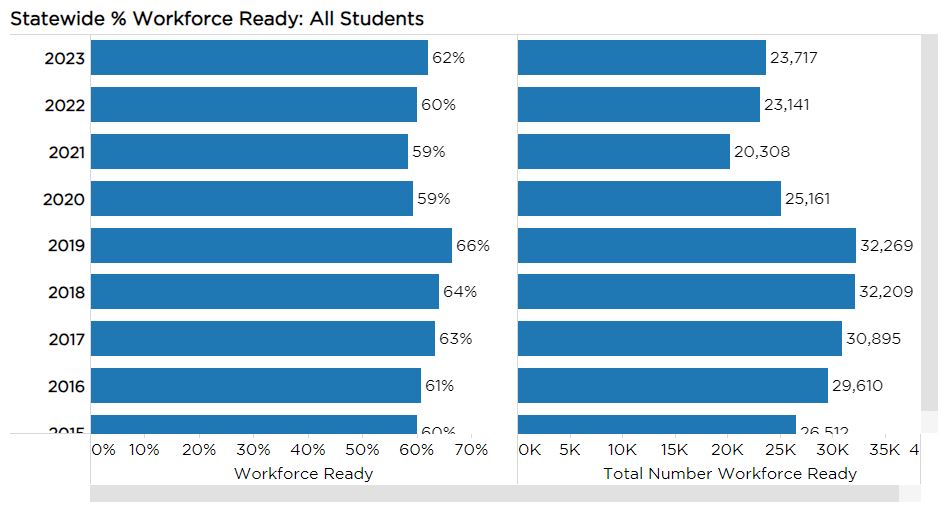
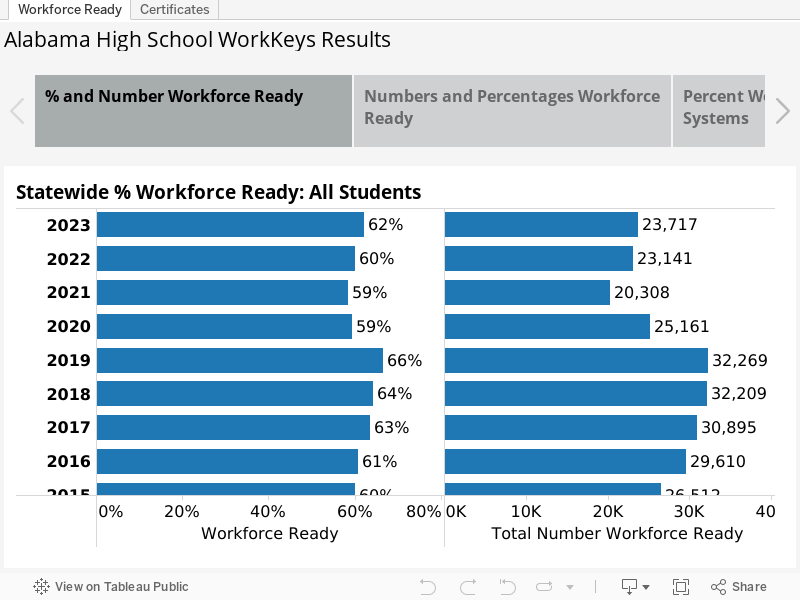
The number and percentage of high school seniors graduating workforce-ready rose with the Class of 2023, according to the results of ACT’s WorkKeys Assessment, a test of skills given to public high school seniors. The results are another sign that student performance is recovering from post-pandemic lows, though the recovery is not complete.
The WorkKeys test measures practical math, reading, and graphical literacy skills as they are employed in the workplace. That’s different than the ACT, which tests for knowledge and skills needed in a college classroom. In 2023, 72% of seniors took the test statewide, and 62% of those tested scored at or above the silver level of workforce readiness.
Figure 1. WorkKeys Results, Statewide Trends
WorkKeys is optional, and school systems vary in the percentage of students tested. WorkKeys was given to all seniors through 2019, but the State Department of Education stopped mandating the test. Some systems still test all seniors. Some systems make the test an option for students who haven’t demonstrated college and career readiness by another measure. WorkKeys is one of seven options for demonstrating college and career readiness.
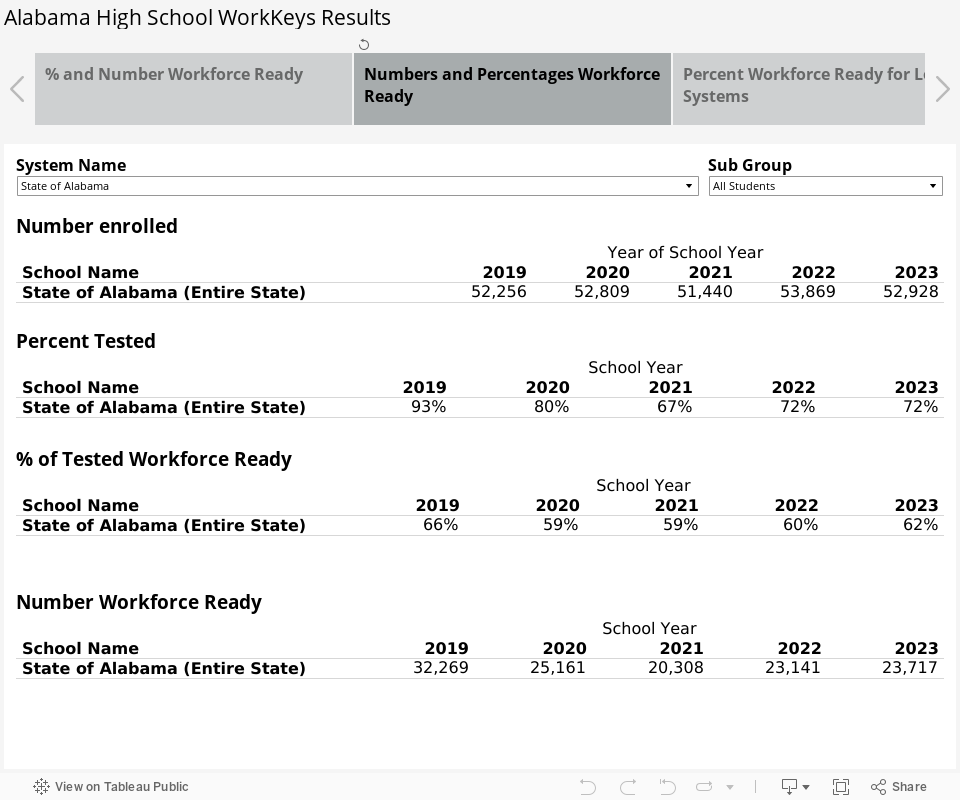
Figure 2. Numbers and percentages of participation and passing the workforce-ready benchmark
In addition, a student’s score on WorkKeys can be a recognized credential in the job market. Some businesses, particularly industrial employers, build WorkKeys into their hiring practices. Working with ACT, those employers have determined what level of proficiency, as measured by WorkKeys, is needed in particular jobs. Depending on their test performance, students earn a platinum, gold, silver, or bronze National Career Readiness Certificate. A student scoring Silver or above has the foundational skills for 67% of jobs that ACT has profiled, and that student is considered college and career-ready by the Alabama Board of Education.
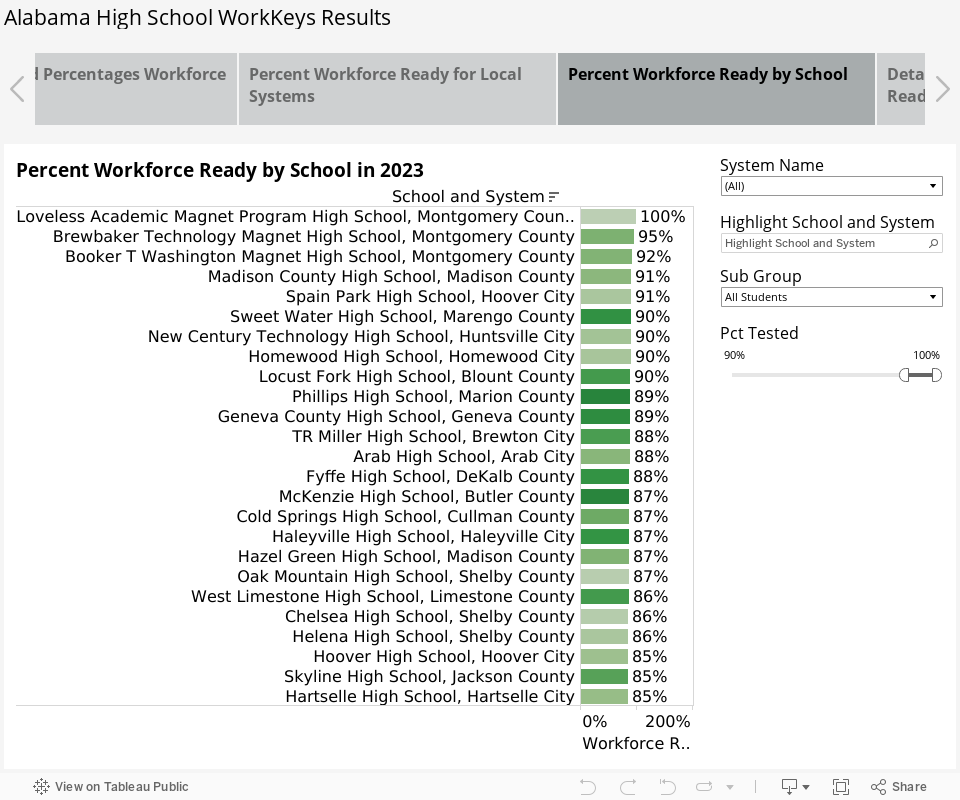
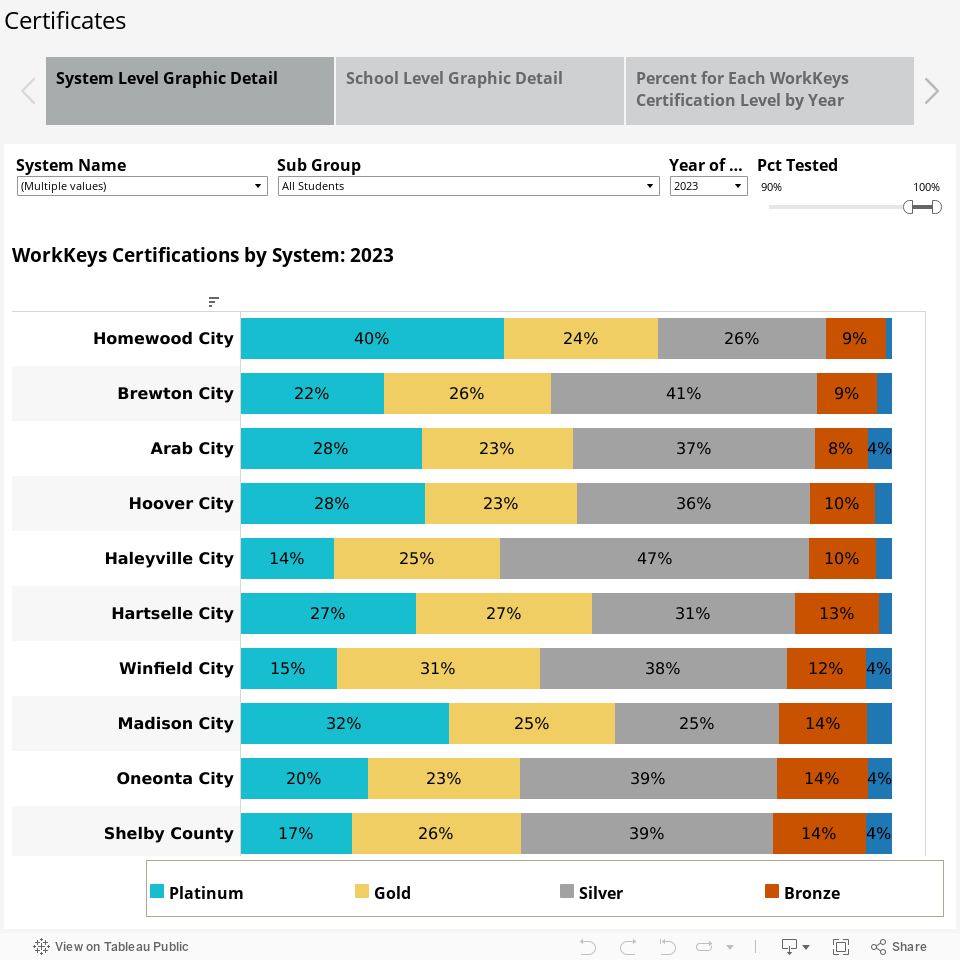
Figure 3. Percentage of all students workforce ready (scoring Silver or Above), by system, 2023 (Pictured are systems in which 90% of students were tested. Adjust filter to see other systems)
In Figure 3, the school systems are shaded by the percentage of economically disadvantaged students in each system. In general, systems with higher poverty percentages tend to have lower percentages of students scoring workforce ready. However, on WorkKeys, the correlation is not nearly as strong as it is with other measures, like the ACT college readiness test. WorkKeys seems to provide a more even playing field for comparative performance.
However, the 2023 WorkKeys test results do show a pattern similar to other assessments in the wake of the Covid-19 pandemic. After dropping in 2020, 2021, and 2022, WorkKeys results rebounded more strongly among nonpoverty students in 2023. In contrast, students from low-income backgrounds have been slower to recover to pre-pandemic levels.
Figure 4. Percentage Workforce Ready by School, 2023
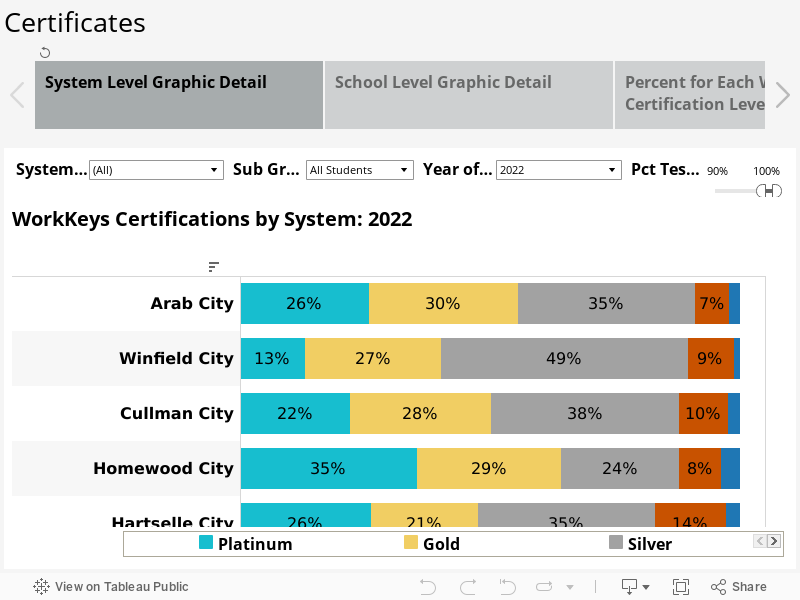
The visualization below presents the results in a more detailed fashion. Each color represents the percentage of tested students scoring at each level: platinum, gold, silver, bronze, and no certificate earned. Use the menus to adjust the comparison and use the various tabs, to explore different aspects of the data.
Figure 5. WorkKeys Results, by level of certification, by system, 2023
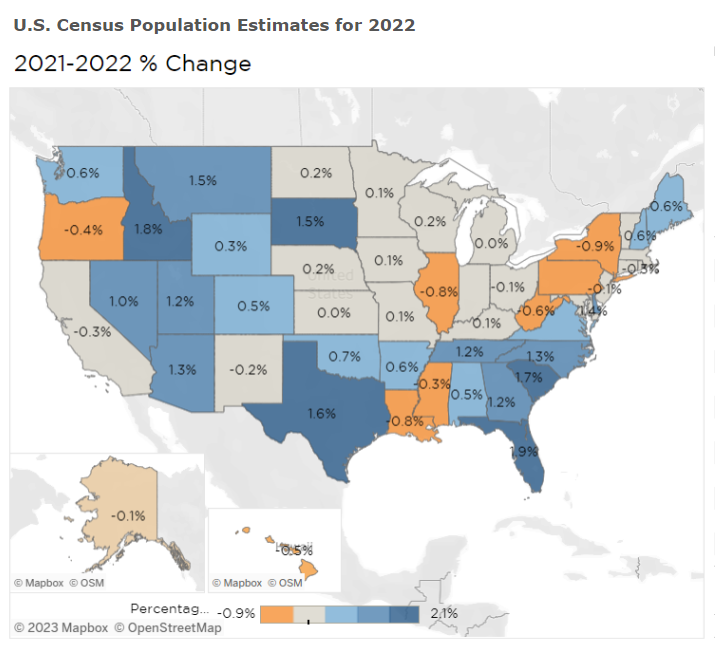
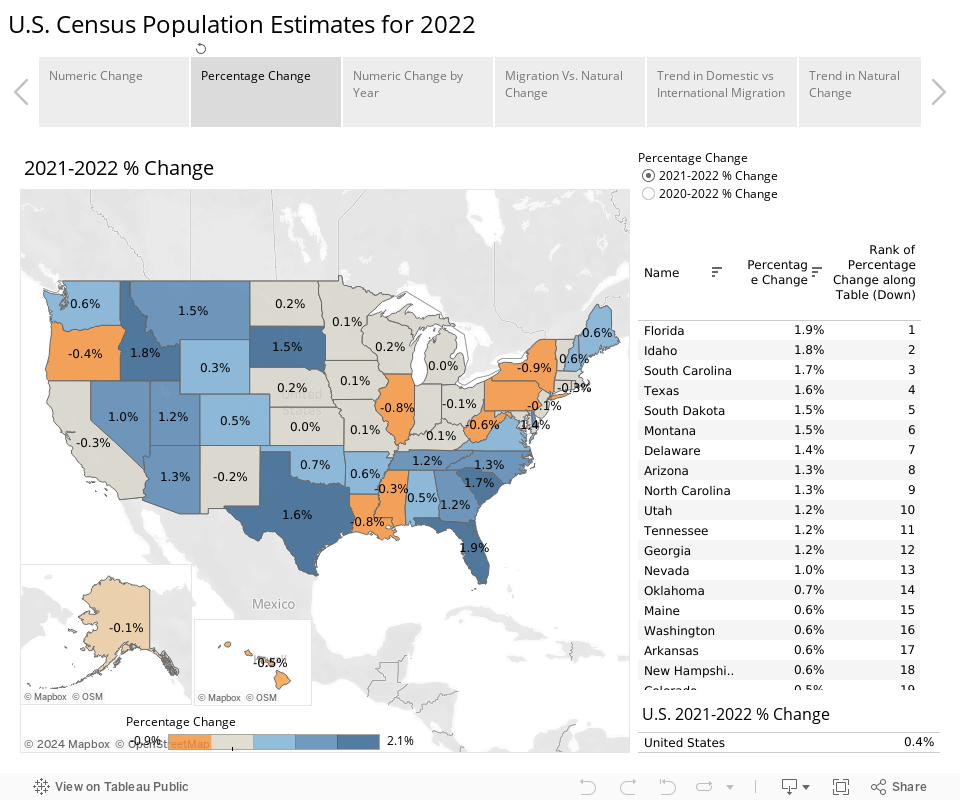
Alabama’s Population Growth Accelerating
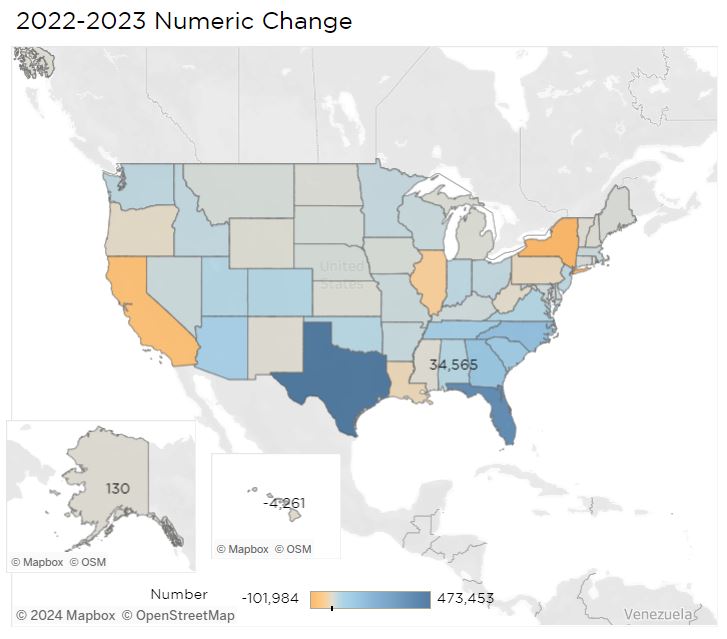
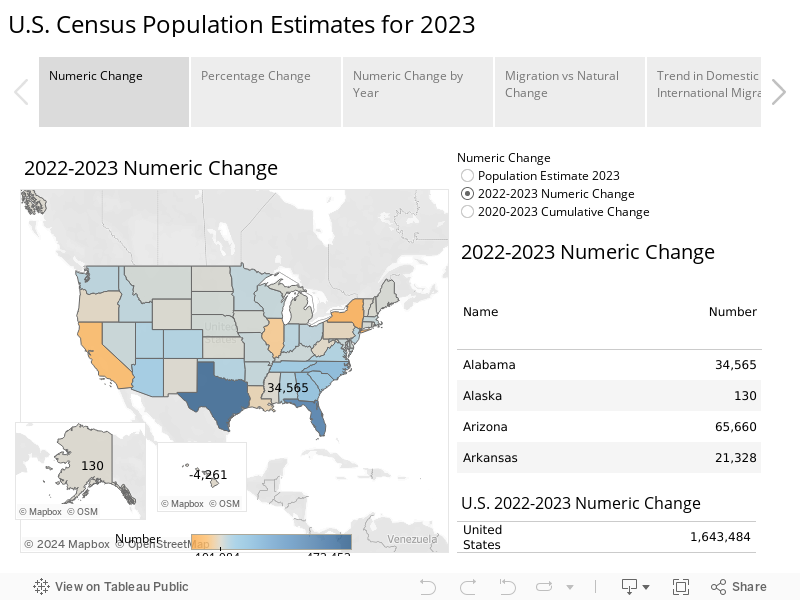
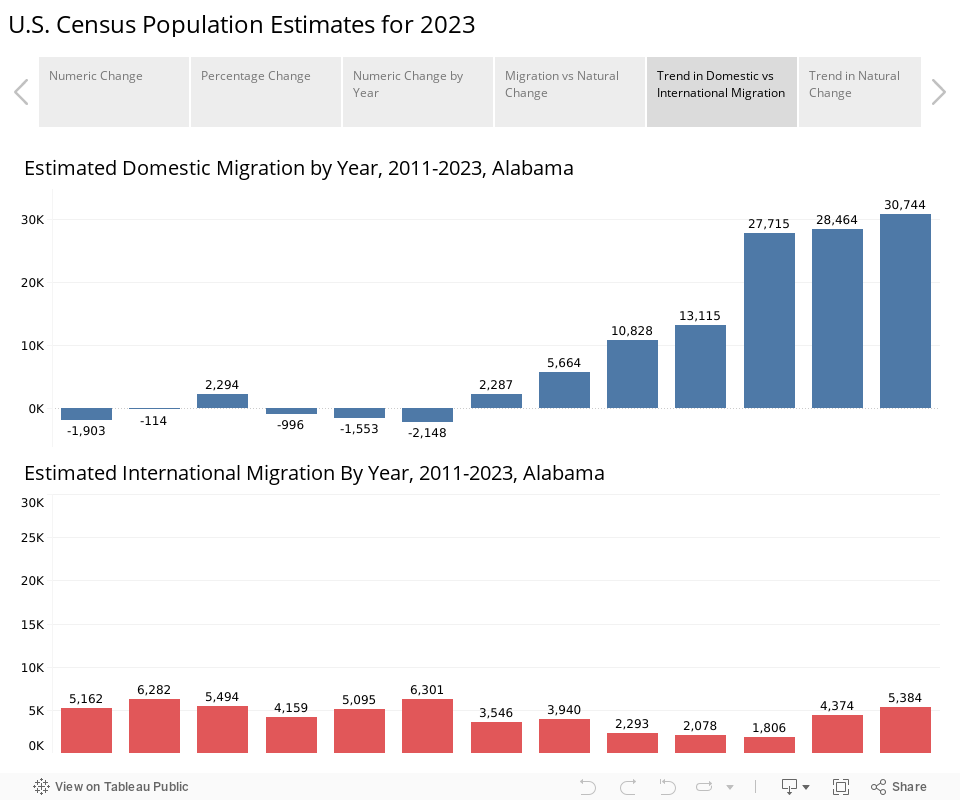
Alabama’s population increased by 34,000 last year to 5.1 million, driven by increased domestic migration and a decreasing number of deaths, according to the latest population estimates published by the U.S. Census Bureau, covering the period between July 1, 2022 and July 1, 2023.
That’s the 15th fastest rate of growth among U.S. states and ranks 11th in terms of the number of people added. Still, Alabama’s growth rate trails other Sunbelt and Mountain West states, including Southeastern neighbors like Florida, Georgia, Tennessee, and South and North Carolina.
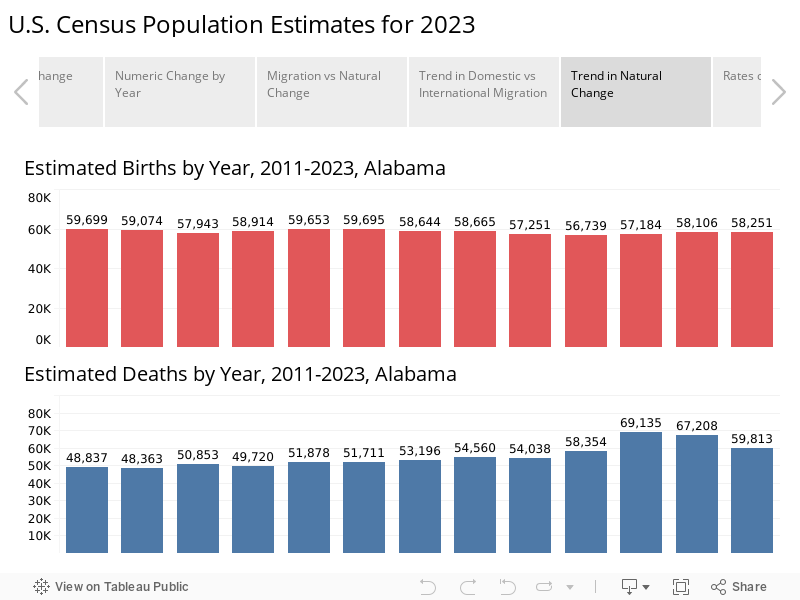
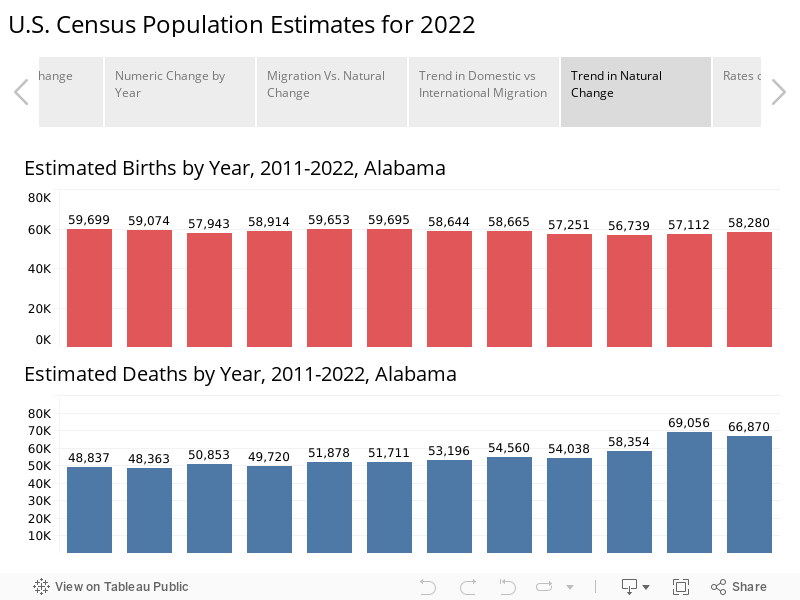
Alabama’s death rate fell from the third-highest in 2021 to the sixth-highest in 2023. Still, more people died in Alabama than were born here, according to the 2023 estimates. But the gap narrowed. Births were up by about 150, and the estimated number of deaths in 2023 was down by almost 10,000 from the 2021 peak of the Covid-19 pandemic.
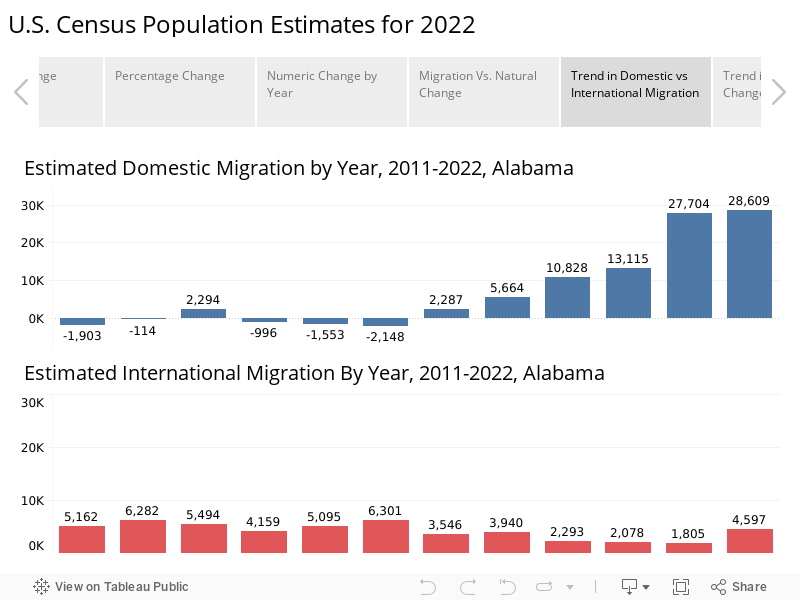
Most of the population change resulted from people moving in from other states. The state received 30,744 domestic migrants, 2,000 more than moved in the year before. International migration into Alabama increased to 5,364 net new arrivals, or about 1,000 more than the year before.
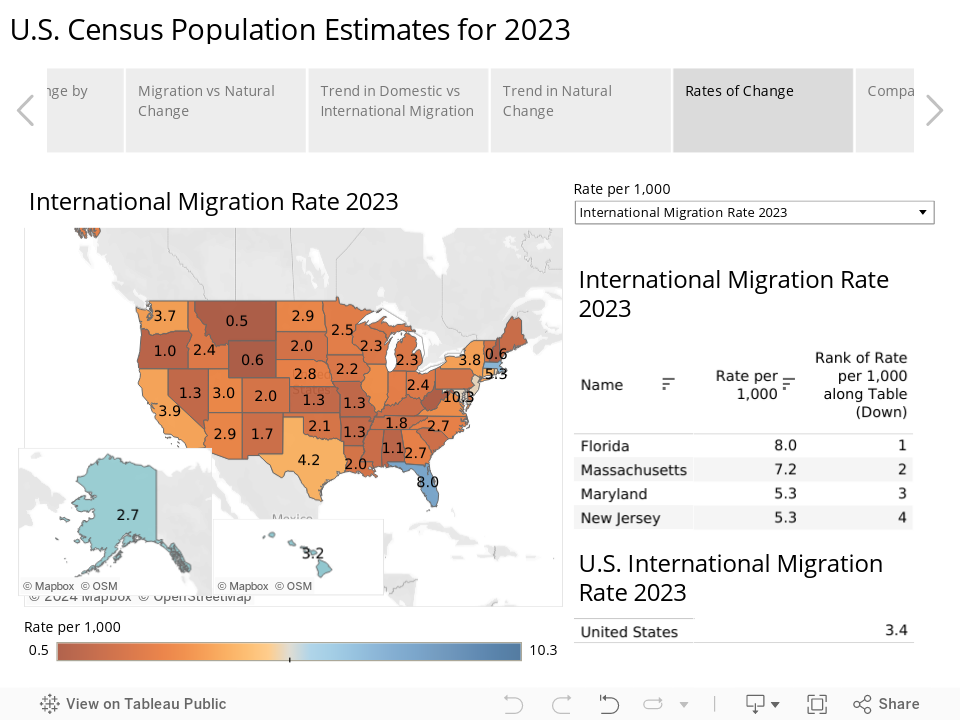
In 2023, Alabama’s rate of domestic immigration was the 10th highest in the U.S. However, Alabama still has one of the lowest rates of international immigration among states, ranking No. 45.
Texas and Florida added the most people. New York, Illinois, and California saw the biggest declines. All the Southeastern states, with the exception of Louisiana and Mississippi, recorded population increases. That pattern has been consistent since 2020.
Census population and change estimates for counties, metro areas, and cities will be released later in the year. Use the tabs and menus in the visualizations to explore the data.
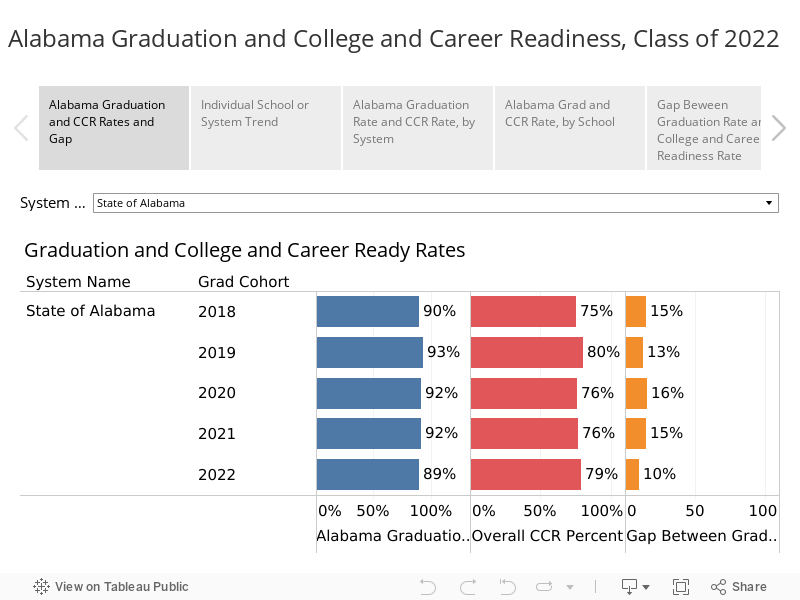
Grad Rate Dipped, but Career Readiness Climbed for Class 2022
As graduation approaches for the Class of 2023, there’s new data available allowing us to look back on last spring’s graduates.
The Class of 2022 faced particular challenges due to the Covid-19 pandemic, which struck when they were sophomores and persisted through their junior year. In both those years, the number of kids who dropped out was elevated: over 1,000 juniors from the Class of 2022 cohort dropped out, more than double the number of juniors that dropped out in the Class of 2021.
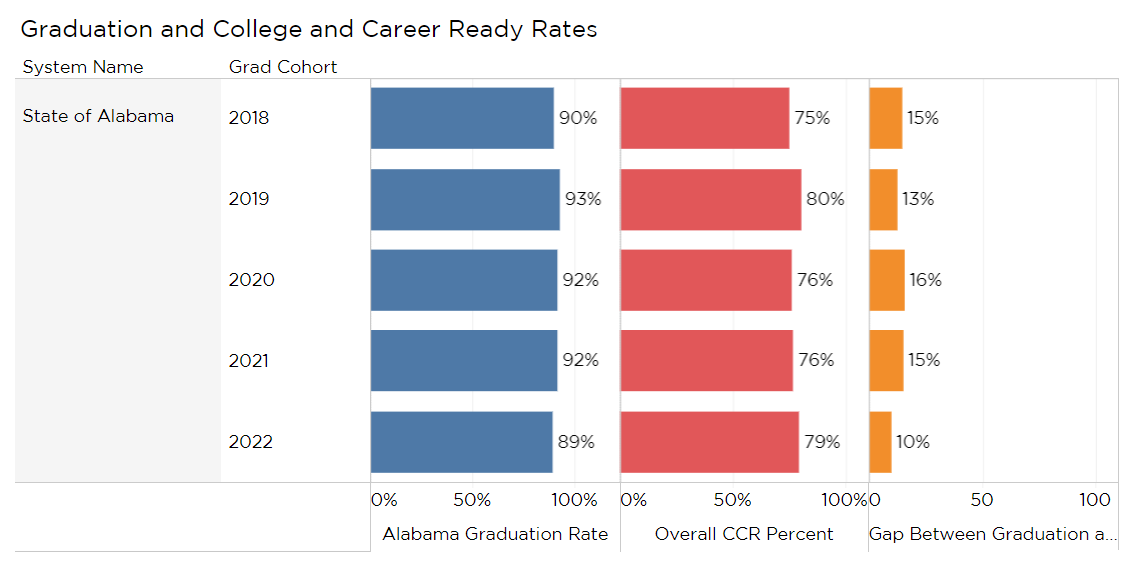
In the end, 89% of seniors graduated, compared to 92% in 2011, but those that persisted were more likely to finish college- and career-ready (CCR).
The Class of 2022 posted a significant jump in the percentage of CCR seniors, thanks to a jump in the percentage of students earning workforce-related credentials and an increase in dual enrollment.
In 2022, 79% of seniors were certified as CCR, up from 76% in 2021. That gain was despite a large drop in the percentage of seniors testing college ready on the ACT. (See PARCA’s previous analysis on the ACT results).
Fig1. Trends in High School Graduation and College and Career Readiness
The Class of 2022 broke a trend of smaller graduating classes, and despite the elevated dropout rate, more students graduated.
State leaders had been calling on schools to close the gap between graduation and career-ready rates.
A lower graduation rate combined with college-and-career readiness means that the gap between graduation and readiness narrowed to 10 percentage points, compared with 15 percentage points the previous year.
Shifts in Readiness
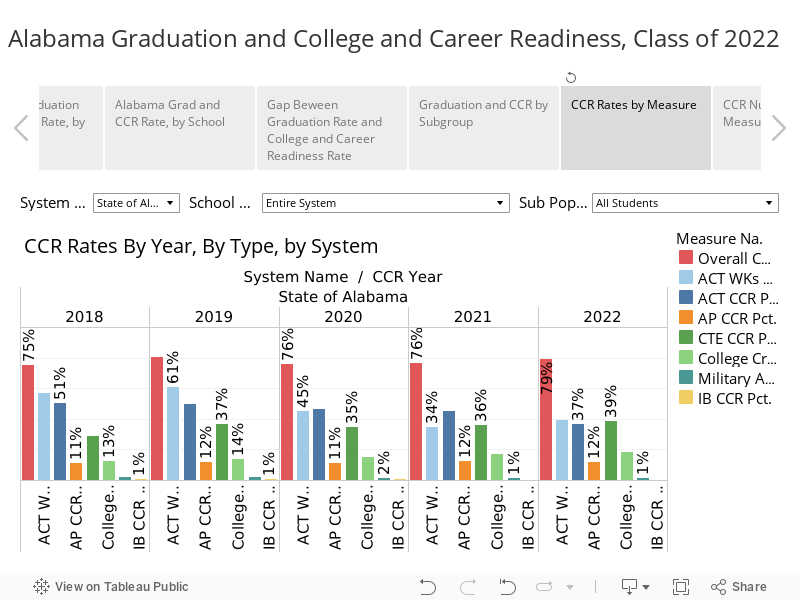
High school students can demonstrate college and career readiness in several different ways. Figure 1. allows you to explore trends on each measure. Diving below the surface on these measures presents a mixed picture of the Class of 2022.
Fig. 2 College and Career Readiness Measures, by Percentage of Seniors Earning
College and career readiness can be demonstrated by one or more of the following:
Earn an Industry Recognized Credential through Career Technical Education: 39% of students earned an industry-recognized credential through career technical education in 2022, the highest rate for any class. These credentials result from taking work-oriented courses offered at high schools or K-12 career tech centers. Credentials must be tied to a student’s course of study and should be valued in a career field that is in demand in the regional job market. According to State Department of Education data, in 2022, the biggest jump in credentials earned was in certifications in the use of Microsoft software. Big gains were also posted in the number of students earning Certified Guest Professional credentials, a credential associated with the hospitality industry, and in Adult Beef Quality Assurance, an ag-related credential. Also posting gains were credentials associated with healthcare, construction, forestry, and the military’s ROTC programs. Across all grades, the 2021-2022 academic year saw more students earning CTE credentials than ever before: 33,535 compared to the pre-pandemic peak of 31,062 in 2019. While the growth is laudable, attention should continue to be focused on the quality and value of the credentials available.
Earn Credit Through a College: a higher percentage of students earned college credit while in high school in 2022 than ever before: 18%. That’s up from 17% in 2020. These courses, also known as dual enrollment, tend to be taken through a local community college but can also be through a university. The student must successfully complete the course and earn credit to qualify as CCR.
Earn a Qualifying Score through College-level Courses Taught in High Schools: Advanced Placement (AP) courses are taught in a high school but have the rigor and approach of college courses. In 2022, 12% of students qualified as CCR through AP, which is tied for the highest percentage ever. To count as CCR, a student has to score three or higher (out of 5) on the national end-of-course test, a level at which a college might award college credit. The number of students qualifying through success in International Baccalaureate (IB) classes also increased. IB is similar in rigor to AP, though less widely used.
Earn a qualifying score on WorkKeys: 39% of seniors demonstrated college readiness by performing well on ACT’s WorkKeys test. This marked a recovery in the number and percentage of students qualifying by this measure. After dropping from 2019 to 2021, 2022 saw a recovery of 5 percentage points in 2022. WorkKeys is a standardized test designed to measure whether students have the math and communication skills expected in workplaces. WorkKeys is no longer required, and, in many systems, students who have already demonstrated college and career readiness by another means opt out. (More on WorkKeys results below)
Earn a benchmark score in a subject test on the ACT: The percentage of students scoring at or above the college-ready benchmark on the ACT was down by 8 percentage points in 2022, to 37%. This rate has been dipping consistently every year and is now down 14% from 2018. A student scoring above the benchmark has a 50% chance of earning a B or above and a 75% chance of making a C or above in that course in college. Covid disruptions may have had some bearing on students’ ability to prepare for and take the ACT, which tests readiness for success in college. Alabama’s drop in performance coincides with a national drop that began before Covid but appears to have been exacerbated by the pandemic.
Successfully enlist in the U.S. Military: The same percentage of students gained admission to the military, but that represents an increase of from 519 in 2021 to 590 in 2022. However, that total is less than half of what it was in 2018 when 1,129 seniors entered the military after high school.
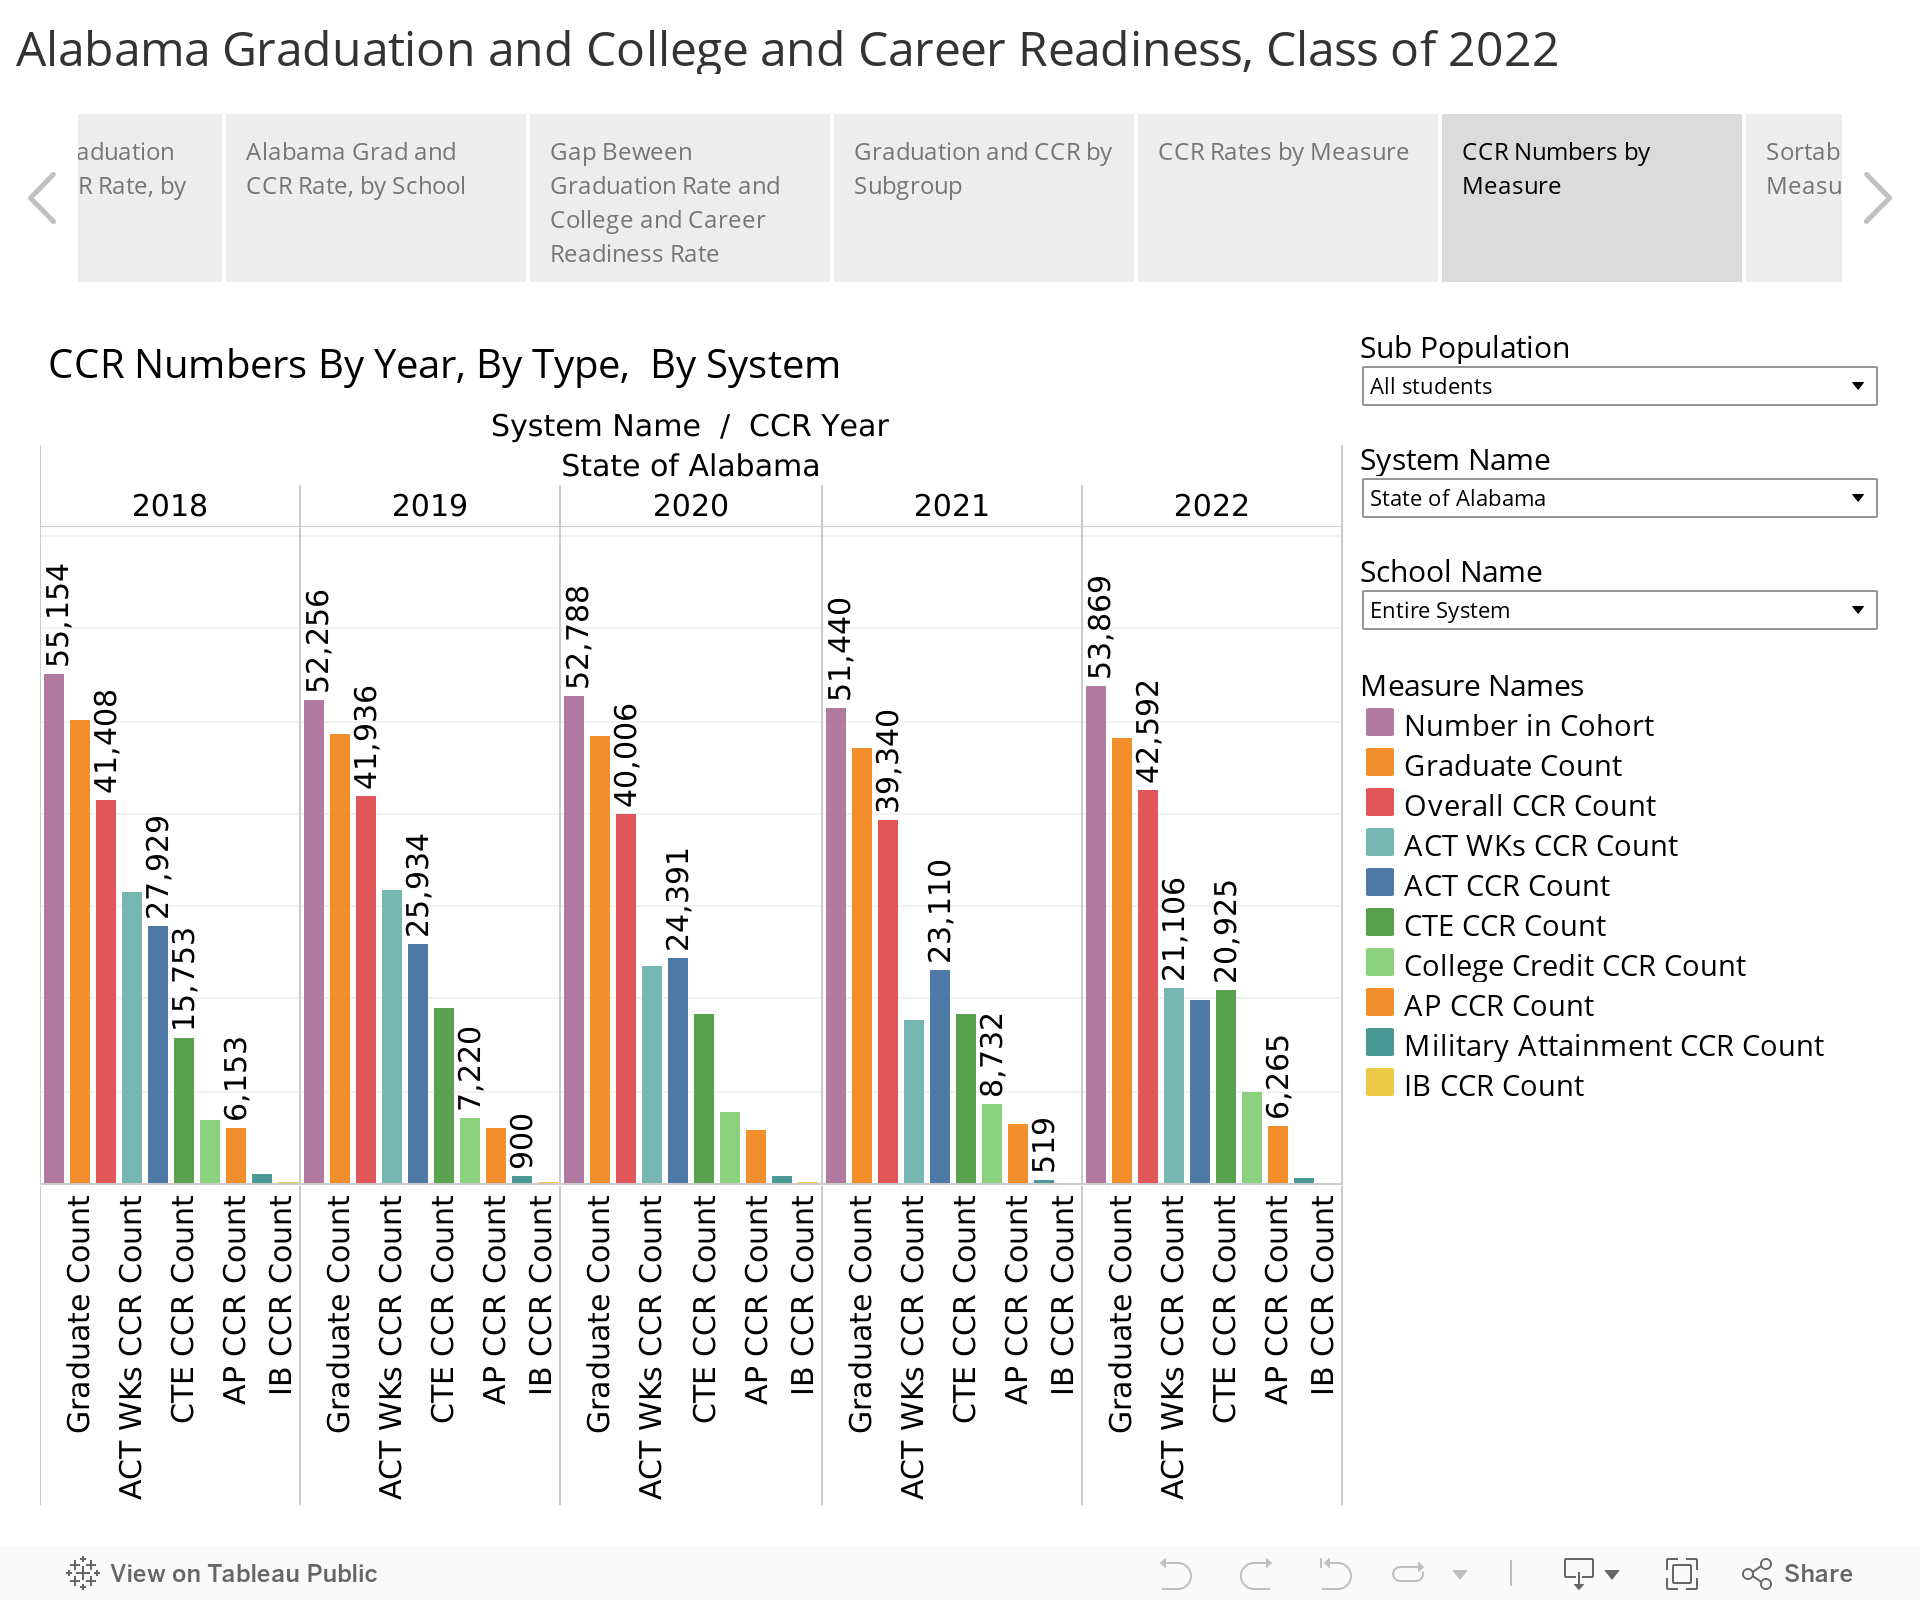
Fig. 3 College and Career Ready, by Number of Seniors Earning
The Class of 2022 deviates from recent trends. Over the past few years, fewer students have been progressing through Alabama public schools. From 2018-2021, class sizes were down 7%. During that time, we saw a 6% decrease in graduates and a 5% decrease in career or college-ready students. In 2022 however, we saw a class size increase of 5%, a 2% rise in graduates, and an 8% rise in career or college-ready students. This symbolizes a return to pre-pandemic numbers. However, the new generation of students is known to be smaller. In light of this and the ongoing elevated demand for skilled workers, Alabama must focus on graduating every student with the skills needed to succeed in higher education and/or the workplace.
School and System Results
Last year, one system and twenty-four schools reported a 100% on-time graduation rate. This year, one system, Magic City Acceptance Academy, and only fourteen high schools reported a 100% on-time graduation rate. Fourteen high schools reported both 100% graduation and 100% CCR rate. In some schools, a higher percentage of seniors demonstrated college and career readiness than graduated.
Fig. 4 CCR and Graduation Rates by System, 2022
On the other hand, fifteen schools had graduation rates below 75%. Nineteen high schools had CCR rates below 50%. Only nine school systems had a gap greater than 25% between their graduation rate and the college and career readiness rate. In those systems, more than a quarter of students receiving diplomas hadn’t demonstrated their readiness for college or work, despite having met Alabama’s requirements for obtaining a high school diploma.
In the visualizations below, school systems and schools can be sorted by either graduation rate or college and career readiness rate. The solid-colored horizontal bar represents the graduation rate; the short vertical bar represents the CCR rate. Through the tabs above the visualization, other data is accessible, including a graph of the gap between the graduation and CCR rate by system.
The same set of sortable data is available by school. In order to protect student privacy, results for small subpopulations of students are not presented.
Fig. 5 CCR and Graduation Rates by School, 2022
Gaps Between Subgroups
Historically, there have been gaps in the high school graduation rate between students of different races. In 2022, the gaps in graduation got slightly bigger, and the gap in overall CCR was slightly reduced. Some trends seen in past years are continued or even exaggerated. CCR rates for economically disadvantaged students are well behind those of non-economically disadvantaged students. Examining the subcomponents of CCR, the gap is widest on the ACT despite everyone achieving lower numbers from years past.
Only 18% of Blacks and 22% of Hispanics benchmarked in a subject on the ACT, compared to 47% of whites. Asians are much further ahead, with 68%. By contrast, there is almost no racial gap in college and career readiness rates in career technical education: 38% of Black students earned an industry-recognized credential through CTE compared to 40% of whites and 40% of Hispanics.
Fig. 6 CCR and Graduation Rates by Subgroup, 2022
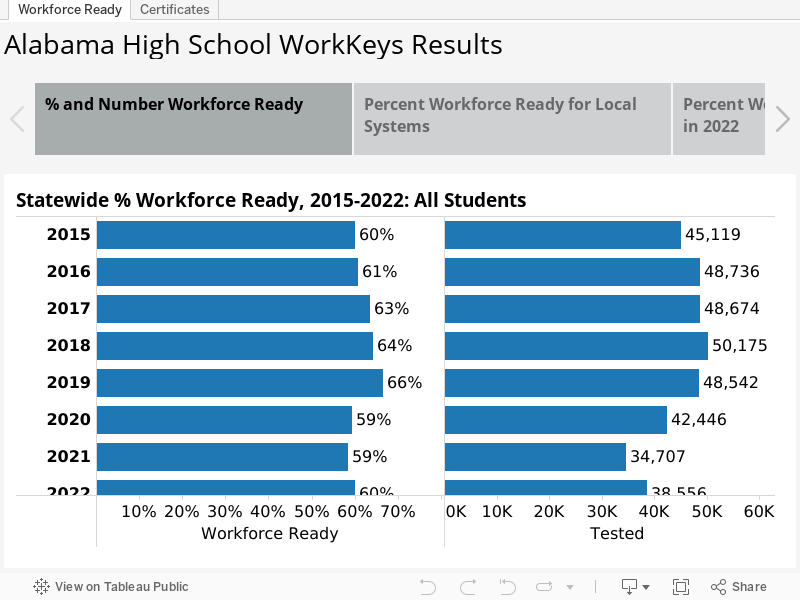
WorkKeys
The number of high school seniors taking ACT’s WorkKeys Assessment increased by almost 4,000 in 2022, a major reversal in a downward trend in the use of the test.
Along with higher participation, a higher percentage (60%) and a greater number of students (2,833) qualified as college and career ready as a result of their scores.
Fig. 7 WorkKeys Results, Statewide Trends
WorkKeys is given to seniors and is designed to measure practical math, reading, and graphical literacy skills as they are employed in the workplace. That’s different than the ACT, which tests for knowledge and skills needed in a college classroom.
WorkKeys was given to all seniors through 2019, but the State Department of Education stopped mandating the test in 2019. While some systems still test all seniors, some systems make the test an option for students who haven’t demonstrated college and career readiness by another measure.
Some businesses, particularly industrial employers, build WorkKeys into their hiring practices. They have determined what level of proficiency, as measured by WorkKeys, is needed in particular jobs. Depending on their test performance, students earn a platinum, gold, silver, or bronze National Career Readiness Certificate. A student scoring Silver or above is considered college and career ready.
Jefferson, Mobile, Montgomery, Limestone, and Lauderdale County systems, as well as city systems in Huntsville, Birmingham, Florence, and Madison recorded large increases in the number of students taking WorkKeys and successfully earning credentials.
Fig. 8. Number of Students Workforce Ready 2022 and Change from 2021
The visualizations that follow present WorkKeys results statewide and in systems where more than 90% of seniors took the test. The percentage of students scoring workforce ready are those that score Silver or above.
Fig. 9. Percentage Workforce Ready by System, 2022
The visualization below presents the results in a more detailed fashion. Each color represents the percentage of tested students scoring at each level: platinum, gold, silver, bronze, and no certificate earned.
Fig. 10. WorkKeys Results, by Level of Certification, 2022
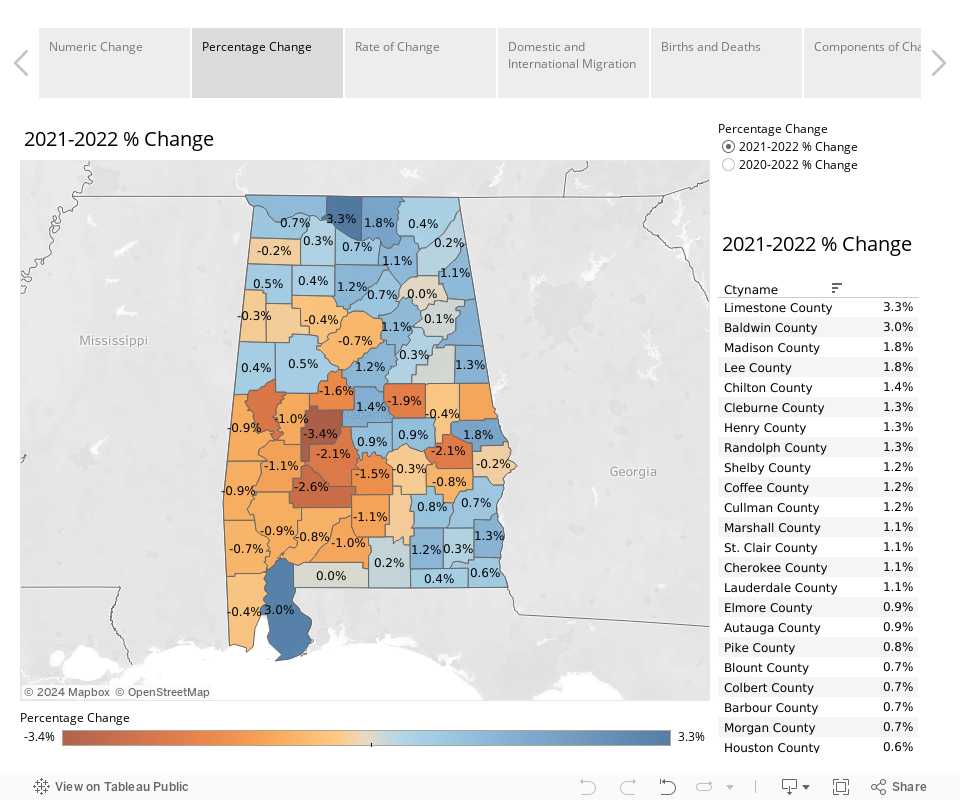
Most Alabama Counties Grew in 2022, Reversing Trend
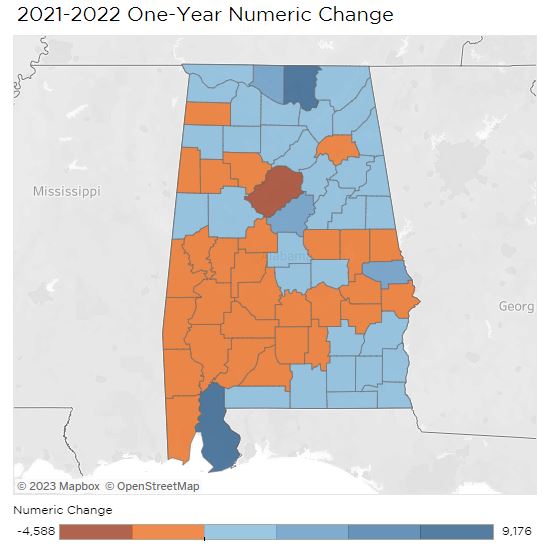
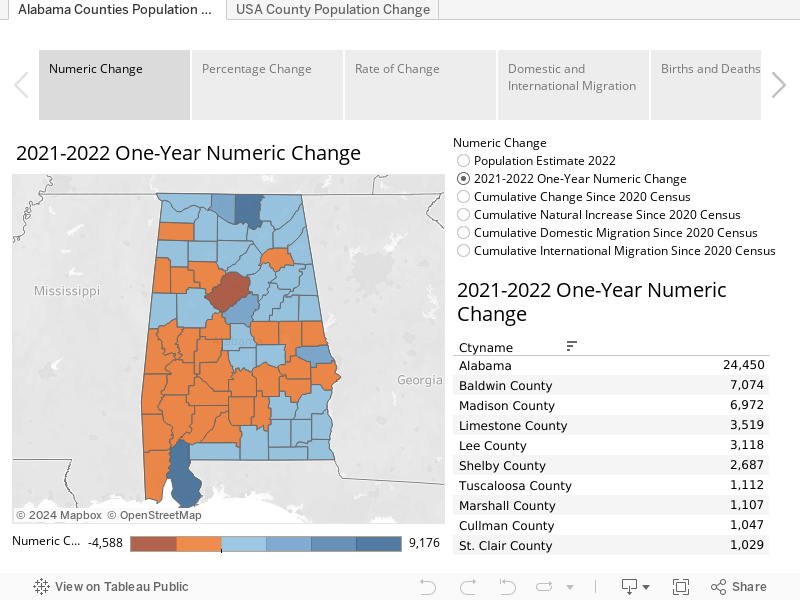
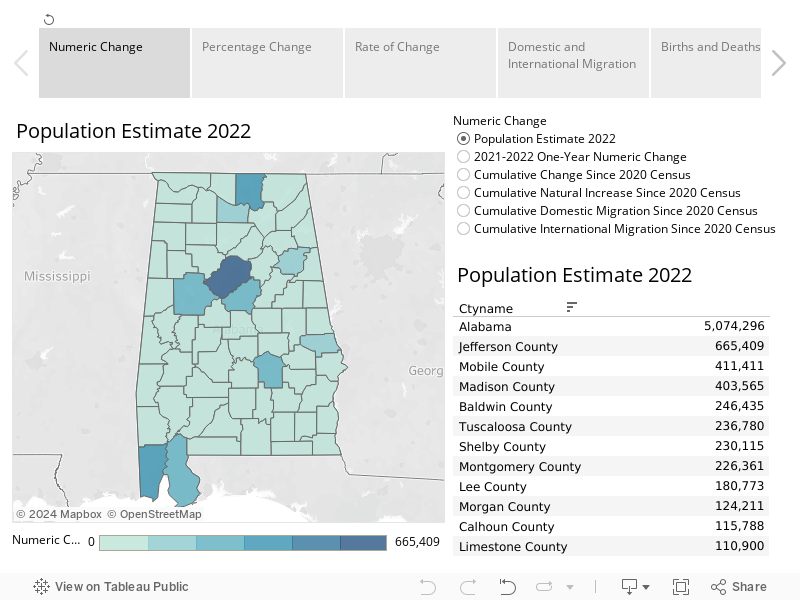
People are moving to Alabama, and according to most recent population estimates, the growth is more widespread than it has been. Out of 67 counties, 36 saw population growth between July 1, 2021, and July 1, 2022, the period covered in the latest Census Bureau release. In the prior year, only 29 counties saw positive growth. Throughout the 2010s, only 24 counties grew.
Fig. 1. Numeric Change 2021-2022
The growth is particularly noteworthy because four factors were putting downward pressure on population growth:
Death rates were still elevated in the wake of the Covid-19 pandemic
The large Baby Boom generation is entering years of increased mortality
Smaller succeeding generations have lower birthrates
International immigration is still lower than historical norms
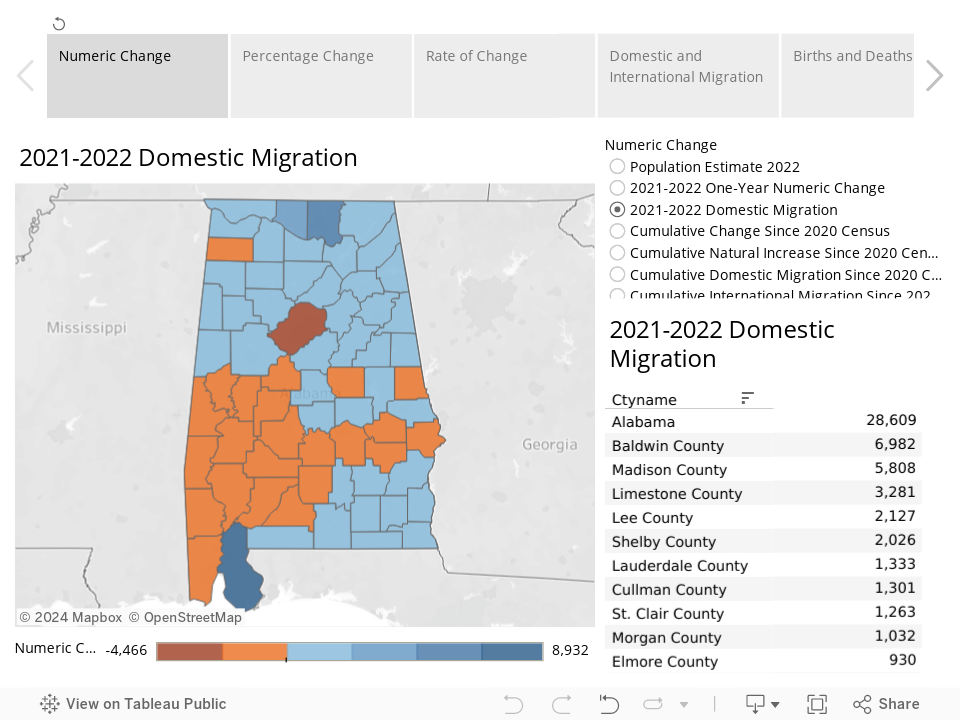
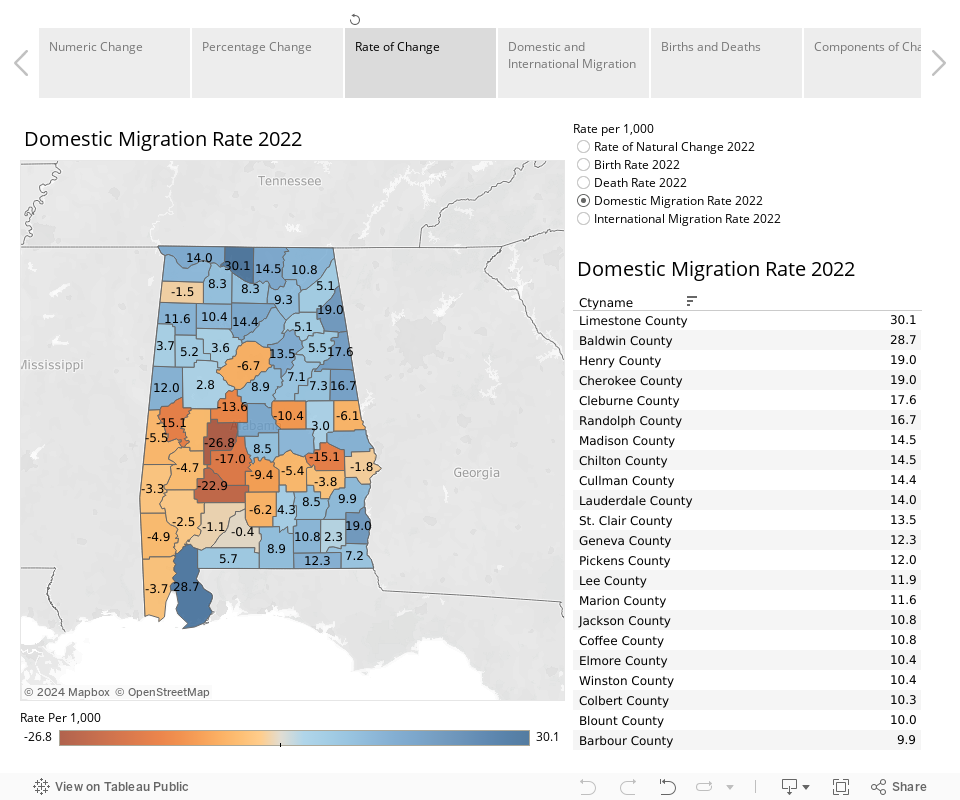
But in the counties that grew, and for the state as a whole, domestic migration — a net positive number of U.S. residents moving into the state — overcame the headwinds.
Fig. 2 Domestic Migration 2021-2022
The strongest growth was among the usual suspects: Baldwin County in the south and Madison and Limestone counties in the north, with Lee, Shelby, and Tuscaloosa counties also continuing positive growth trends. The Huntsville area’s growth continues to spread across North Alabama, with population growth accelerating in The Shoals (Lauderdale and Colbert), Cullman, Morgan, and Marshall counties.
The Wiregrass and Northeast Alabama counties also grew, including Calhoun County, which had been on an extended population losing streak. Calhoun added over 600 new residents through domestic migration for a net population gain of 111. Etowah County attracted 524 new residents, but since deaths exceeded births, the population total declined slightly, down just 55 residents.
In percentage terms, Limestone County grew the fastest. That’s likely growth not only in Athens, the county seat, but also from Huntsville and Madison, which have spread from Madison County into Limestone. Generally, counties along the Interstate corridors are growing, as well as counties bordering Tennessee, Georgia, and Florida. On the western border with Mississippi, most counties are losing population.
Urban losses
Alabama’s traditional urban centers — Jefferson, Montgomery, and Mobile — lost population, primarily due to domestic outmigration.
That population loss parallels national trends among urban counties: in the wake of the pandemic, most population centers lost population. According to the estimates, Jefferson County’s population decreased 4,588 in 2022. Since the 2020 Census, Jefferson County’s population has decreased by almost 9,000.
Rate of Domestic Migration, 2021-2022
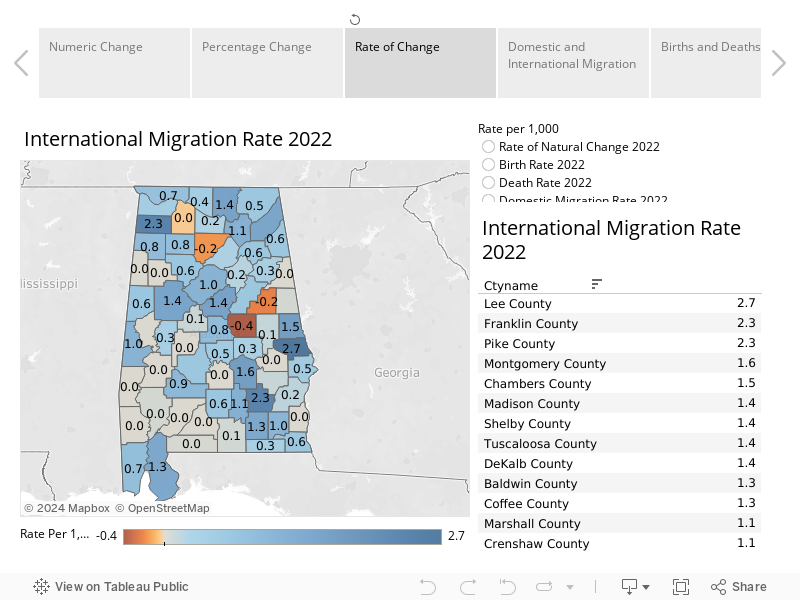
There are signs of a turnaround, though. Nationally, large urban centers began seeing population recovery in 2022. Jefferson County’s population loss was lower in 2022 than in 2021. International immigration and natural increase helped fuel population growth in urban centers elsewhere, including among Southern neighbors. Alabama’s big cities saw some population growth through international immigration. However, Alabama generally sees much lower rates of international in-migration.
Rate of International Migration, 2021-2022
Divergent Rates of Change
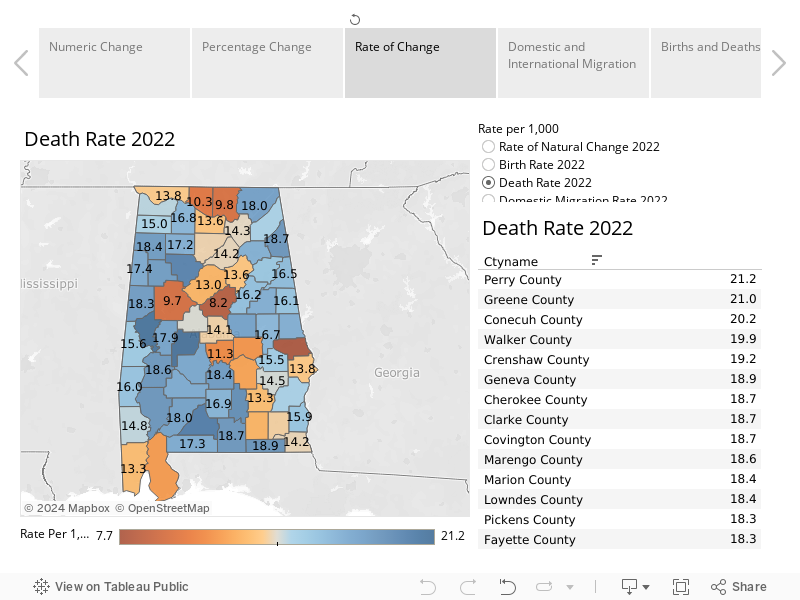
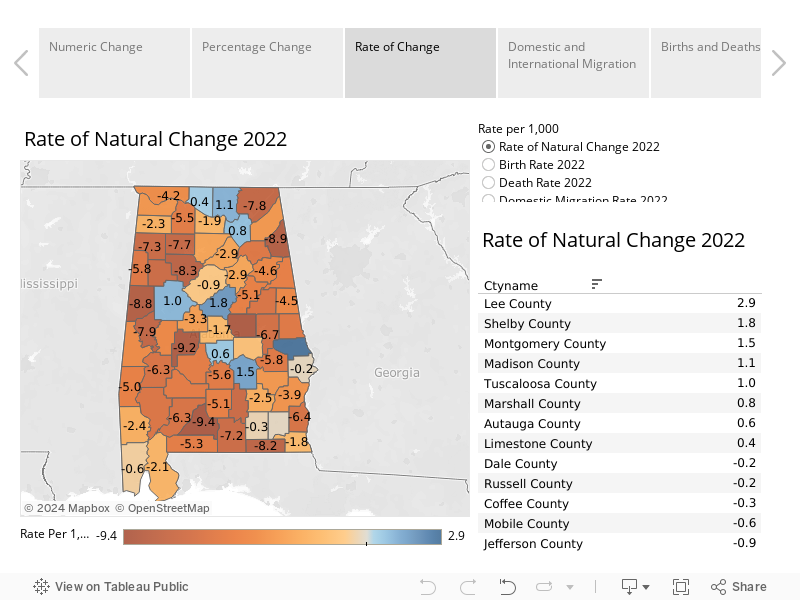
Alabama’s Black Belt and other more remote rural counties continued to lose population through residents moving away and through higher death rates. According to the estimates, Lowndes, Perry, and Greene Counties are each now below 10,000 in population, with Greene being the least populous at 7,422. Bullock, Coosa, and Wilcox are close to 10,000. Nationally, about 1,000 of the more than 3,000 counties in the U.S. have 10,000 or fewer residents.
Population Estimates, 2022, U.S. Census Bureau
In addition to outmigration, rural counties tend to have negative rates of natural change: in other words, more deaths than births. Those counties tend to have a higher median age, with a higher share of the population over 60. That’s a population that has an increased risk of death from natural causes.
Rate of Death, 2021-2021
On the opposite end of the spectrum are counties with a higher proportion of the population who are young adults or in their child-bearing years. In only eight counties have births outnumbered deaths since 2020: Lee, Shelby, Madison, Montgomery, Tuscaloosa, Limestone, Marshall, and Autauga.
Alabama’s population change is occurring in the context of national trends that are visible when zoomed out to the national level. Population losses in Alabama’s Black Belt are connected to patterns along the Mississippi River from Mississippi and Louisiana, Arkansas, Missouri, and even Illinois. Baldwin County’s growth rate has echoes along the coasts of Florida, Georgia, and North and South Carolina coasts. Huntsville’s growth sits at the edge of the mountain interior southern region stretching across Tennessee, North and South Carolina, and Northern and Central Georgia.
Who Cares About Childcare? PARCA Annual Forum, 2023
Gov. Kay Ivey identified affordable and high-quality child care as a key priority in her speech to the Public Affairs Research Council’s Annual Forum, held Friday, March 10, at the Harbert Center in Birmingham.
“Many Alabamians and others across the country face a dilemma in finding safe, reliable childcare,” Ivey told the crowd of close to 400, “As more and more Alabamians join the workforce, which is a very positive development for our state and quality of life, more working families will also be in need of childcare services. There is no better time than right now to address this fundamental need facing this state.”
Friday’s Forum featured researchers, parents, childcare providers, and employers discussing the state’s challenges in fostering an adequate supply of affordable, convenient, and high-quality care for young children and their working parents.
Below you can find the program for the event, which includes biographies of the featured speakers.
Speakers included Alison Hooper, an assistant professor of early childhood education at the University of Alabama’s College of Education, whose research has mapped childcare availability and access across the state, and Cynthia Osborne, the executive director of the Prenatal-to-3 Policy Impact Center and professor of Early Childhood Education and Policy at Vanderbilt University’s Peabody College of Education and Human Development.
Osborne’s center has developed a 50-state comparison of key policies that relate to childcare, plus statistical comparisons of child well-being and policy options for delivering additional support to children and families. That includes a summary of findings for each state, including Alabama.
Both presentations are embedded below.
UA Assistant Professor of early childhood education addresses the PARCA Annual Forum, March 10, 2023
The Forum also included a panel facilitated by Janina Nobles, Child Development Instructor and Program Advisor at Bevill State Community College. The panel included a collection of parents, a childcare provider, and an employer to provide a range of perspectives on the issues happening in childcare.
Alabama’s Population Growth Driven by Changing Factors
Alabama’s population grew faster in 2022 than in any year in more than a decade, with changing factors producing the growth, according to estimates generated by the U.S. Census Bureau.
The data, released in December, covers the period between July 1, 2021, and July 1, 2022. The Census Bureau estimates that Alabama grew by 24,450 or 0.5% over the period. That growth rate ranks No. 20 nationally and is ahead of Mississippi and Louisiana but behind Southeastern neighbors like Tennessee and the southern states on the East Coast.
Changing factors
From 2010-2017, Alabama grew slowly, with natural change (births minus deaths) and international migration (migrants arriving from another country) providing slow but positive growth.
Since then, factors have flipped. With the arrival of Covid-19, the number of deaths jumped. Natural change has gone negative, with more people dying than being born. While mortality from Covid will decline, the death rate is expected to remain elevated as the large population cohort known as the Baby Boom ages and moves into years of increased mortality.
Meanwhile, with changes to immigration policy during the Trump administration and with restrictions imposed during the pandemic, international immigration contracted. However, for Alabama, the contraction in international migration was offset by a surge in domestic migration: more people moving to Alabama from other U.S. states.
Rates of Change
As part of its data release, the Census Bureau calculates rates of change for the basic factors of population change. The rates are calculated by estimating the change and then adjusting for population.
Alabama ranks 16th in domestic migration in 2022, but 48th in international immigration.
Alabama’s birth rate was slightly above the U.S. average in 2022, but claims the 5th highest death rate among U.S. states
Conclusion
Alabama is growing, though not as fast as some of its Southeastern neighbors. Alabama’s high death rate indicates that underlying health challenges and disparities in healthcare access likely contributed to a higher mortality rate. Domestic immigration shows strength, indicating that the state is attracting new residents from other states. However, international immigration rates are lower in Alabama.
Estimates for counties, cities, and metro areas will be released later this year. Those estimates will provide further insight into where people are moving within the state and how other factors affect population change.
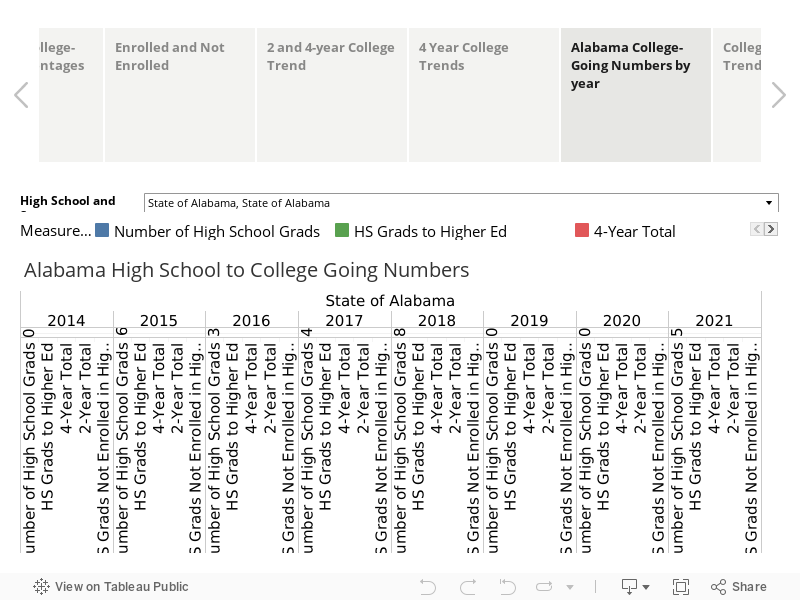
Alabama’s College-Going Rate Begins Recovery; Still Below Pre-Pandemic Rates
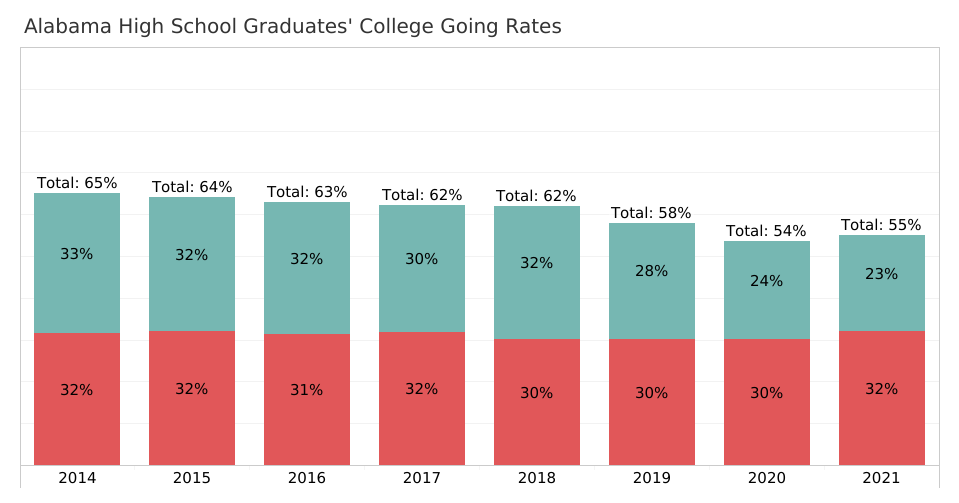
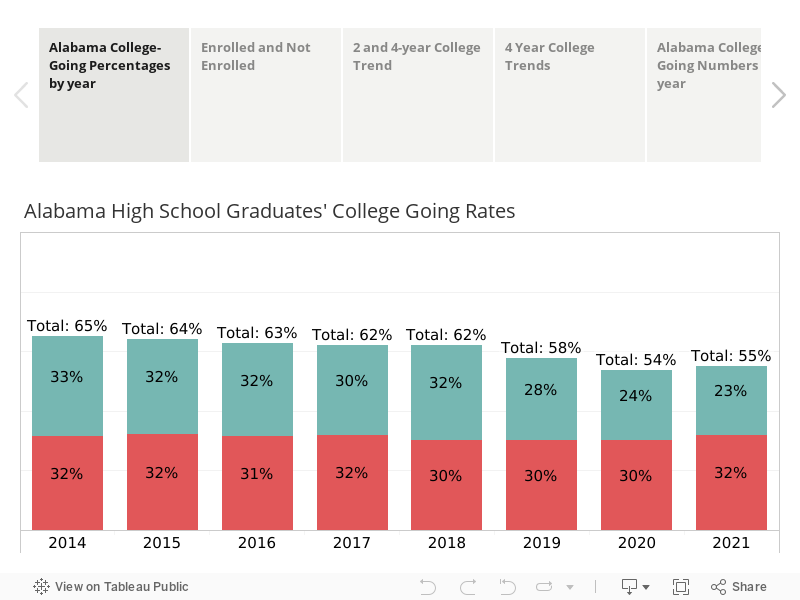
Alabama’s 2021 public high school graduates entered higher education at a slightly higher rate than the Class of 2020, according to new data from the Alabama Commission on Higher Education. However, with only 55% of graduates entering higher education the year after graduation, the 2021 rate was still much lower than in the years before the pandemic.
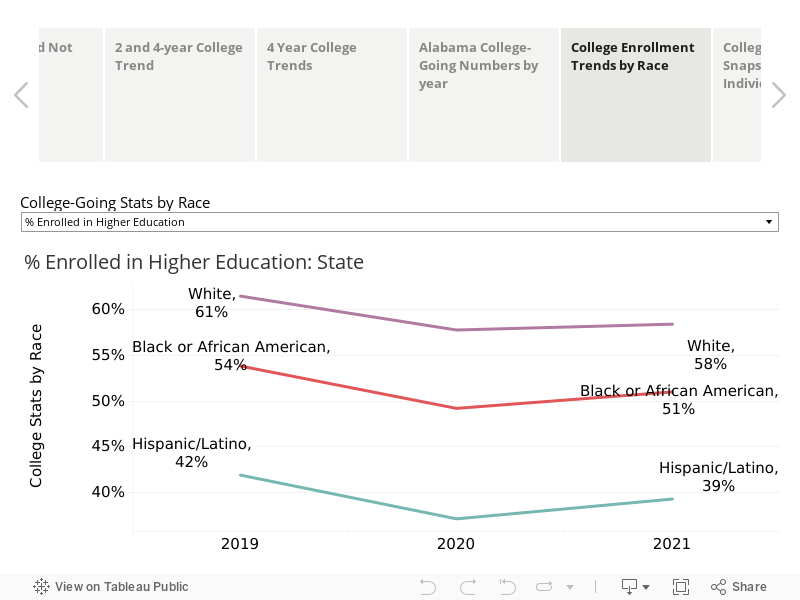
Remarkably, though, the percentage of high school graduates enrolling at 4-year colleges is tied with its highest rate on record, with 32% of Alabama high school graduates enrolling at 4-year schools. Even more notable is that the 4-year college-going rate for Black and White high school graduates was equal among the Class of 2021: 33% of Black high school graduates and 33% of White high school graduates in Alabama enrolled in a 4-year college the year after graduation. Historically, there has been a gap between the rate of enrollment of Black and White students in college.
The new data comes from the Alabama Commission on Higher Education (ACHE), the state’s higher education coordinating body. ACHE annually queries the National Student Clearinghouse of Data to check which of Alabama’s high school graduates enrolled in college, either two-year or four-year, anywhere in the country in the year following their high school graduation. Maps, college-going destinations, and rates are available for high schools and public school systems by exploring the tabs in the visualization.
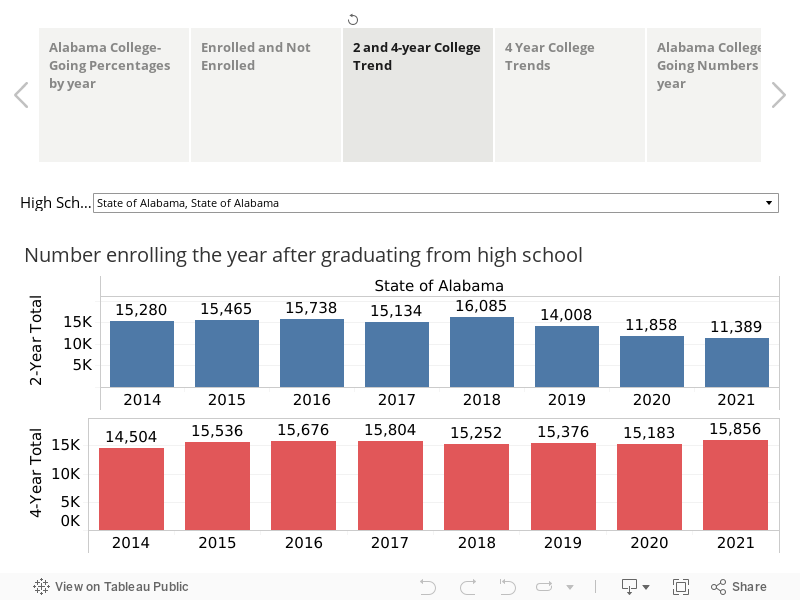
The figures for the Class of 2021 show a continuing decline in the number of recent high school graduates enrolling in two-year colleges. Only 11,389 or 23% of graduates enrolled at a community college compared to the more than 15,000 typically normally enrolled in community colleges in the years prior to 2018.
The number and percentage of students enrolling at 4-year colleges increased to 15,856 or 32% of recent high school graduates. Prior to 2019, the number and percentage of students who enrolled in four-year colleges and two-year schools were about equal.
Trends
College-going rates have been affected by multiple factors over the past decade. Between 2010 and 2020, as Alabama’s high school graduation rate climbed from 72% to over 90%, the percentage of those high school graduates going immediately into college declined. Some of those additional graduates likely lacked the academic preparation to go straight into college.
Two-Year Colleges
Also, in the current economy, demand for workers is at historic highs. Low unemployment and a strong economy typically drive down two-year college enrollment. And statistics support the idea that more high school graduates are entering the workforce rather than pursuing education. According to U.S. Census Bureau surveys, 32.6% of individuals between the age of 16-19 were in the labor force in Alabama in 2014. By 2021, 39% of 16 to 19-year-olds were in the labor force, according to Census.
The Covid-19 pandemic also disrupted college enrollment, particularly at two-year colleges. For graduates of the Class of 2020, two-year enrollment fell under 12,000, marking the lowest total since 2014, the earliest year in the dataset. And for the Class of 2021, the numbers were lower still, 11,389.
While those recent high graduates may be delaying entry to community college, other enrollees have begun to return to two-year colleges. At the height of the pandemic, overall Alabama community college enrollment dropped by 10,000, from approximately 80,000 to 70,000. Recovery began in 2021, and preliminary overall fall enrollment was above 75,000. Some students who didn’t immediately enter may now be returning to pursue a degree.
A final factor appears to have some bearing on the equation. An increasing number of high school students are also enrolled at community colleges, which is known as dual enrollment. In 2018, only 15,372 students took dual enrollment courses. By the 2021-2022 school year, 23,483 students were dually enrolled. Students taking dual enrollment classes can graduate high school with college credit, with an industry-recognized credential, or even with an associate’s degree. That will increase the chances the student will enroll at a four-year college after graduation or flow into the workforce. Those dual enrollment students aren’t captured in the college-going rate data which tracks high school graduates in the year after their high school graduation.
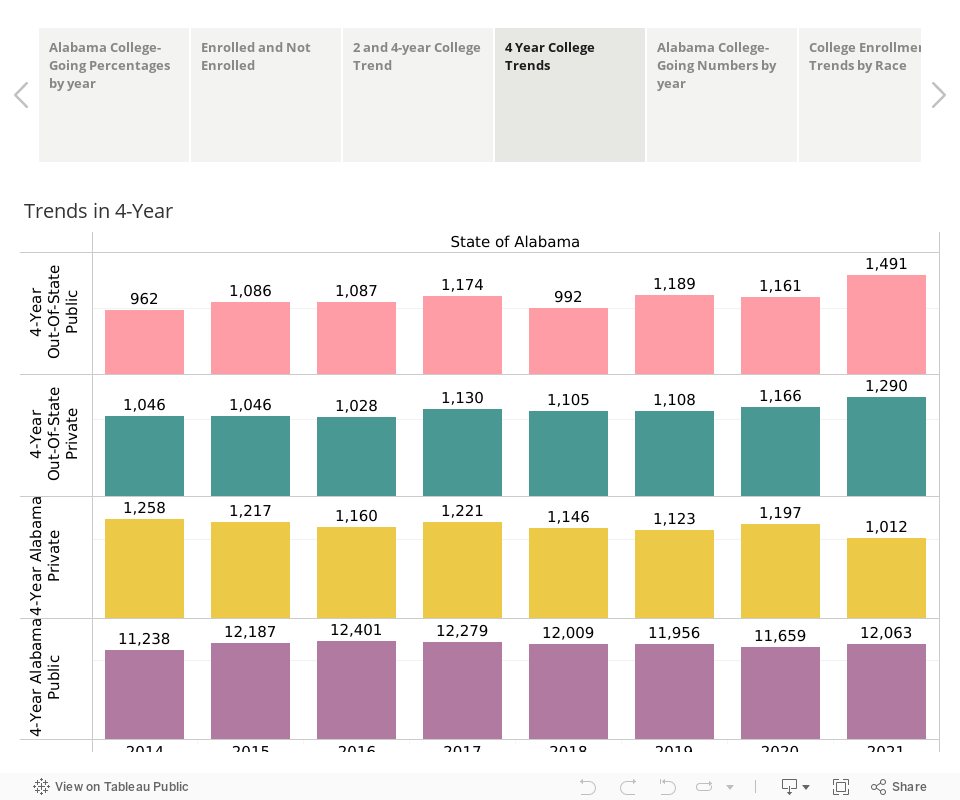
4-Year Colleges
Meanwhile, recovery was more rapid at four-year schools, with 15,856 graduates of the Alabama public high school Class of 2021 enrolling at 4-year colleges. That’s more 4-year enrollees than any year in the dataset, and it comes in a year when there were fewer high school graduates.
In terms of destination, the Class of 2021 sent more students to Alabama 4-year colleges but also increased the number of students going to out-of-state public and private schools. Enrollment at Alabama private colleges was slightly lower for the Class of 2021.
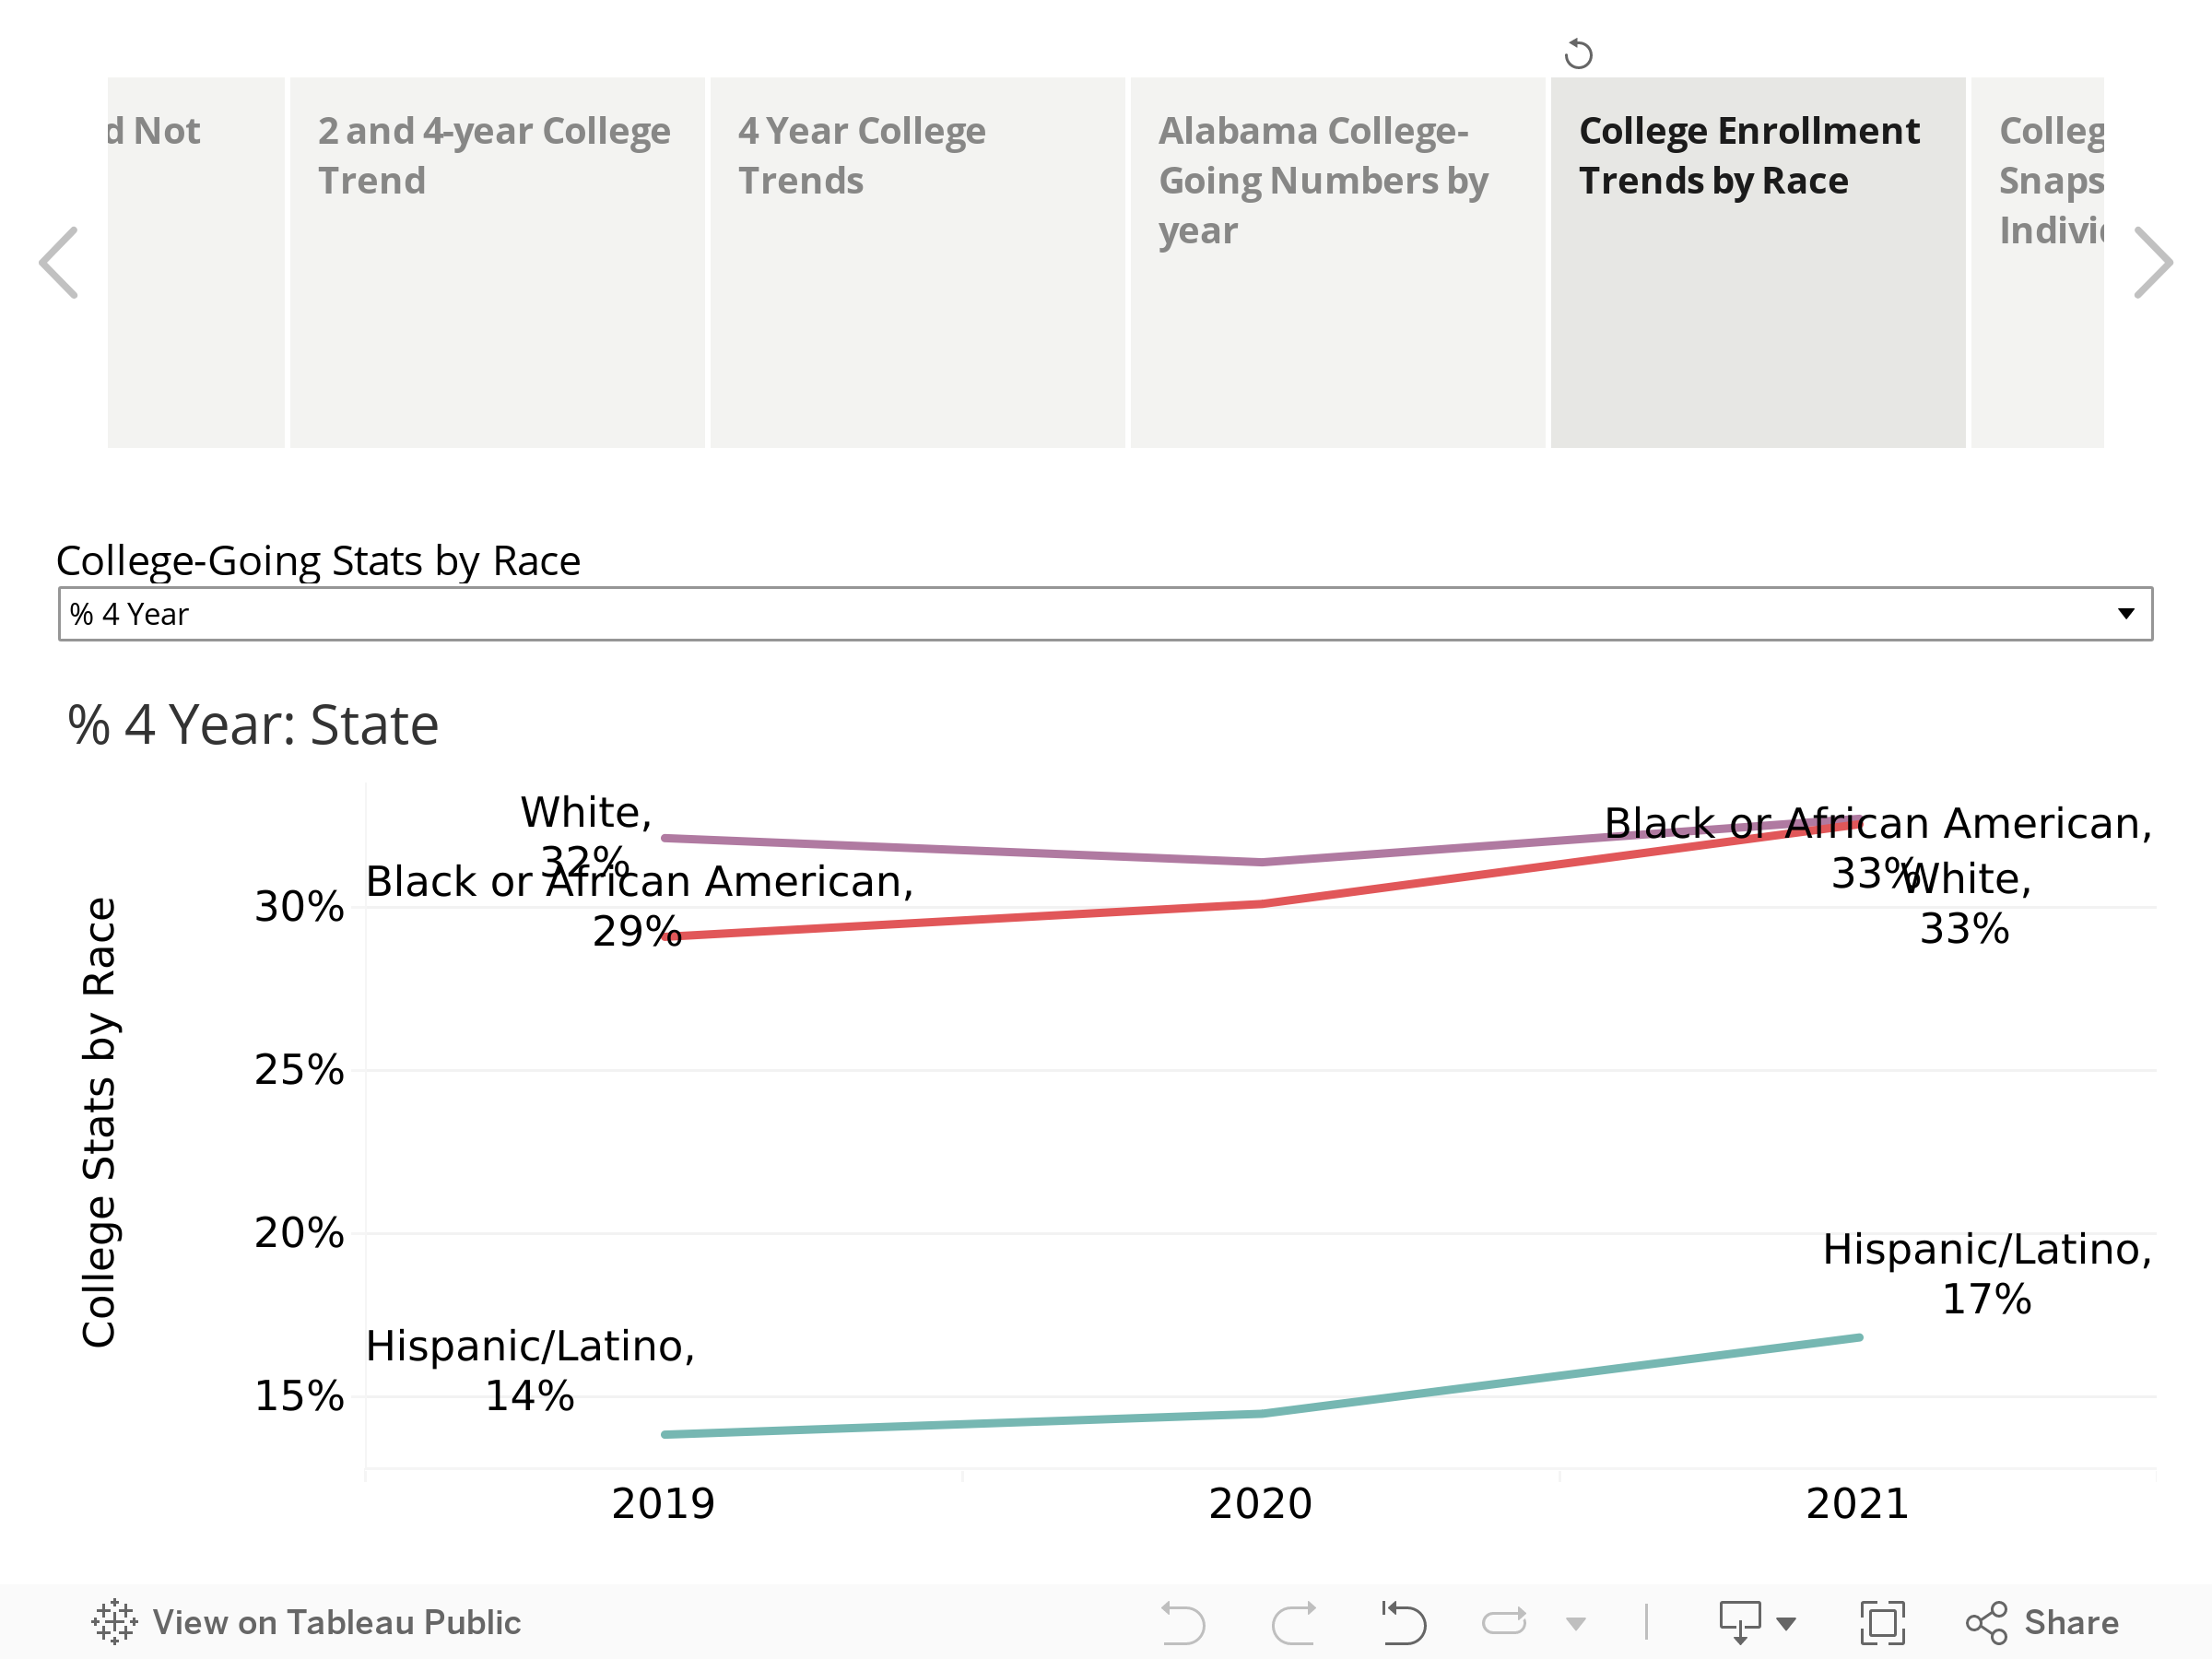
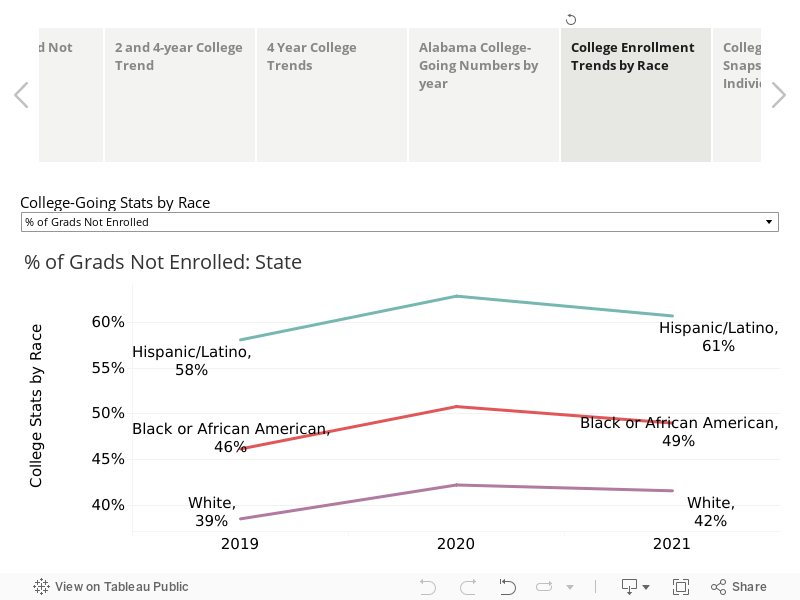
Interesting patterns emerge when college-going statistics are broken down by race. White public high school graduates are more likely to enroll in higher education than Black and Hispanic/Latino graduates: 58% of whites compared to 51% of blacks and 39% of Hispanics.
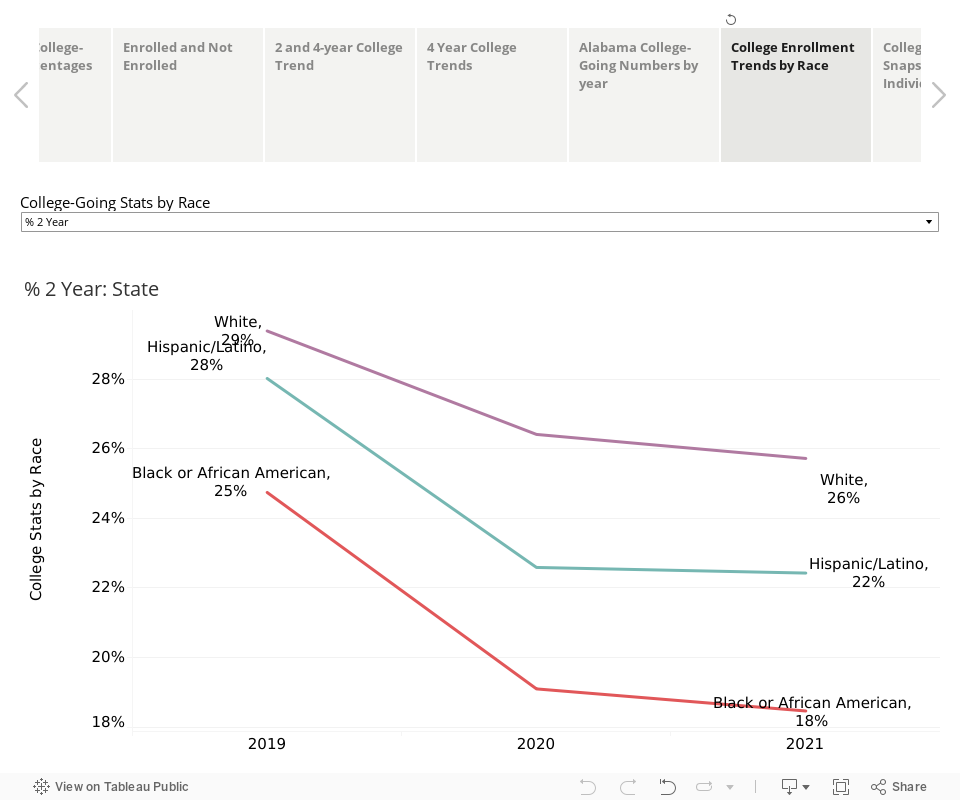
As mentioned above, White and Black high school graduates are enrolling in equal proportions at 4-year schools. But there has been a significant shift at 2-year colleges. In 2019, 25% of Black high school graduates enrolled at a 2-year school in the year after graduation. In 2021 only 18 percent did.
And among all groups, there has been an uptick in the percentage of recent high school graduates who did not enroll in college the year after graduating. According to the statistics cited above, these individuals are likely finding employment. It’s also possible that some of these high school graduates earned certificates that will allow them entry into a career with plenty of upward mobility. However, state policy should ensure these individuals have ready access to return to the education and training system if and when they need more advanced skills to pursue a more promising career path.
Demographic Change in Alabama, its Counties, and Cities, 2010-2020
Alabama’s population became more diverse over the past decade as the number of non-Hispanic Whites declined and more Alabamians identified as being of a different race, a mixture of races, or of Hispanic descent. In 2010, 67% of Alabama’s population identified as non-Hispanic White; By 2020, that percentage was down to 63%. That’s according to 2020 Census data released earlier this year.
The 2020 Census marked the first decennial census in history that either Alabama or the U.S. recorded a decline in the White population. Demographers expected a decline due to falling birth rates and the aging of the population, including the unusually large and predominately White Baby Boom population. Black, Hispanic, Asian, and American Indian populations all increased. But the biggest change was in the number of people identifying as More than One Race, indicating an erosion in traditional ethnic and racial distinctions.
The Census Bureau cautions that some portion of the decline in the “Non-Hispanic White alone” population is likely due to changes in how people responded to new wording on the race question. The Census Bureau changed the wording and presentation of the race question on the 2020 Census. In 2020, for the first time, the “White” choice was followed by example countries of origin in Europe, the Middle East, and North Africa. Similarly, the Black or African American option listed African and Caribbean nations as example origins. All respondents were asked to elaborate on their origins in a text box below their selection. This change from 2010 appears to have led more individuals to reclassify themselves as not being “White alone” but instead as being of more than one race or origin. Regardless, the Bureau believes the new totals present a more accurate picture of an increasingly diverse nation.
Nationally, the non-Hispanic “White alone” population decreased by 5 million or 2.6% from 2010 to 2020.
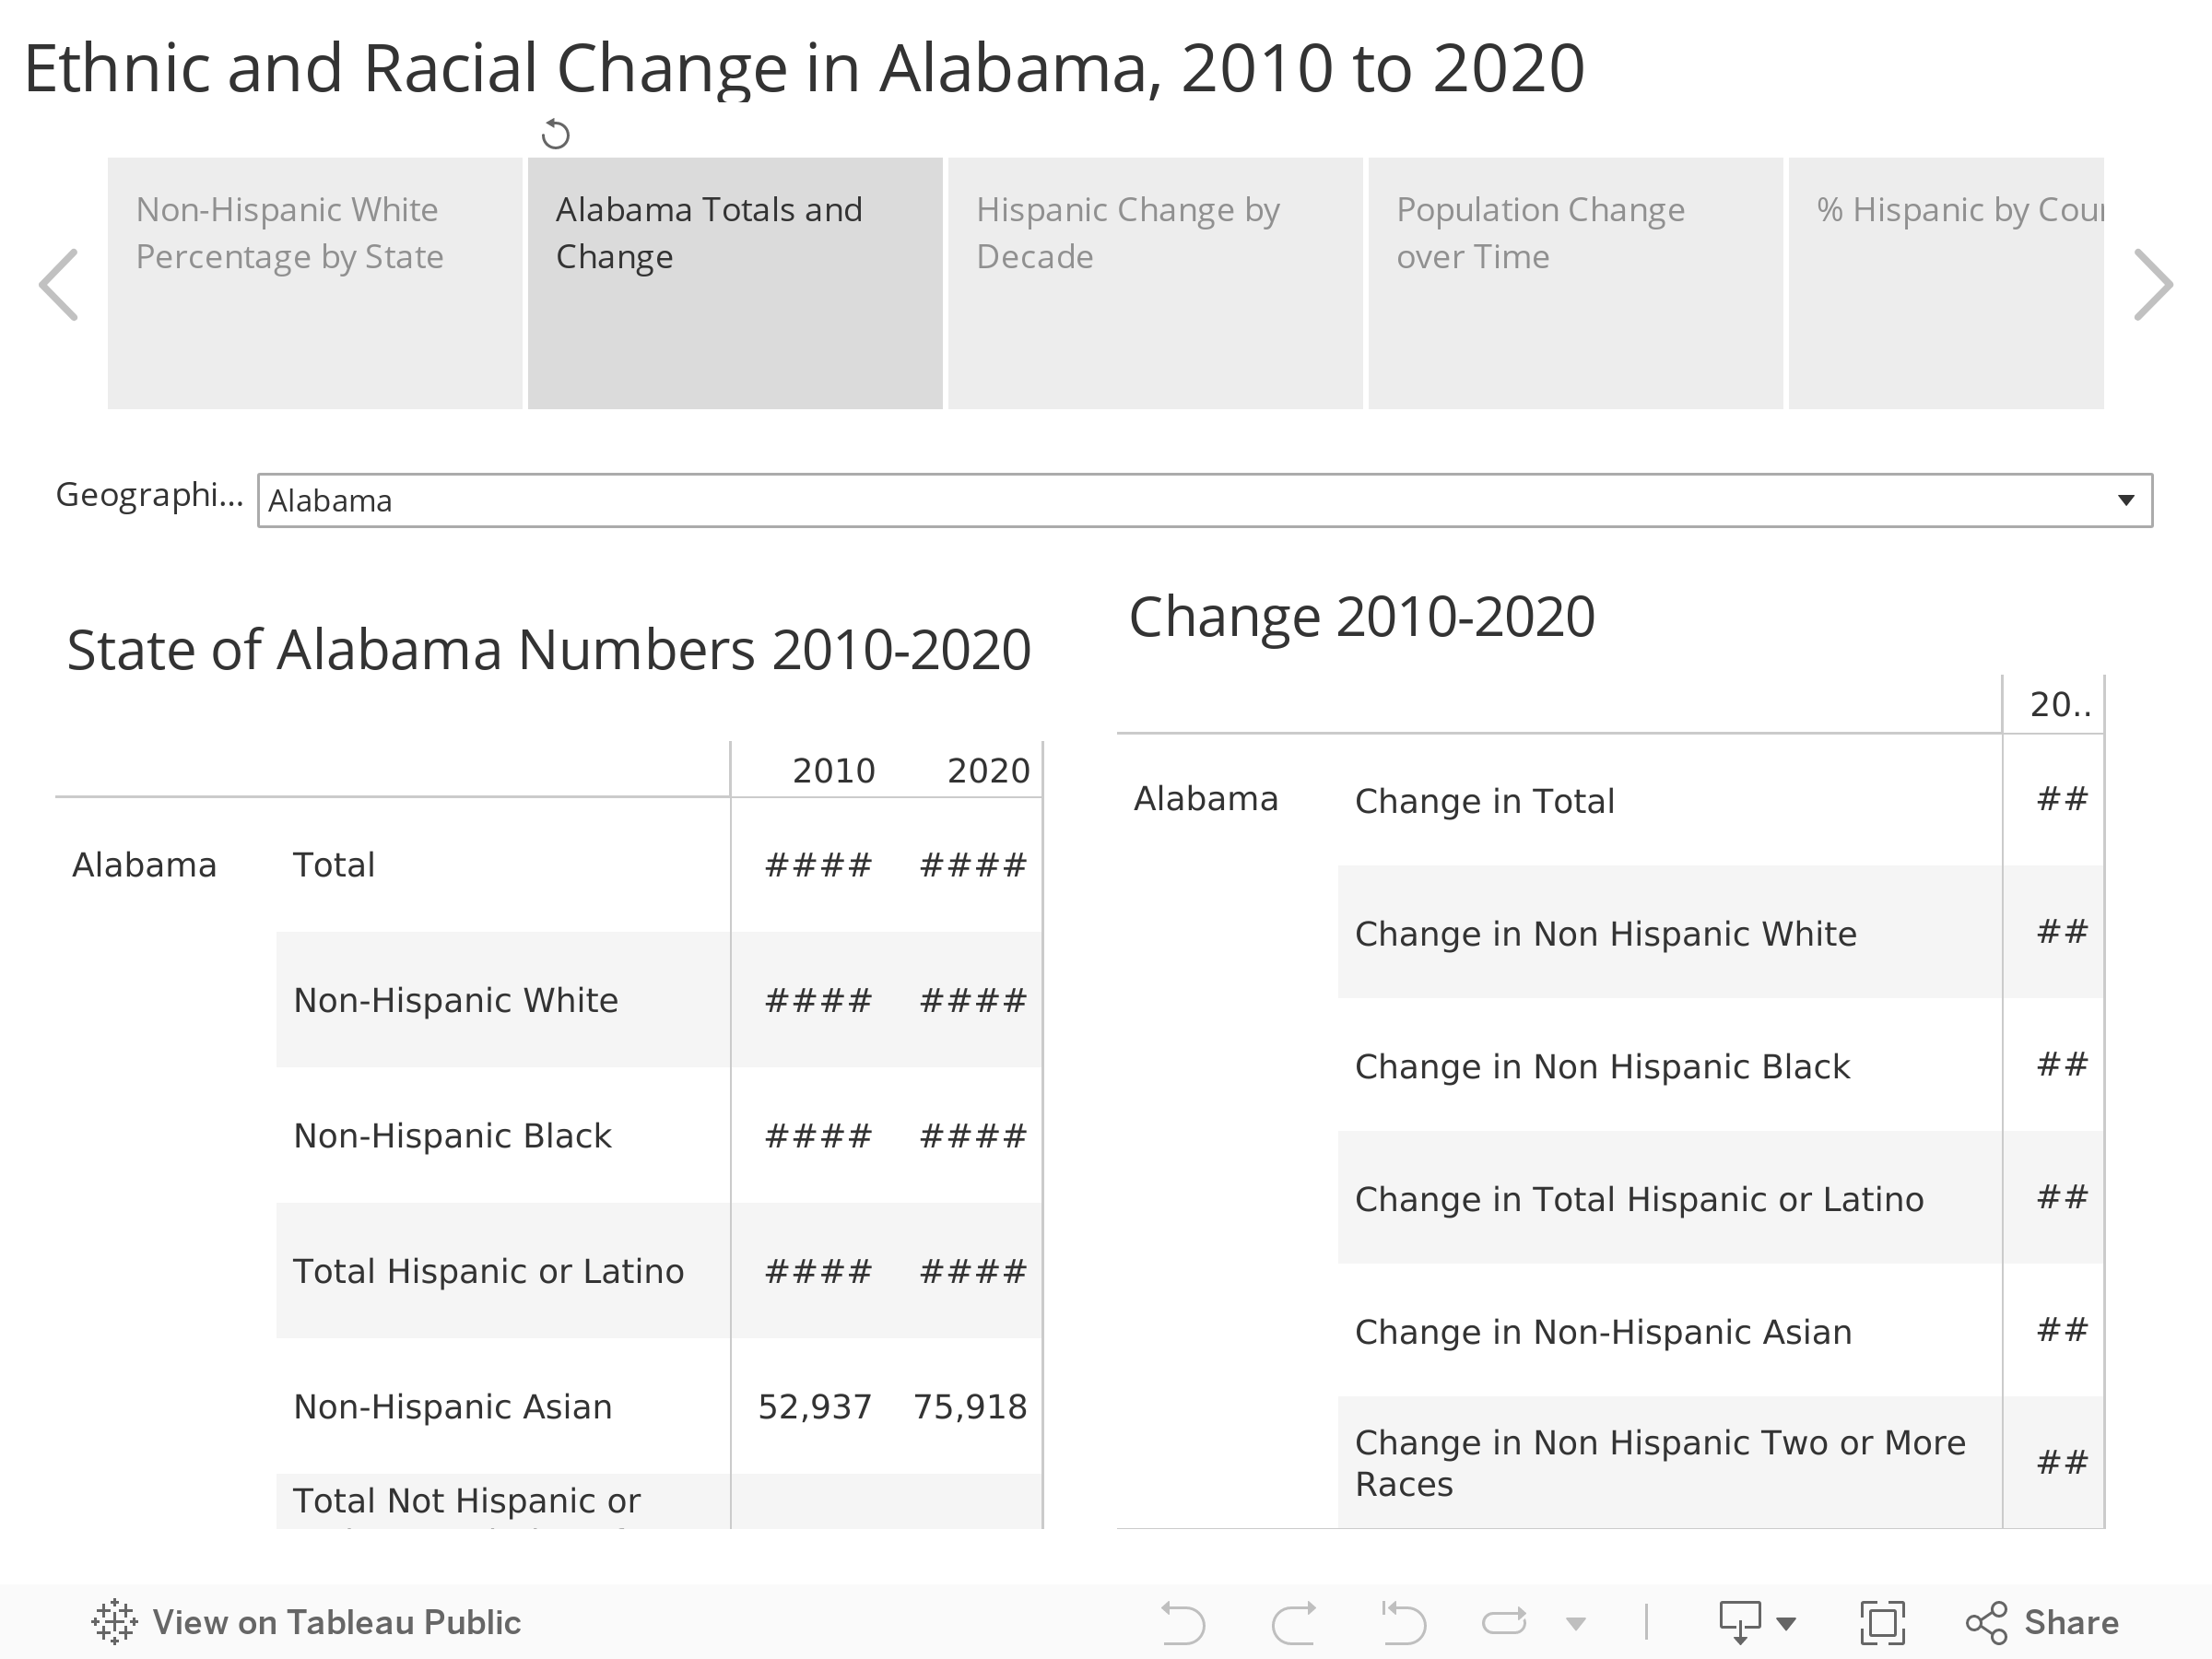
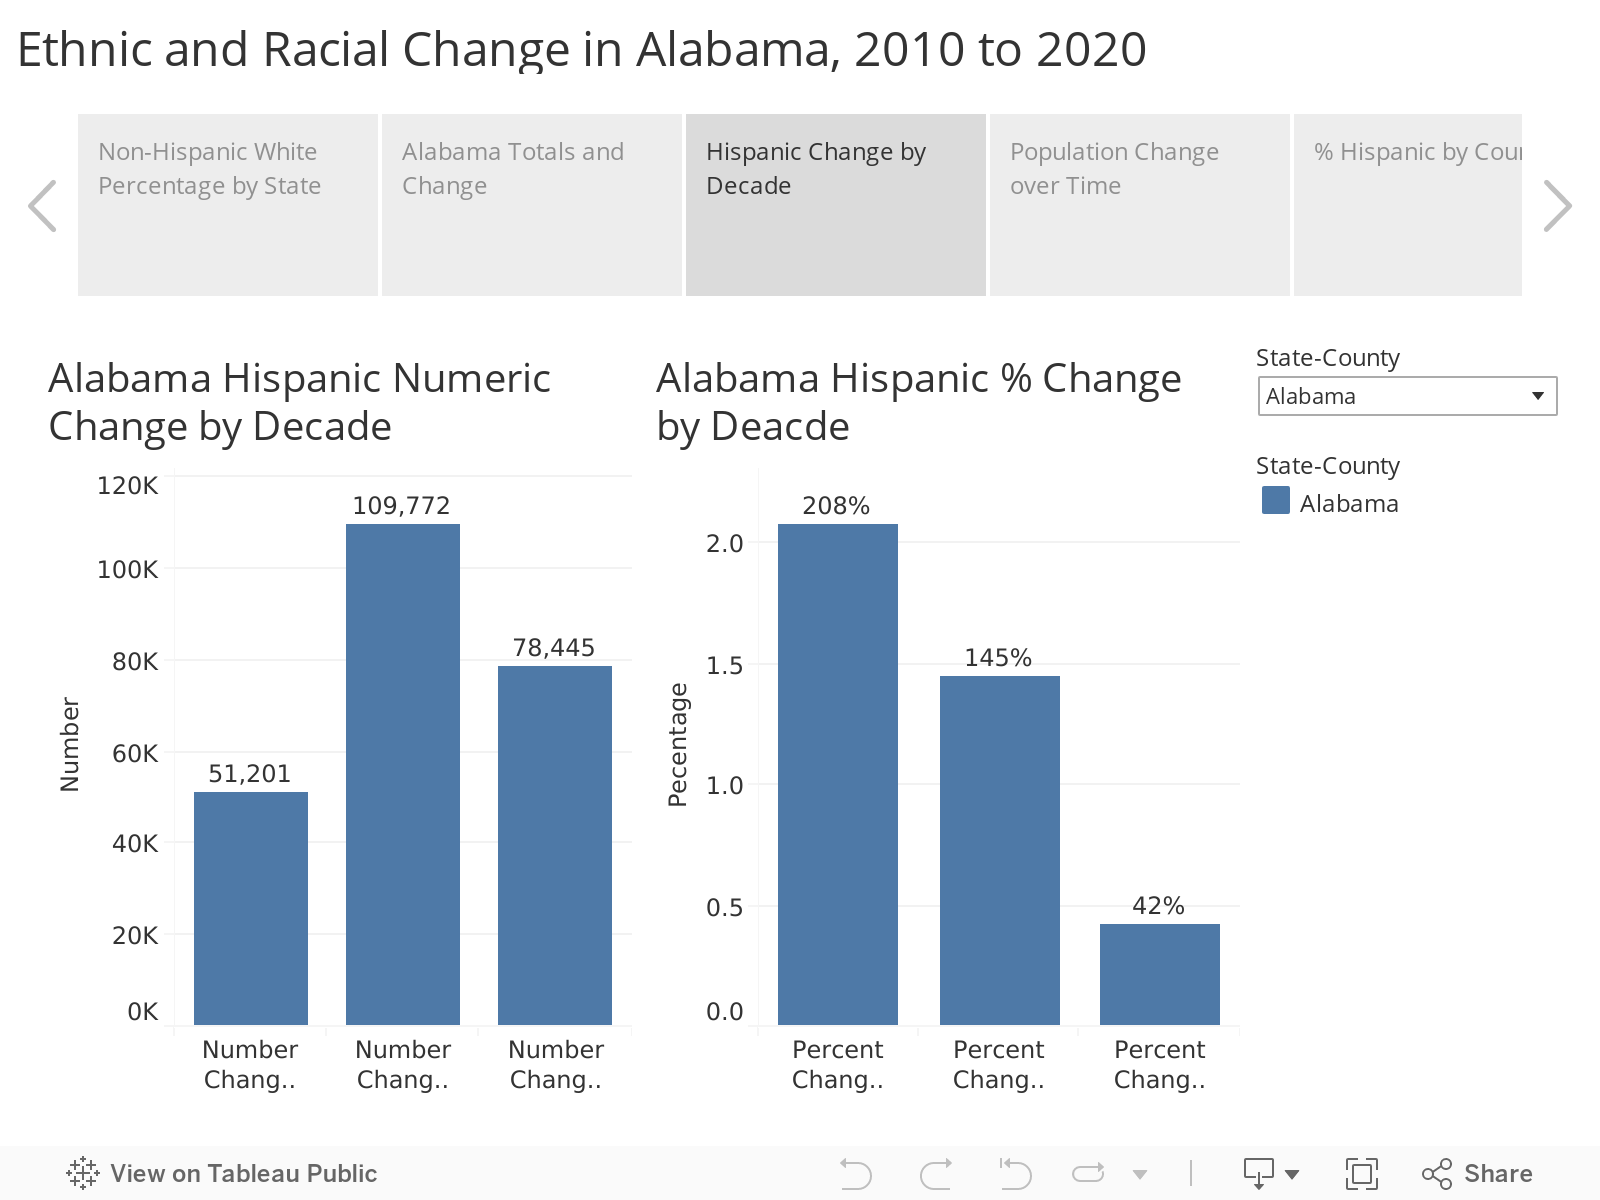
In Alabama, that population declined by 33,000, from 3.20 million to 3.17 million. Meanwhile, the number of people identifying as non-Hispanic and of more than one race far exceeded the increase in any other category, 124,173, compared to the 78,445 increase in the Hispanic population, the second fastest growing group. The number of non-Hispanic residents who reported themselves as White in combination with another race rose by 118,249, a 222% increase, from 53,260 to 171,509, from 1.2% of the population to 3.6%. The number of respondents who reported themselves as Black in Combination with another race also rose sharply, up 130% in Alabama, the third highest growth rate in the country in that category, a numerical increase of 38,767 over 2010.
Hispanics now make up 5.3% of the Alabama population, while non-Hispanic Blacks make up 25.6%. Non-Hispanic individuals of more than one race make up 3.7% of the population, now the fourth largest demographic group.
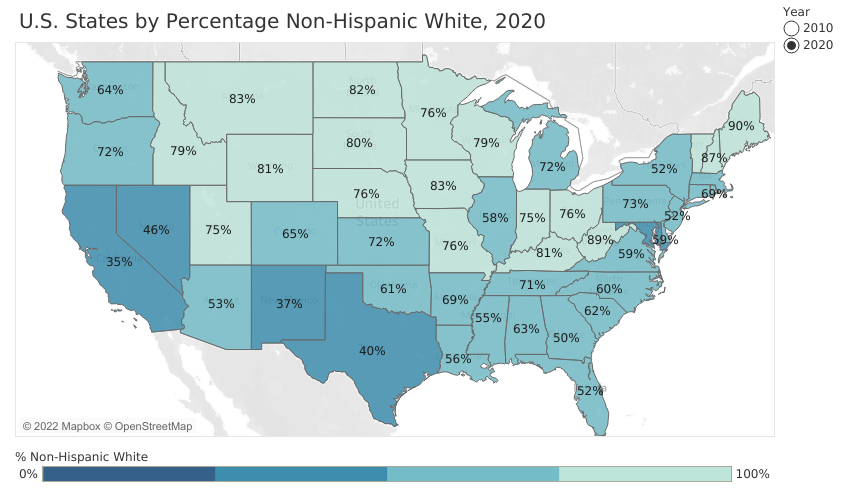
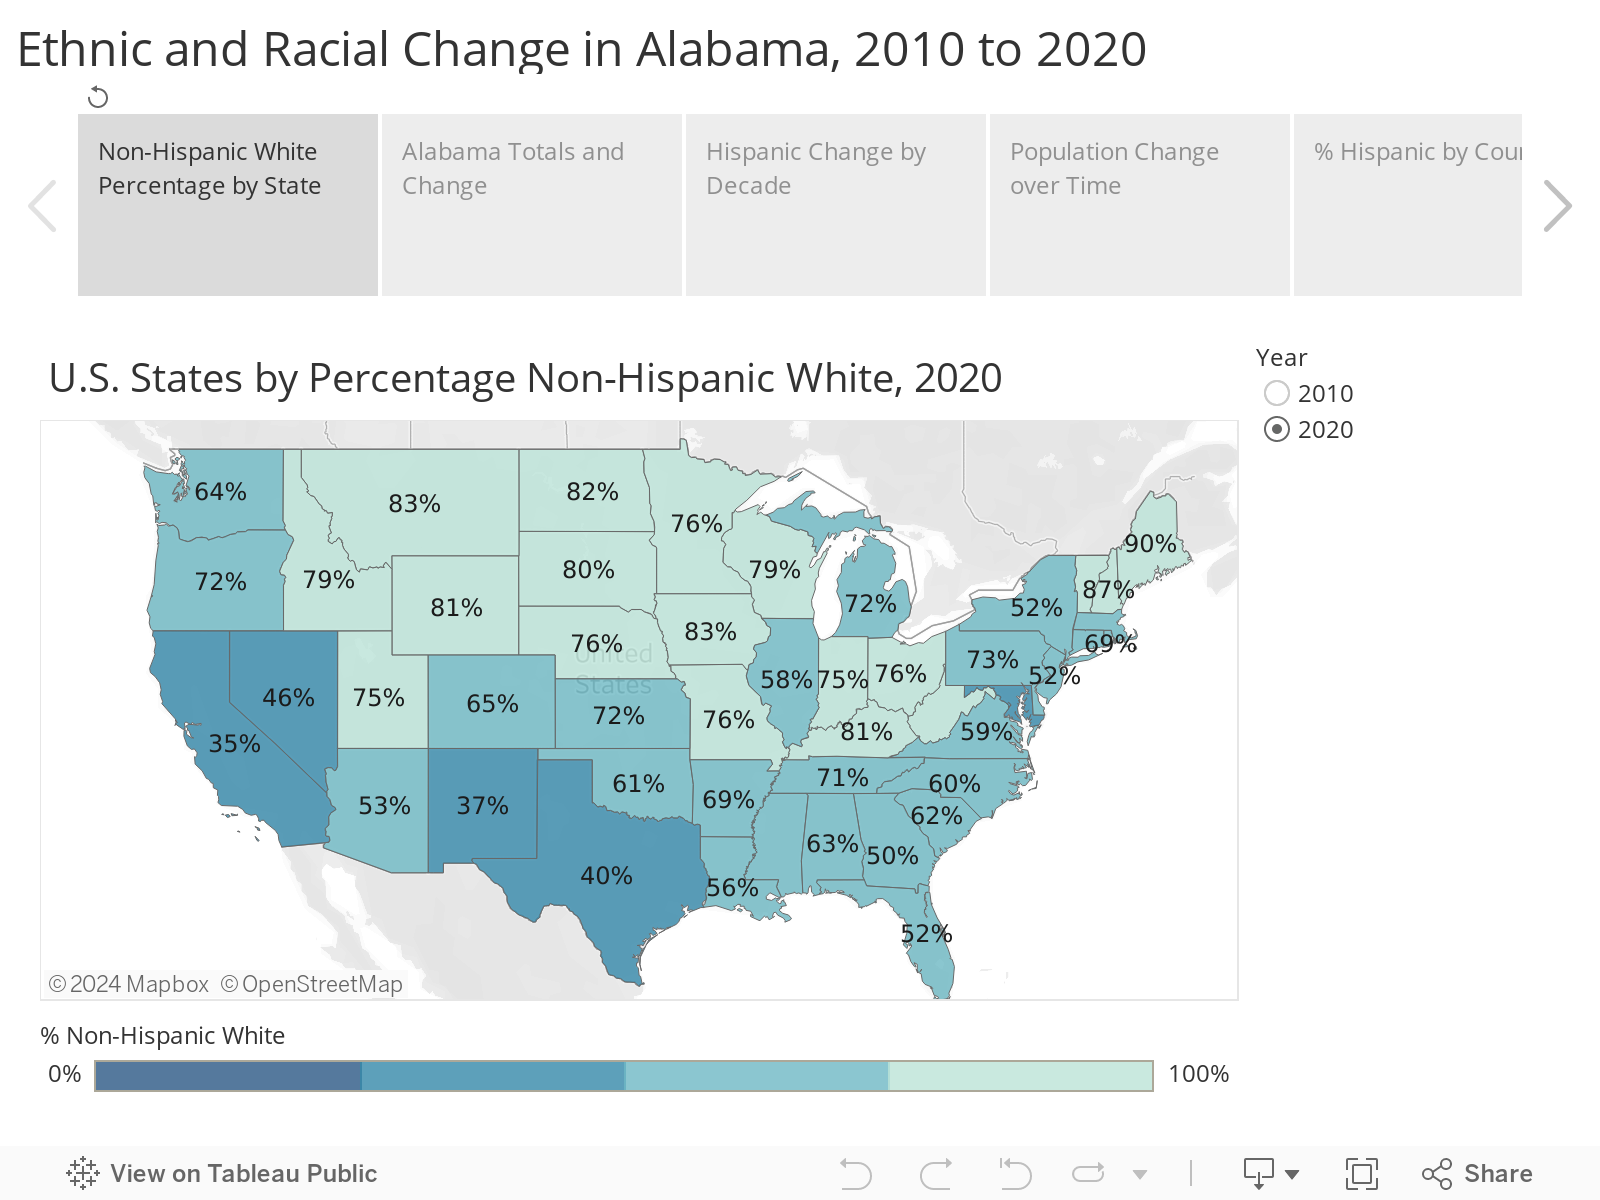
Both in Alabama and across the country, non-Hispanic whites remain by far the largest racial group representing 58% of the population nationally and 63% of the population in Alabama. Alabama’s non-Hispanic white population percentage ranks No. 30 among the states. The state with the highest share of its population identifying as non-Hispanic White was Maine at 90%, followed by West Virginia (89%), Vermont (89%), and New Hampshire (87%).
Hawaii has the lowest percentage of non-Hispanic whites, 22%, followed by California (35%), New Mexico (40%), and Texas (40%). Among its Southeastern neighbors, Georgia’s population in 2020 was 50% non-Hispanic white, while Florida’s was 52%. In all states besides Hawaii, non-Hispanic whites decreased as a percentage of the total state population.
Hispanic or Latino growth rate slows
Unlike the changes to the Census question on race, the question of whether or not the individual is of Hispanic or Latino origin has been consistent for several administrations of the Census. The official definition of “Hispanic or Latino” is a person of Cuban, Mexican, Puerto Rican, South or Central American, or other Spanish culture or origin, regardless of race.
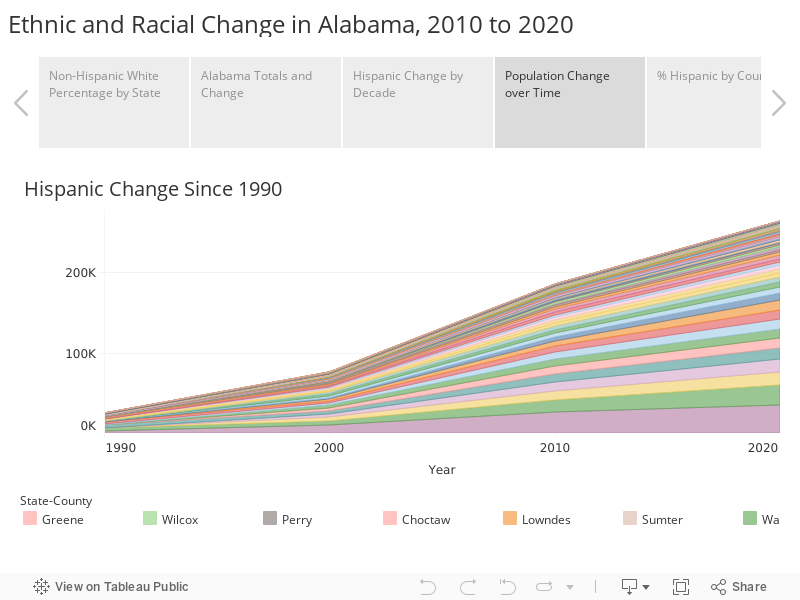
The number of Alabama residents identifying as Hispanic or Latino continued to grow between 2010 and 2020, but at a more modest pace than in previous decades. Alabama’s Hispanic population increased from 78,445 to 264,047, an increase of 42% over the course of the decade. In 2010, Hispanic or Latino individuals made up 3.9% of the Alabama population; by 2020, 5.3%.
The chart below presents decennial Census results from the U.S. Census Bureau supplemented with Census counts from the 2000 and 1990 Census analyzed by the Alabama State Data Center at the University of Alabama’s Center for Business and Economic Research.
Even without immigration, the Hispanic and Latino population will likely continue to grow more rapidly than the non-Hispanic White population because Hispanics are younger and more likely to be of child-bearing age.
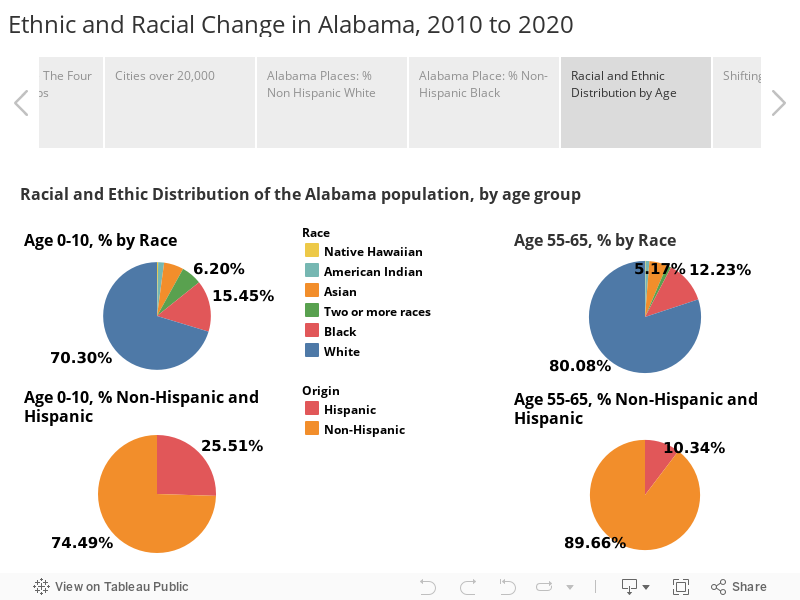
The median age of non-Hispanic Whites in Alabama is 43. The median age among Hispanics is 25. Over 8% of the Alabama population under 18 is Hispanic compared to less than 2% of the population 55 and above.
Also, Hispanic mothers have a higher total fertility rate than other demographic groups. The Total Fertility Rate is the number of births that a hypothetical group of 1,000 women would have over their lifetimes. Reducing that rate to an average per female, Hispanic females average 1.9 children over a lifetime, Blacks, 1.7; for Whites, 1.5.
Demographers calculate the replacement level, the rate of births it would take to replace any given generation, to be 2.1 children per female. Generally, since the 1970s and consistently since 2008, the U.S. birth rate has been below replacement level, meaning that, absent immigration, the population will eventually decrease because not enough children are being born to replace the previous generation.
Hispanic and Latino individuals are widely dispersed across the state, appearing in every county. Much of the Hispanic population growth likely came from natural increase, state residents giving birth, rather than new immigration. For Alabama, the Census Bureau estimated that 57% of all population growth came from natural increase, 32% from international immigration, and 11% from domestic migration.
Hispanic Population in Alabama Counties
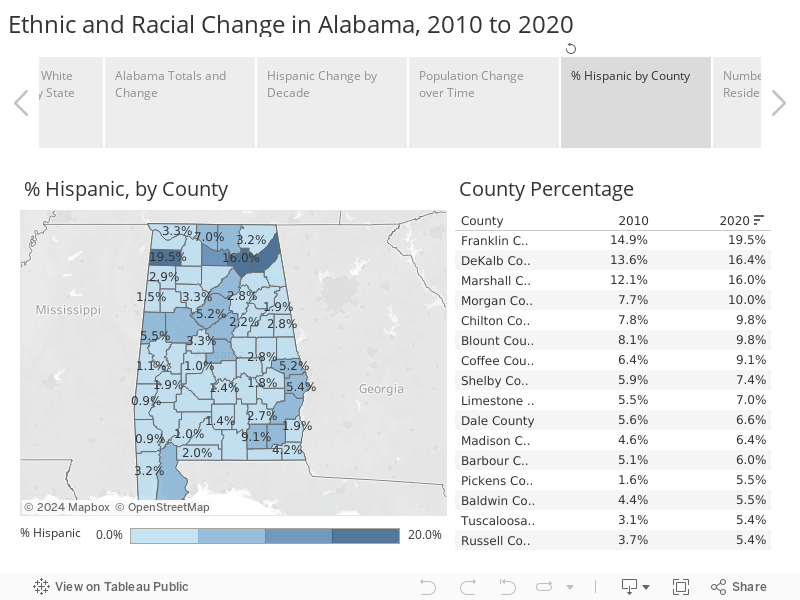
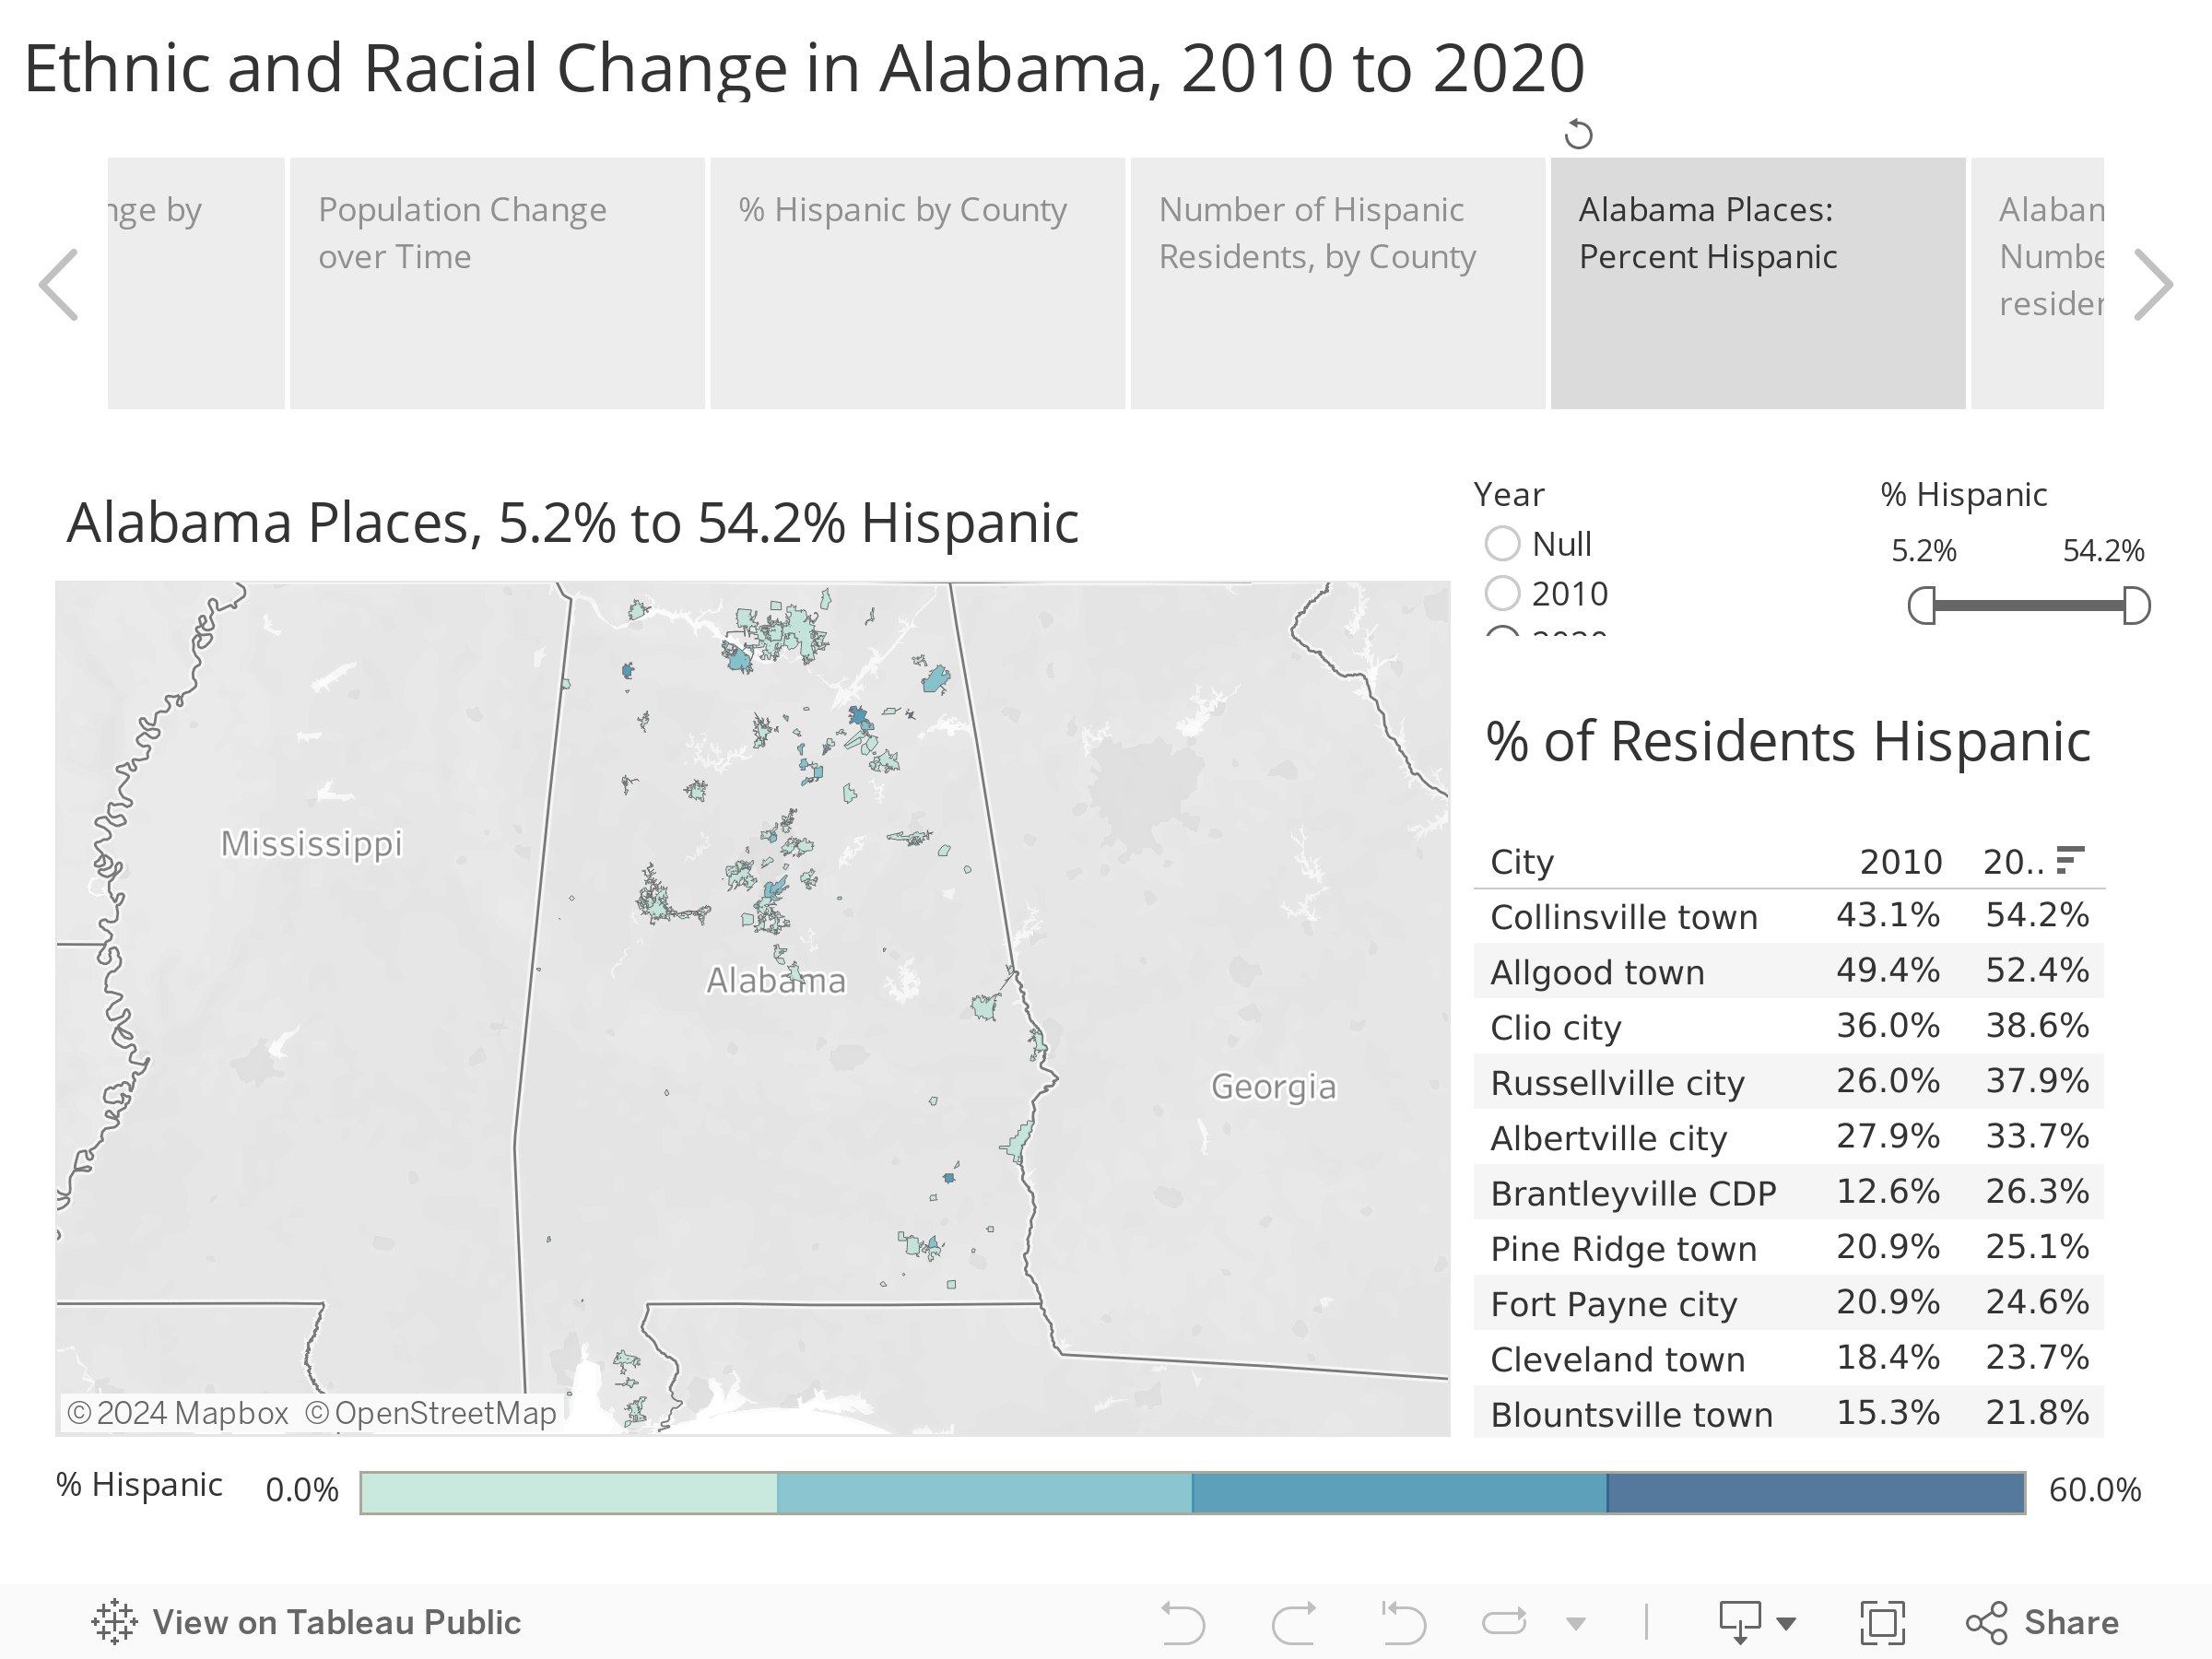
In Alabama, the counties with the highest percentage of Hispanic residents are in North Alabama, in a band stretching from Franklin County in the west to DeKalb County in the east. Those counties where the Hispanic population is most concentrated are also centers for the poultry industry, which was an initial draw for Hispanics settling in Alabama. Secondary concentrations are evident in Tuscaloosa and Pickens counties and in Southeast Alabama’s Wiregrass region. Those are also coincidental with poultry industry concentrations. Higher percentages of Hispanics can also be found in counties like Shelby, Madison, Baldwin, Lee, and Limestone, where residential and commercial construction jobs are plentiful.
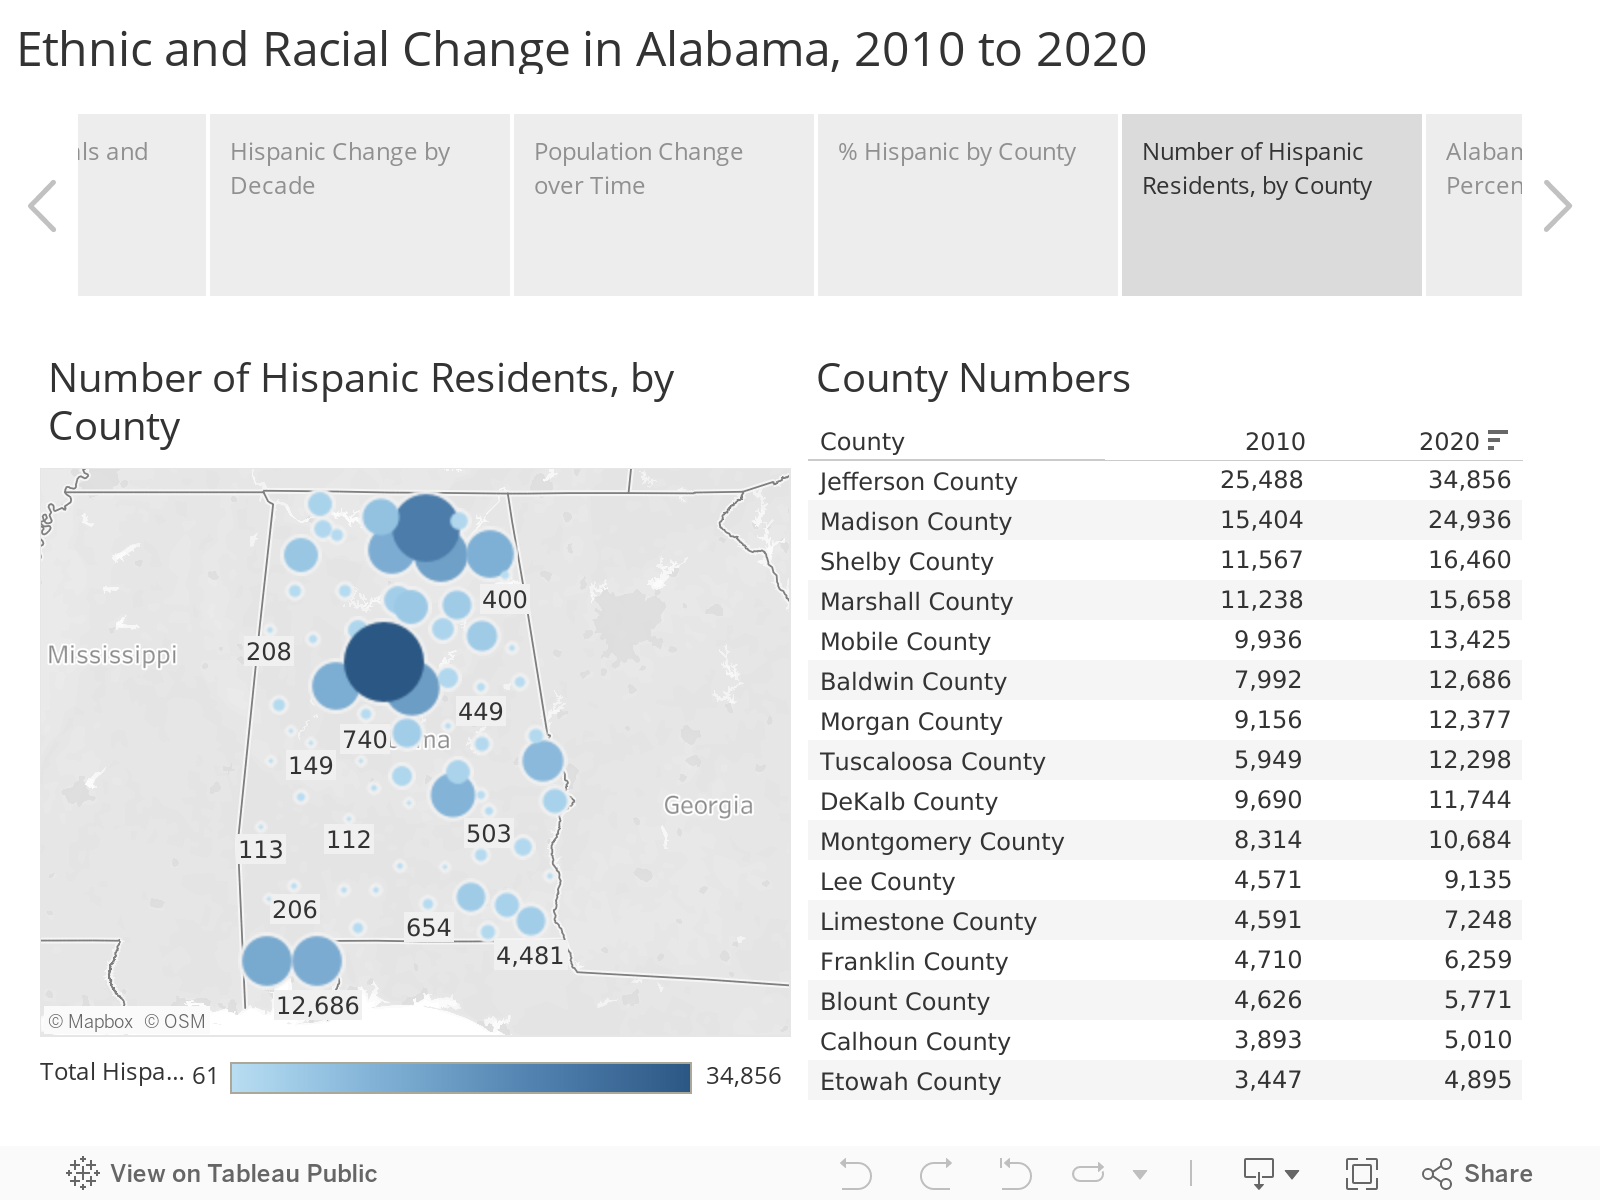
But in terms of numbers, the most Hispanic and Latino residents are found in Alabama’s more populated metro counties. Jefferson County’s Hispanic population is now nearly 35,000, while neighboring Shelby is home to over 16,000. Madison County is second in the state with almost 25,000 Hispanic and Latino residents, complemented by strong Hispanic populations in neighboring Marshall (15,658) and Morgan (12,377) counties. Madison added more Hispanic residents than any other Alabama county over the previous decade.
Hispanic Population in Alabama Places
Parallel geographic concentrations of Hispanic individuals can be seen in the population of Alabama cities, towns, and places. Alabama now has two municipalities where a majority of the population is Hispanic: Allgood in Blount County and Collinsville in Dekalb, according to the 2020 Census.
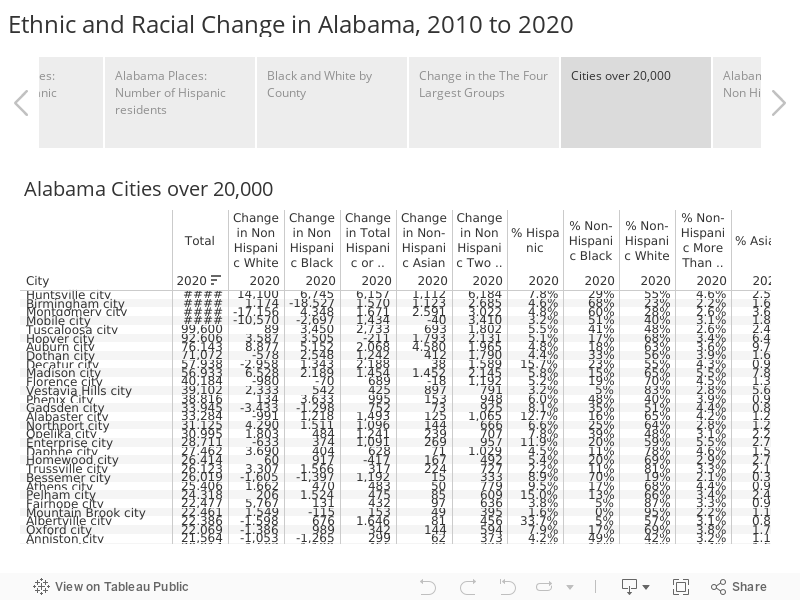
Among cities with a population of 20,000 or more, Albertville (population 22,386) has the highest Hispanic percentage of population, with the 7,545 Hispanics living there constituting 34% of the city’s population.
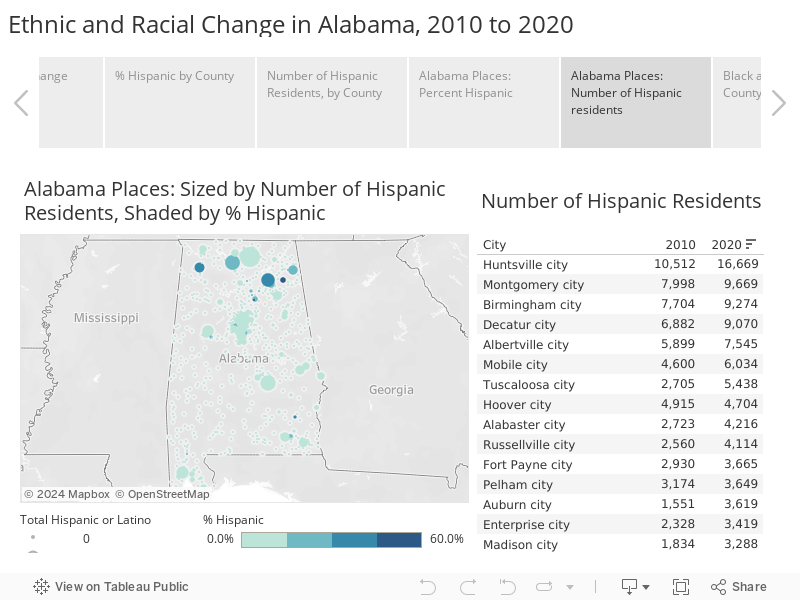
In terms of numbers of Hispanic inhabitants, the larger populations are found in the state’s big cities. Huntsville has more Hispanic residents, 16,669, than any other Alabama city, followed by Montgomery, Birmingham, and Decatur, each with over 9,000 Hispanic residents.
Near Birmingham, Hispanic communities along the Interstate 65 corridor in Hoover, Pelham, and Alabaster total over 10,000. Out of 597 Alabama cities, towns, and places, 450 saw either flat or increases in the Hispanic population. Among Alabama cities above 20,000 in population, only two, Hoover and Homewood, saw a decline in their Hispanic populations over the decade. Homewood was down by 417, Hoover by 211.
Black and White: Enduring Patterns and Subtle Changes
While the Hispanic, Asian, and multiracial populations are of interest because of their rate of change, the enduring story of Alabama is the population patterns of Black and White, a story stretching back to statehood.
The general pattern remains in Alabama: 11 counties are majority black, the south central Alabama counties of the Black Belt, named for their rich soil, counties that historically had the highest concentration of cotton plantation agriculture and enslaved persons. Those black majorities persisted after emancipation and continue today.
Greene County has the highest percentage of non-Hispanic Black population, over 80%. The most populous majority black county is Montgomery County, with over 229,000 residents, 55% of whom are Black.
Meanwhile, Winston County, in rural northwest Alabama, has the highest percentage of Non-Hispanic White residents at 92%, with Cleburne (91%), Cherokee (90%), Cullman (89%), and Marion (89%) not far behind.
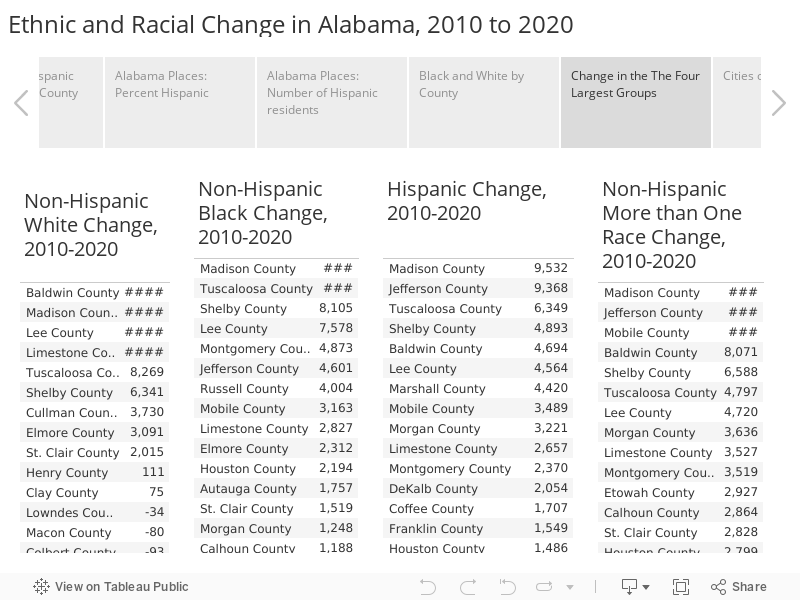
In 11 counties, the Non-Hispanic White population increased. Baldwin County saw the largest increase over the decade, with a gain of 34,000, followed by Madison, Lee, and Limestone. However, those counties all diversified as well. Blacks, Hispanics, and other groups also grew in numbers.
The counties with the most significant decline in the number of residents identifying as Non-Hispanic White were Mobile (-17,201), Jefferson (-15,961), and Montgomery (-14,745). Remember that some of that “decline” in the count may be attributed to individuals reclassifying themselves. However, those population changes in the white population correspond with overall population counts and flows that show continuing movement to suburbs located in adjacent counties.
In each of the central metro counties, the percentage of the population identifying as non-Hispanic White has declined as a share of the population as the Black, Hispanic, and other racial and multiracial subgroups increase. Non-Hispanic Whites represented 52% of Jefferson County’s population in 2010; by 2020, that percentage was 48%. Blacks make up 42% of the Jefferson County population in 2020, roughly the same percentage as in 2010. The Hispanic population grew by over 9,000, increasing from 4% to 5% of the population. The group with the biggest increase in Jefferson County was non-Hispanic More than One Race, up 12,921, constituting 3% of the population.
In Montgomery County, 38.4% of the population was non-Hispanic White in 2010; In 2020, 32%. The Black majority in Montgomery County increased from 55% to 57%. Hispanics increased by 2,370, now representing 2% of Montgomery County’s population, up from 1% in 2010. Asians 3,160, now 4% of the population, while the non-Hispanic More than One Race category increased by 3,519 and in 2020 representing 3% of the population.
In Mobile County, the non-Hispanic White population percentage went from 59% in 2010 to 55% in 2020. The Black population increased by 3,163, or 35% of the county population. The Hispanic community increased by 3,489, raising its share of the population to 3.2%. Like Jefferson County, Mobile County’s biggest growth category was in the non-Hispanic More than one race category, which gained over 10,000, making it the second most populous minority group at 3.7% of the population.
Meanwhile, Madison County’s non-Hispanic White population increased by 16,000, but its Black population grew by 16,052, non-Hispanic More than One Race population grew by 13,027, and its Hispanic population increased by 9,532. Despite the growth in the non-Hispanic White population, its population percentage decreased from 66% of the population in 2010 to 61% in 2020.
Just as whites have sought out new housing opportunities in the suburbs, Blacks make up an increasing percentage of the population in Shelby and St. Clair Counties around Birmingham and are also an increasing percentage of the population in Autauga and Elmore counties outside of Montgomery.
Meanwhile, the Black population is also decreasing in Alabama’s Black Belt,
Race in Alabama Cities, Towns, and Places
When looking at cities, some subtle shifts can be seen in the data. Birmingham, which saw decades of White flight, saw an increase in the White population but not enough to offset significant outflows of Blacks. Meanwhile, Montgomery and Mobile, which had maintained more racial balance for longer than Birmingham, saw outflows of White residents and growth in other demographic groups.
In Huntsville, populations increased across all racial and ethnic groups, though that multifaceted growth also produces a diversified population.
Birmingham
Between 2010 and 2020, Birmingham saw a modest gain in its non-Hispanic White population, with an additional 1,000 residents identifying as non-Hispanic White. Meanwhile, Birmingham’s Black population declined by almost 20,000. The city added about 1,500 Hispanic residents, and the number of individuals identifying as non-Hispanic More than One Race was up 2,685. The city saw a net decline of 11,504. Because of the shift, Hispanics and non-Hispanic Whites now represent a slightly higher percentage of Birmingham’s population. In contrast, the Black percentage of the population declined from 73% to 68%., with 23% White, 5% Hispanic, 2% More than one Race, and 2% Asian.
Montgomery
The situation was different in Montgomery. The City of Montgomery’s Black population grew by 4,348, but the White population declined by 17,000. The Hispanic population of Montgomery increased by 1,671. But the most growth came from an increase of 2,591 Asian residents and 3,022 in those reporting More Than One Race. In 2020, Montgomery’s population was 60% Black, up from 56% in 2010. Non-Hispanic Whites dropped from 36% of the population to 28%. Asians climbed to 4% of the population, just ahead of More than One Race at 3%.
Mobile
In the City of Mobile, the White population declined by 10,570, the Black population declined by 2,697, and the Hispanic population increased by 1,434. An additional 3,410 people in Mobile identify as More than one Race compared to 2010. The Black population now represents 51% of Mobile’s population, up from 50% in 2010. The White population represents 40%, down from 44% in 2010. Hispanic and individuals of More than One Race each make up 3% of the population, while Asians represent 2%.
Huntsville
Meanwhile, in Huntsville, each of the four largest groups grew: Hispanics (+6,157) and non-Hispanic Whites (+14,100), Blacks (+6,745), and non-Hispanic More than One Race (+6,184). The non-Hispanic White population decreased in its share of the population from 58% to 55%. The Black population share decreased from 31% to 29%, but the Hispanic share increased from 6% to 8%. Individuals of More than One Race increased to 4.6% of the population, while the Asian share of the population increased slightly to 2.5%.
Growth in the Asian Population
Though the Asian population in Alabama is smaller in comparison to other demographic groups, there has been notable growth in some areas.
The small fishing town of Bayou La Batre in south Mobile County is the Alabama city with the highest percentage of Asians in the population. The Vietnamese community there, established by people fleeing the aftermath of the Vietnam War, represents 20% of the city’s population. However, over the past decade, the number of Asian residents declined by 162.
Meanwhile, the Asian population has grown significantly in several communities and counties along the Interstate 85 corridor, home to Hyundai, Kia, and automotive suppliers with ties to South Korea. Auburn’s population is 10% Asian, after adding 4,580 Asian residents between 2010 and 2020. Montgomery’s Asian population increased 2,591, and neighboring Pike Road added 472 Asian residents.
The Asian population also increased in the Birmingham metro — Hoover (+1,793), Birmingham (+1,123), and Vestavia Hills ($897) — and in Huntsville (1,112) and Madison (+1,452).
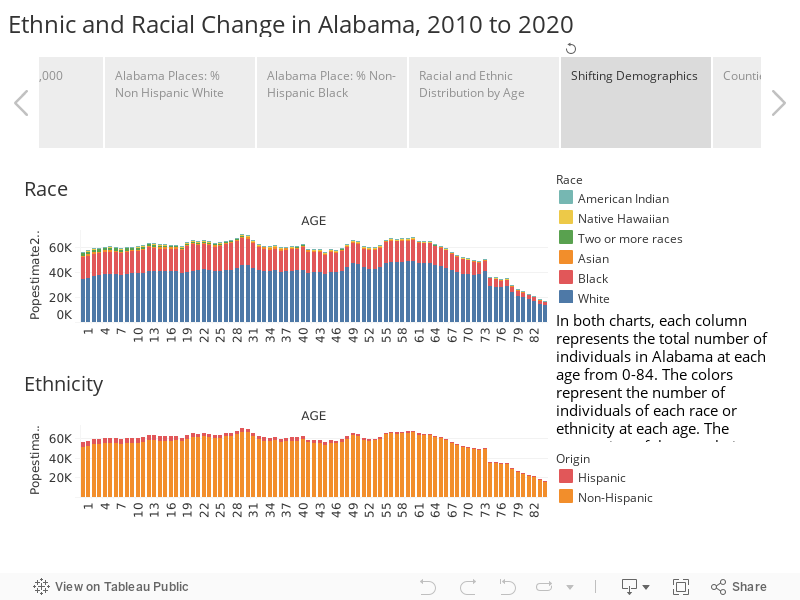
Conclusion
Alabama and the nation continue to diversify due to birth, death, and migration trends. But the statistics from the 2020 Census show that the nation is also changing through marriage and evolving attitudes toward racial identity as customs and generations change. The chart below looks at the Alabama population by age, with the population color-coded first for race and then for ethnicity. Both charts note the increasing racial and ethnic diversity in the younger population.
The shifting demographics challenge Alabama to continue progress toward common goals and increasing equality of opportunity for all.
Alabama Population Dynamics and Workforce
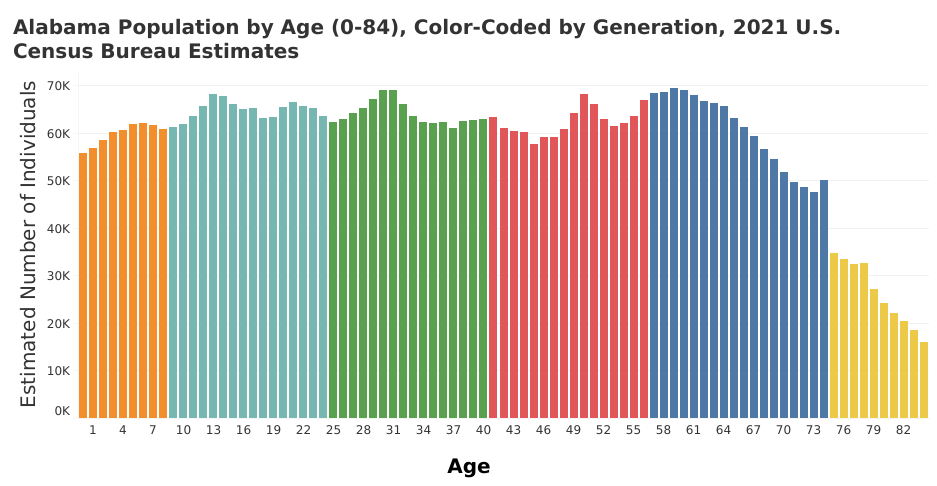
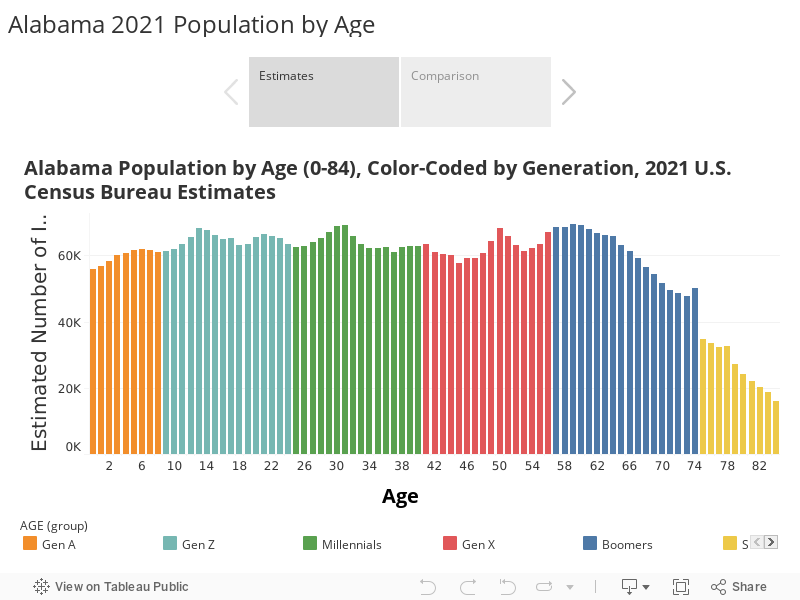
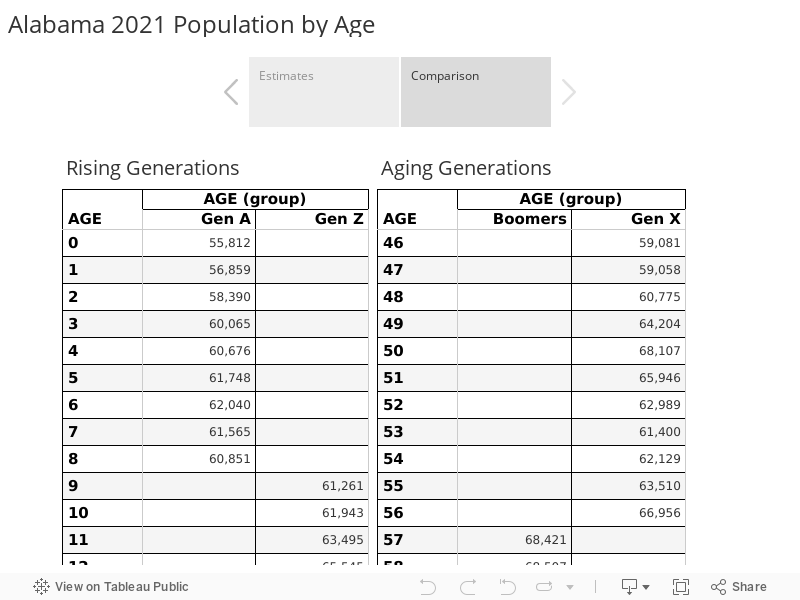
Absent immigration from other states or from abroad, Alabama’s working-age population is on track to shrink in coming years, according to a PARCA analysis of new population estimates from the U.S. Census Bureau.
(Not represented in the graphic are the more than 85,000 Alabamians the Census estimates included in the 85 and older category).
The 2021 Census population estimates by age provide a preview of the number of individuals that will join the workforce and the number that will likely be leaving it. Two factors are conspiring to create downward pressure on the working-age population:
Large numbers of aging Baby Boomers are likely leaving the workforce
The smaller rising generations, Gen Z and Gen A, will provide fewer replacements for those retiring workers.
In 2021, the Census estimates there were 65,730 64-year-olds in Alabama vs. 63,125 18-year-olds, a difference of about 2,600.
In every successive year thereafter, the number of Boomers exceeds the corresponding Generation Z cohort.
The gap widens significantly when today’s 11 and 12 years reach the age of 18. In 2008, with the advent of the Great Recession, birth rates fell. And they haven’t recovered.
Even when the Baby Boom has moved out of the prime working years, the number of potential leavers will outnumber new entrants, based on the current age structure of the Alabama population.
Considering only the current population, over the next 18 years, Alabama’s population between the ages of 18 and 64 will drop by a cumulative total of more than 50,000.
However, current residents only make up part of the story. Population growth is also influenced by migration and birth and death rates. Labor force supply is also affected by migration, by labor force participation, and indirectly by educational and skills attainment.
In terms of the natural population increase, Alabama has already seen two successive years in which deaths exceeded births. In 2021, about 8,500 more people died than were born, according to the estimates. This is due to the larger number of people moving into old age and the elevated death rates associated with the Covid-19 pandemic.
In terms of migration, changing patterns are affecting population and labor supply. From 2010-2016, most of Alabama’s population growth came through international immigration, with the state annually adding about 10,000 new residents who had been born abroad.
Since 2018, international migration has dropped, but domestic migration has increased.
In recent years, Alabama has enjoyed a net positive inflow of residents from other states, about 20,000 new residents a year from that source.
With unemployment low and demand for workers high, Alabama may continue to attract new residents through migration. But at the same time, the state is trying to increase the quality and the quantity of Alabama’s homegrown labor force:
By improving the education and training of the rising generation so that they are equipped for 21st-century jobs
By bringing Alabamians who’ve fallen out of the workforce back in
An array of state initiatives are underway to improve student preparation:
the expansion of First Class Pre-K
the Alabama Literacy Act
the expansion of Advanced Placement classes, high school/college dual enrollment, and the expansion of career technical education.
On the labor force participation front, through the Success Plus Initiative, the Alabama Workforce Council, the Governor’s Office, and an array of state agencies and participating nonprofits are collaborating on strategies to bring more people into the workforce training and education systems. The initiative seeks to address barriers individuals face to participating in the workforce and training. Through cooperation and outreach, the partners hope to reach discouraged workers and provide them pathways to high-demand fields.