In late 2017, the Public Affairs Research Council of Alabama (PARCA) surveyed Alabama voters to determine their thoughts about the general direction of the state and the issues that most concern them. PARCA partnered with Samford University to survey policy professionals from across the state including academics, journalists, business and nonprofit leaders, and lobbyists. Their responses provided a list of 17 critical issues facing Alabama. PARCA partnered with USA Polling at the University of South Alabama to ask registered voters about these 17 issues. The voters’ responses generated the Top Ten list of voter priorities. Details about the survey and its methodology can be found in the full Alabama Priorities report.
Alabama Priorities
| 1. K-12 Education |
| 2. Healthcare |
| 3. Government Corruption and Ethics |
| 4. Mental Health and Substance Abuse |
| 5. Poverty and Homelessness |
| 6. Jobs and the Economy |
| 7. Crime and Public Safety |
| 8. Job Training and Workforce Development |
| 9. Improving the State's Image |
| 10. Tax Reform |
Key Findings
- Voters broadly agree on the critical issues facing the state.
- Voters are not polarized along traditional political, ideological, racial, or generational lines. There is a significant gap between the priorities of experts and the priorities of voters.
- Policymakers have an opportunity to inform and educate voters on critical and systemic challenges facing the state.
- Policymakers have an opportunity to respond to immediate, often highly personal issues that concern voters.
- Elected officials and candidates have an opportunity to show leadership and to build broad coalitions to address Alabama’s most pressing challenges.
This summer and fall, PARCA will produce summary briefs on each of the top ten priorities chosen by Alabama voters. Each brief will answer four critical questions: what is the issue, why it matters, how Alabama compares, and what options are available to Alabama policymakers.
#2: Healthcare
What is the issue?
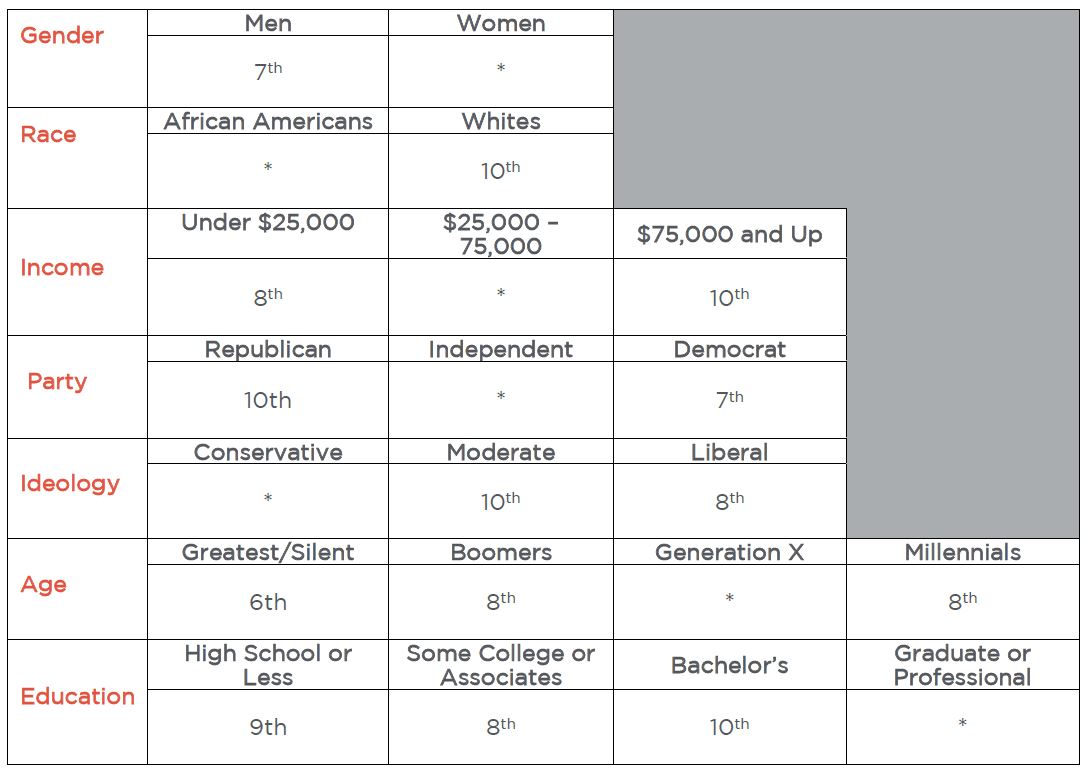
Alabama voters rank healthcare as the 2nd most important issue facing the state, with 65% of voters saying they are very concerned. Majorities of every demographic group and political party say they are very concerned about healthcare. Healthcare is the #2 issue for Democrats, #3 for Republicans, and #4 for Independents. When considering ideology, healthcare is the #3 issue for conservatives, moderates, and liberals. Healthcare is the #1 issue for low-income and middle-income voters and #4 for high-income earners. Those who are self-employed or employed less than full-time are even more likely to say they are very concerned. In this survey, men placed a greater priority on healthcare than did women. Those with lower levels of education also showed more unease related to healthcare. Finally, though there were few differences between African Americans and whites, minorities did voice a greater concern for the current state of healthcare. In a follow-up question, voters indicated their top concerns about healthcare were cost (51%), expanding Medicaid (17%), rural access (16%), and cost of prescription drugs (12%).
Why Does it Matter?
A 2017 study of state health outcomes finds Alabama ranks 42nd in primary care physician access, 43rd in cancer deaths, 44th in physical activity, 46th in frequency of physical distress, 47th in frequency of mental distress, 48th in rate of low-birth weights, 49th in cardiovascular deaths, 49th in diabetes prevalence, and 50th in access to mental health providers. These factors, along with the state’s comparatively low number of primary care providers, mental health providers, dentists, and other healthcare professionals per capita earned Alabama 47th place in the nation for overall health and well-being concerns.[1]
Why does this matter? At the individual level, health and well-being is a critical component to quality of life. At the societal level, a healthy population is a critical component of economic vitality, productivity, and reduced public expenditures. Simply put, healthy people create a healthy, vibrant economy and community.
How Does Alabama Compare?
Healthcare is a very broad topic with many aspects. This brief will explore two core concepts – healthcare coverage and healthcare access.
Healthcare Coverage
Alabamians find themselves in one of four healthcare coverage situations: 52% are covered by a commercial insurer such as Blue Cross and Blue Shield, United, or VIVA through an employer or by self-pay; 19% are covered by Medicaid, 15% are covered by Medicare, 11% are uninsured.[2]
The Affordable Care Act has helped increase the number of people with healthcare coverage. Data suggests the number of insured people under age 65 in Alabama (10% in 2016) matches the national average, but the rate trails a number of states with rates as low as 6%.[3]
Essentially, all Alabamians age 65 and over are covered by Medicare. Policymakers at the national level continuously tweak Medicare, and there are long-term concerns about the program’s viability. Medicare is not a major component of current healthcare policy debate.
In contrast, Medicaid has been at the center of the healthcare reform debate since 2010. Alabama, like 26 other states, chose not to expand its Medicaid program. However, since 2014, nine of those states have reversed course and expanded Medicaid. Three more are currently considering expansion.[4]As currently structured, Alabama Medicaid serves the visually impaired and those with disabilities, as defined by the Social Security Administration, children under 19 living in families earning less than 146% of the poverty rate, adults over 65 in poverty, and other adults, frequently for maternity services only. Save very few exceptions, Medicaid does not cover able-bodied adults, without children, regardless of their income.
Healthcare Access
Healthcare coverage does not necessarily mean healthcare access. Structural barriers like service availability and viable transportation,[6] as well as more individual barriers like job flexibility and the affordability of deductibles and copays, are critical factors in accessing healthcare, regardless of a person’s insurance status. Access to care has been identified as the number one healthcare priority.[7] Only 28 of Alabama’s 67 counties have reached an optimal level of healthcare accessibility, though these counties continue to need special outreach and services to low-income communities.[8]
Further complicating access is the number of healthcare providers. As noted above, Alabama suffers from a lack of primary care providers. The number of primary care providers is a nationwide challenge driven, in large part, by the economics of the healthcare industry – as a society, we prioritize, and thus pay more for, specialty care and treatment rather than prevention and health maintenance. Thus, there are economic disincentives to practice primary care. This helps explain why Jefferson County, the county with the highest number of healthcare professionals in the state, is cited as a Healthcare Provider Shortage Area for low-income residents with only 25 physicians providing primary care to low-income residents in the county.[9]
A second, and increasing, barrier to access is the continued closure of rural hospitals. Since 2010, six Alabama hospitals have closed, tying Georgia with the 3rd highest number of closures in the country.[10] Currently, eight Alabama counties have no hospital. Hospital economics are complex, affected by cost inefficacies, decreasing populations, changing patient preferences, state regulations, and change to federal reimbursement structure.
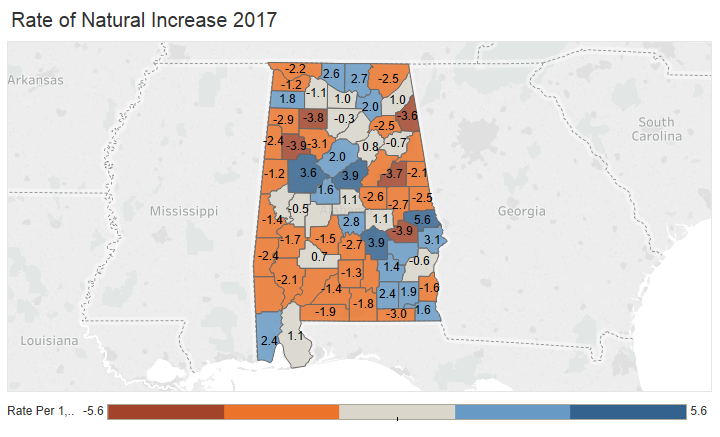
How Do Alabama Counties Compare?
When Alabama counties are compared, there is considerable variation in essentially every health statistic. Comprehensive county comparisons can be found at http://www.countyhealthrankings.org/app/alabama/2018/overview. While Alabama’s overall uninsured rate was 12% in 2015, the rate ranged from a low of 8% in Shelby County to 18% in DeKalb County. Uninsured rates among minorities in Alabama is between 10% to 28%.[11] There is also considerable variance in healthcare access. The ratio of primary care providers to population ranges from 1:10,461 in Lowndes County to 1:940 in Jefferson County. Nationally, the ratio is 1:1,030. A majority of Alabama counties, 39, had ratios greater than 1:2,060.[12]
When considering outcomes, Shelby County enjoys the highest health outcomes and health factors rating, followed by Madison, Baldwin, Limestone, Colbert, and Lee counties. Shelby County reports the highest in lifespan, quality of life, and access to clinical care. Wilcox County ranked lowest in lifespan, Greene ranked lowest in quality of life, and Conecuh ranked lowest in access to clinical care.[13]
What Can We Do?
Alabama has much room for improvement in healthcare. Robert Wood Johnson’s County Health Ranking and Roadmaps[14] lists several hundred policy recommendations across a broad range of healthcare topics, including access, outcomes, and behaviors. Recommendations can be searched by population, geography, decision maker, and more. This resource, along with community health assessments prepared for the state and each county every five years provide a wealth of recommendations for state and local policymakers.
Changing health outcomes is not easy, but it is not impossible. States like Florida and Utah were able to achieve meaningful change in just one year, changes that resulted in their national average improving by four positions.[15] By improving health behaviors, clinical access, community and environment, and policy, Alabama could see similar changes.
Drafted by Cassidy Clevenger, graduate student, Department of Social Work, Samford University, and the staff of the Public Affairs Research Council of Alabama.
Read the full PDF Healthcare brief here.
[1] America’s Health Rankings Annual Report 2017, (2017) United Health Foundation. https://assets.americashealthrankings.org/app/uploads/ahrannual17_complete-121817.pdf.
[2] “Health Coverage: State-to-State: 2017,” America’s Health Insurance Plans, https://www.ahip.org/wp-content/uploads/2017/10/StateDataBook_2017.pdf.
[3] “Health Insurance Coverage of Nonelderly 0-64.” (2018) Kaiser Family Foundation. https://www.kff.org/other/state-indicator/nonelderly-0-64/?currentTimeframe=0&sortModel=%7B%22colId%22:%22Location%22,%22sort%22:%22asc%22%7D.
[4] “Status of State Action on the Medicaid Expansion Decision” (September 11, 2018) Kaiser Family Foundation, https://www.kff.org/health-reform/state-indicator/state-activity-around-expanding-medicaid-under-the-affordable-care-act/?currentTimeframe=0&sortModel=%7B%22colId%22:%22Location%22,%22sort%22:%22asc%22%7D#note-1.
[5] “Who Does Alabama Medicaid Serve?” Alabama Medicaid Agency, http://www.medicaid.alabama.gov/documents/2.0_Newsroom/2.3_Publications/2.3.5_Annual_Report_FY16/2.3.5_FY16_Who_Does_Alabama_Medicaid_Serve.pdf.
[6] “Access to Care,” (August 23, 2018) Alabama Department of Public Health. http://www.alabamapublichealth.gov/healthrankings/access-to-care.html.
[7] State of Alabama Community Health Assessment, (2015) Alabama Department of Public Health, https://www.alabamapublichealth.gov/accreditation/assets/CHA2015_Final_RevAugust_R.pdf.
[8] “Access to Care,” (August 23, 2018) Alabama Department of Public Health. http://www.alabamapublichealth.gov/healthrankings/access-to-care.html.
[9] “HPSA Find,” U.S. Department of Health and Human Services Health Resources & Services Administration, https://data.hrsa.gov/tools/shortage-area/hpsa-find
[10] Ellison, Ayla, (March 26, 2018), ”7 states with the most rural hospital closures,” Becker’s Hospital Review https://www.beckershospitalreview.com/finance/7-states-with-the-most-rural-hospital-closures-032618.html, and July 13,2018) “9 hospital closures in 2018 so far” https://www.beckershospitalreview.com/finance/9-hospital-closures-in-2018-so-far.html.
[11] Givens, M., Jovaag, A., & Wilems Van Dijk, J. 2018 Alabama State Report University of Wisconsin Population Health Institute http://www.countyhealthrankings.org/rankings/data/al.
[12] Givens, M., Jovaag, A., & Wilems Van Dijk, J. 2018 Alabama State Report University of Wisconsin Population Health Institute http://www.countyhealthrankings.org/rankings/data/al.
[13] Givens, M., Jovaag, A., & Wilems Van Dijk, J. 2018 Alabama State Report University of Wisconsin Population Health Institute http://www.countyhealthrankings.org/rankings/data/al.
[14] “What Works for Health,” University of Wisconsin Population Health Institute, http://www.countyhealthrankings.org/take-action-to-improve-health/what-works-for-health.
[15] America’s Health Rankings Annual Report 2017, (2017) United Health Foundation. https://assets.americashealthrankings.org/app/uploads/ahrannual17_complete-121817.pdf.