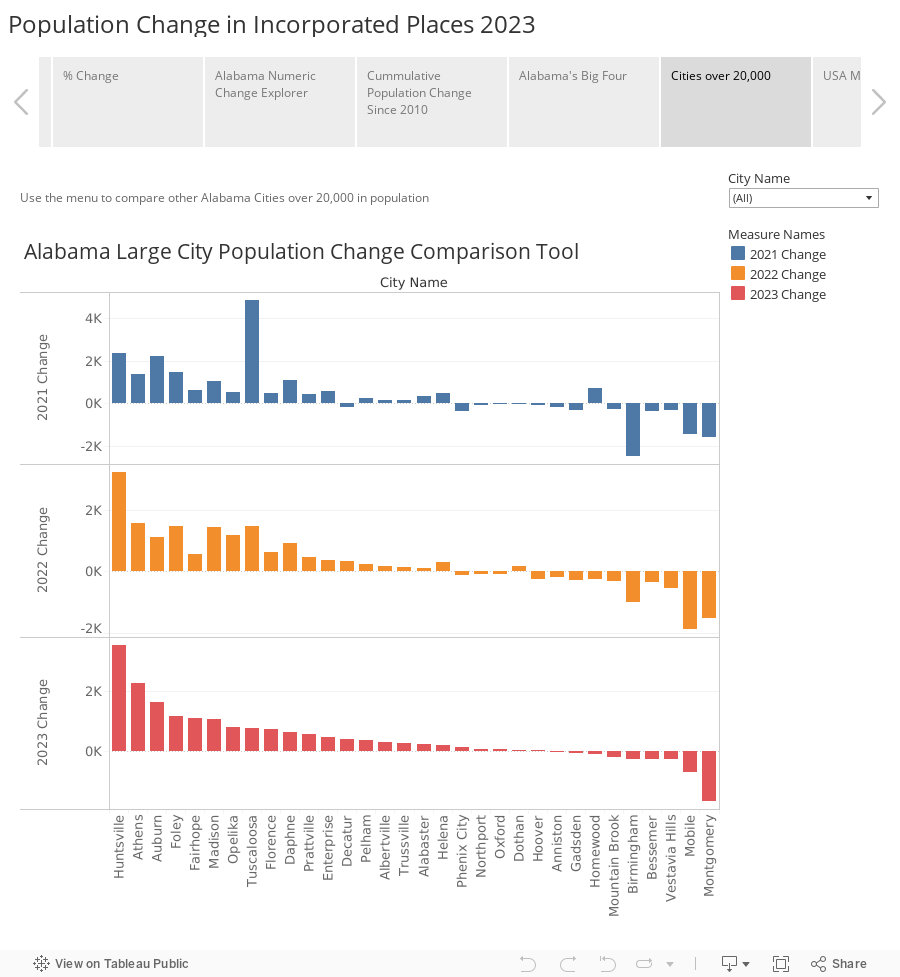
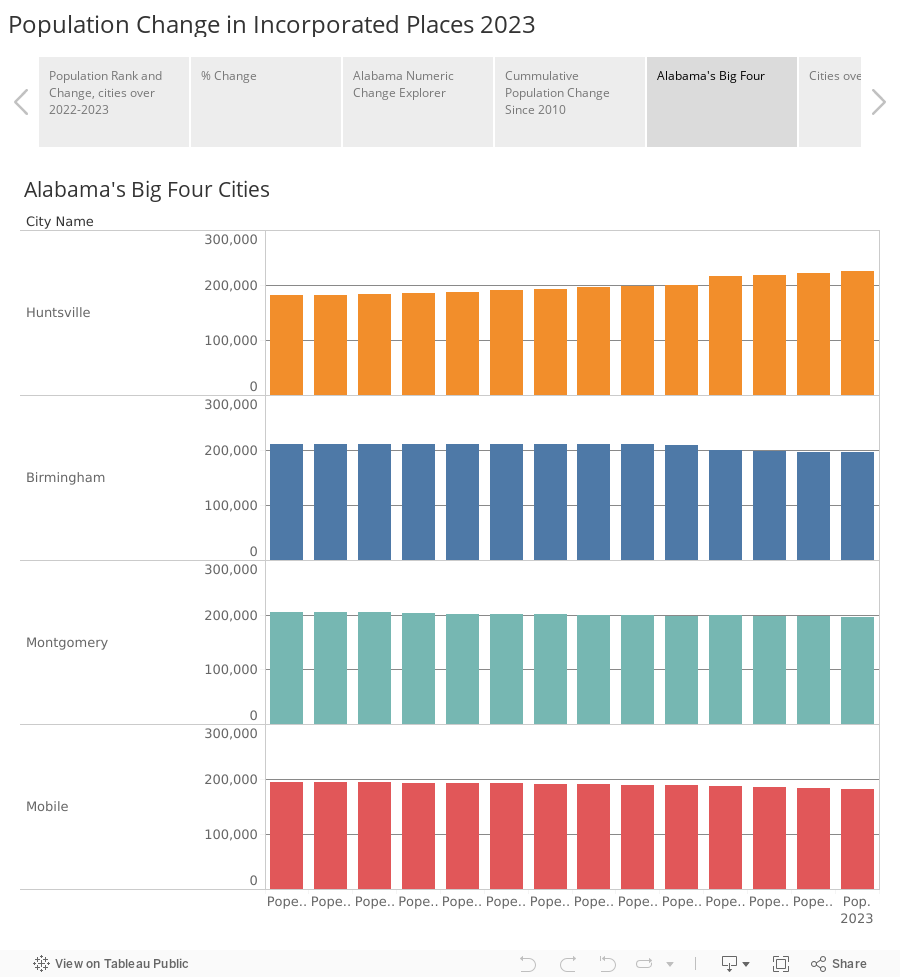
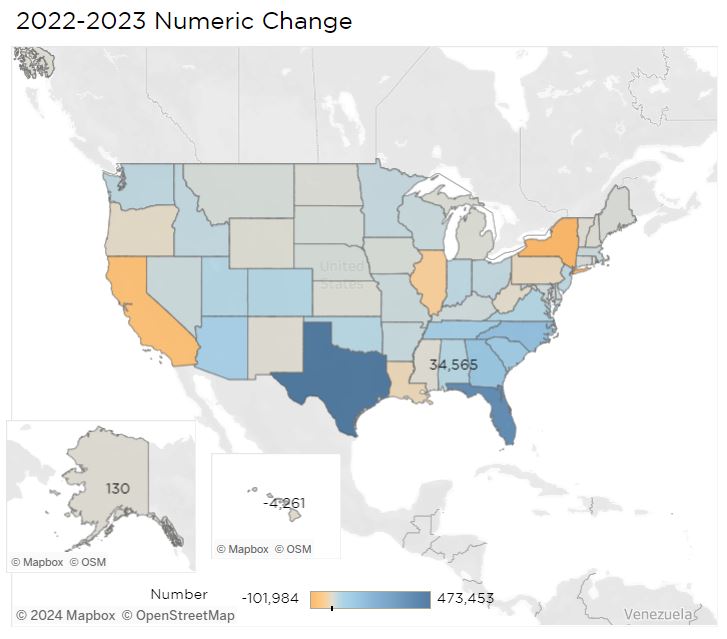
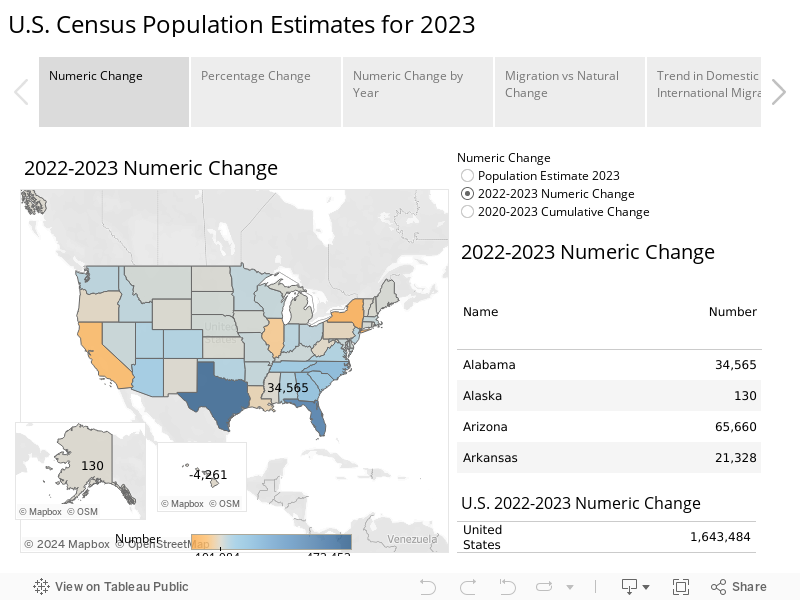
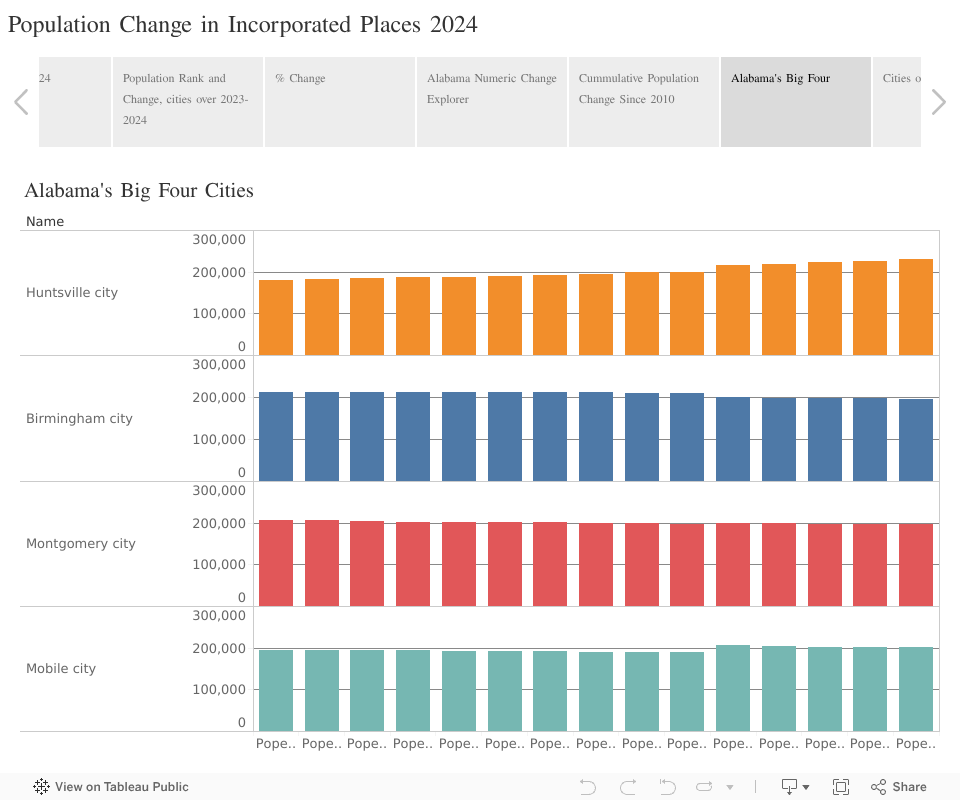
New population estimates from the U.S. Census Bureau place Mobile as the state’s second-largest city, behind booming Huntsville and ahead of Birmingham and Montgomery, both of which saw population declines according to the most recent estimates from the U.S. Census Bureau.
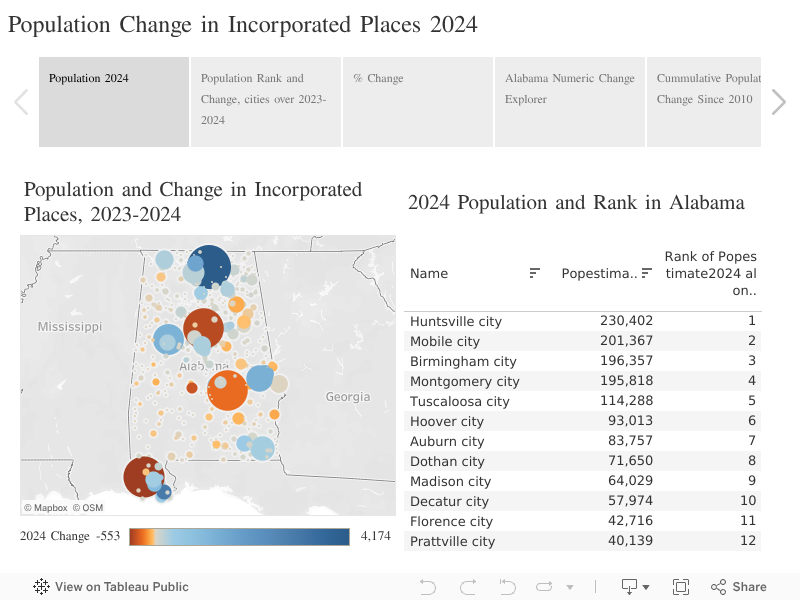
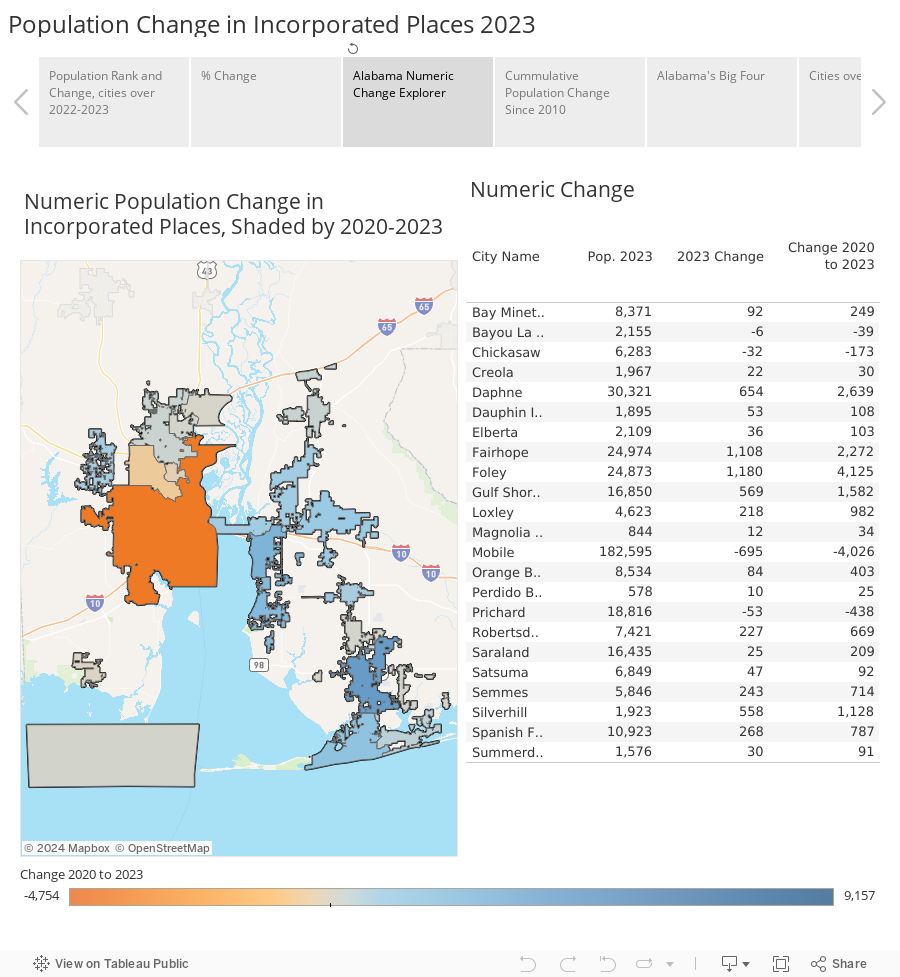
Mobile’s new status takes into account the city’s 2023 annexations of neighborhoods in Mobile County that were expected to add about 20,000 to the city’s population. According to revised Census estimates, the city jumped from less than 190,000 before 2020 to almost 210,000, pushing it well ahead of Birmingham which, for 2024, had an estimated population of 196,818.
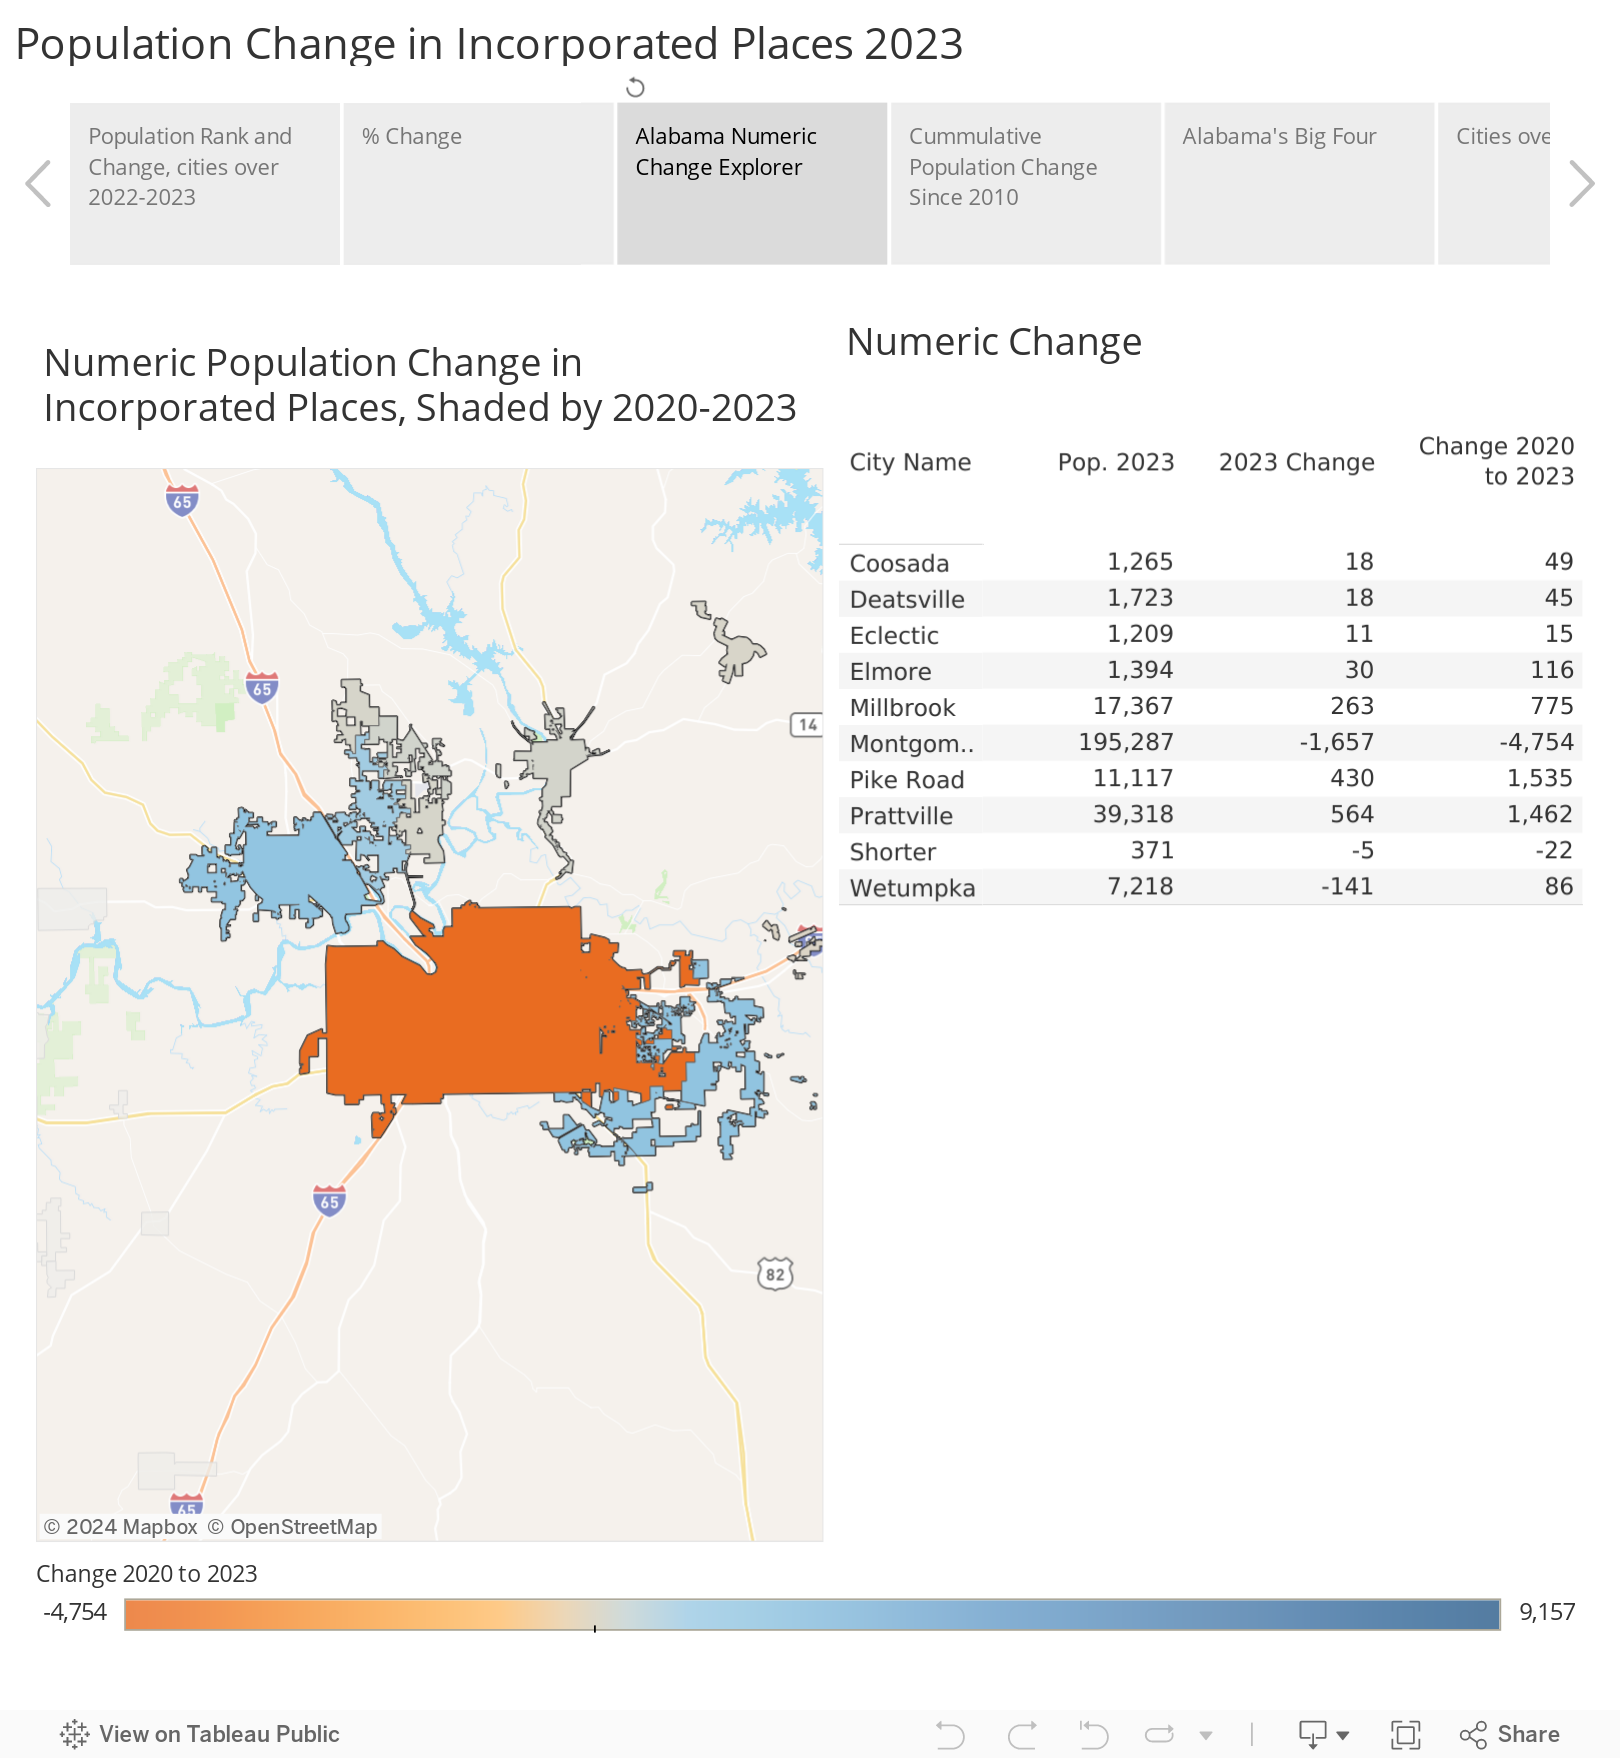
However, despite its annexation bump, Census estimates show Mobile is still losing population, dropping by over 500 over the past year to an estimated 201,367. Birmingham and Montgomery are also continuing to see population declines. If current trends prevail, the three cities seem destined to continue jockeying back and forth. Currently, the population estimates have Birmingham in third, just in front of Montgomery, at 195,818.
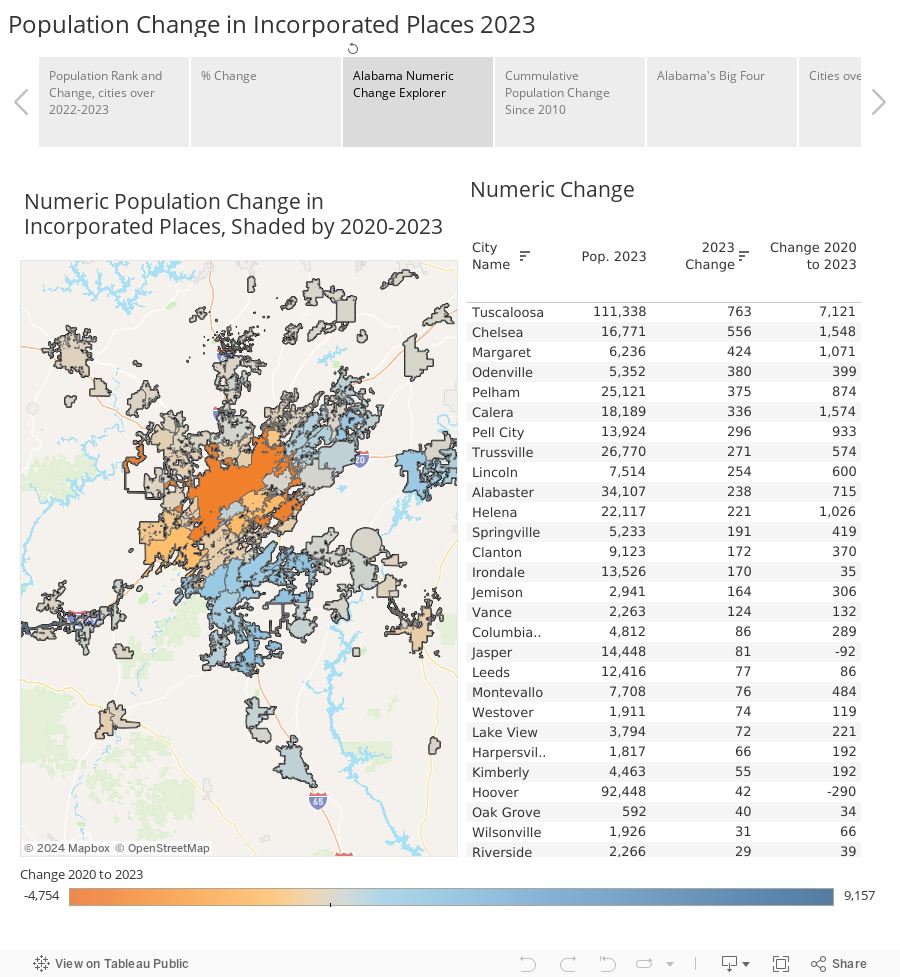
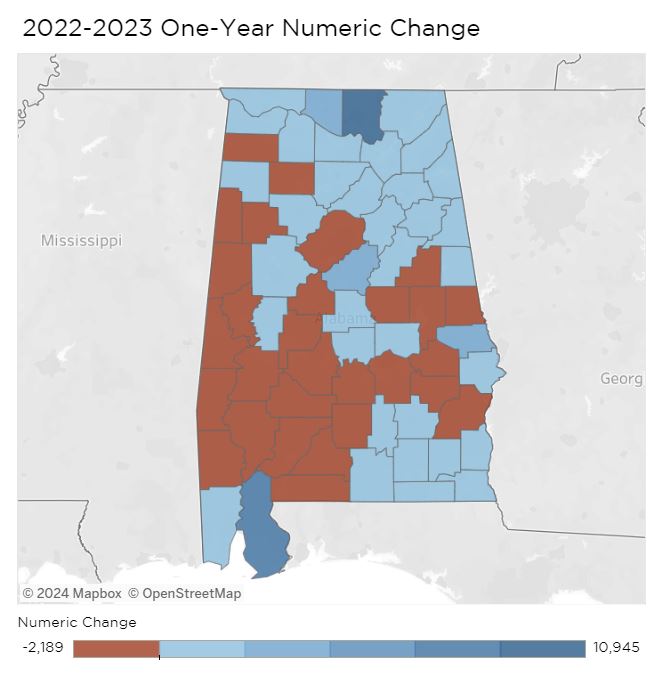
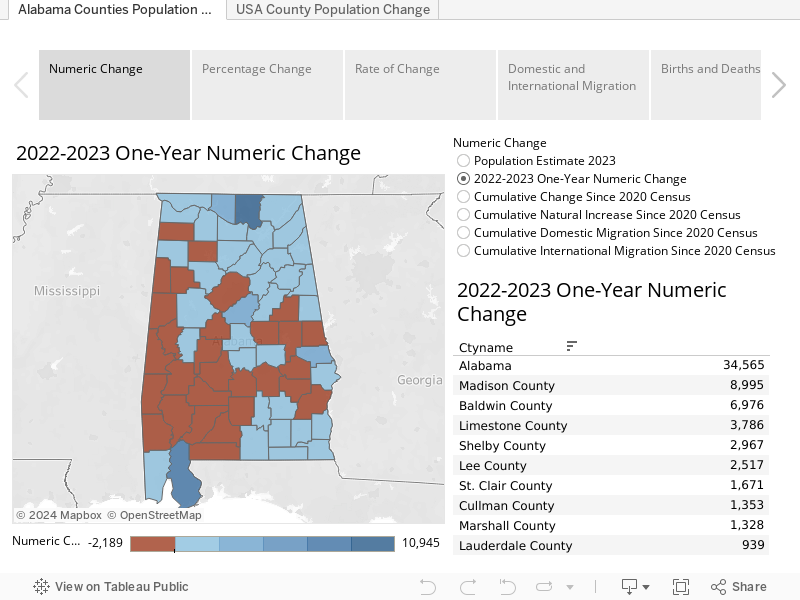
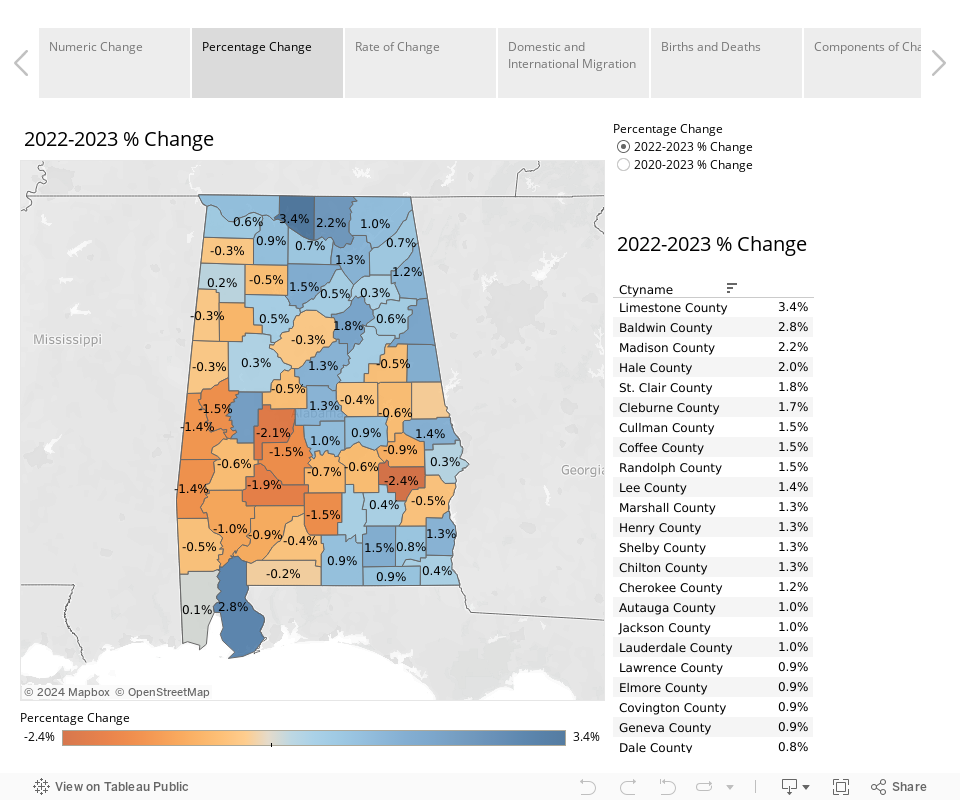
The biggest surprise of the estimates was the small Jefferson County hamlet of Brookside, which had the highest population growth rate of any municipality in the state at 13.2%. The town added 158 residents, bringing its total to 1,357 residents. The town has a new neighborhood under construction that appears to be drawing new residents. Small towns and cities around Huntsville and in Shelby and St. Clair counties, outside of Birmingham, saw higher rates of growth in percentage terms, as did suburban cities around Montgomery. Small towns in Wiregrass surrounding Dothan and Enterprise also showed growth in percentage terms. And several Baldwin County communities ranked near the top in terms of percentage growth.

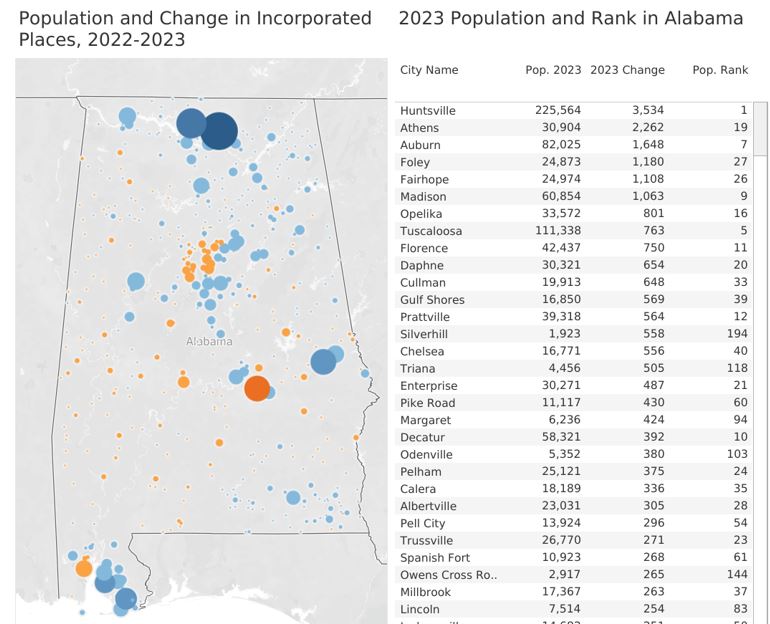
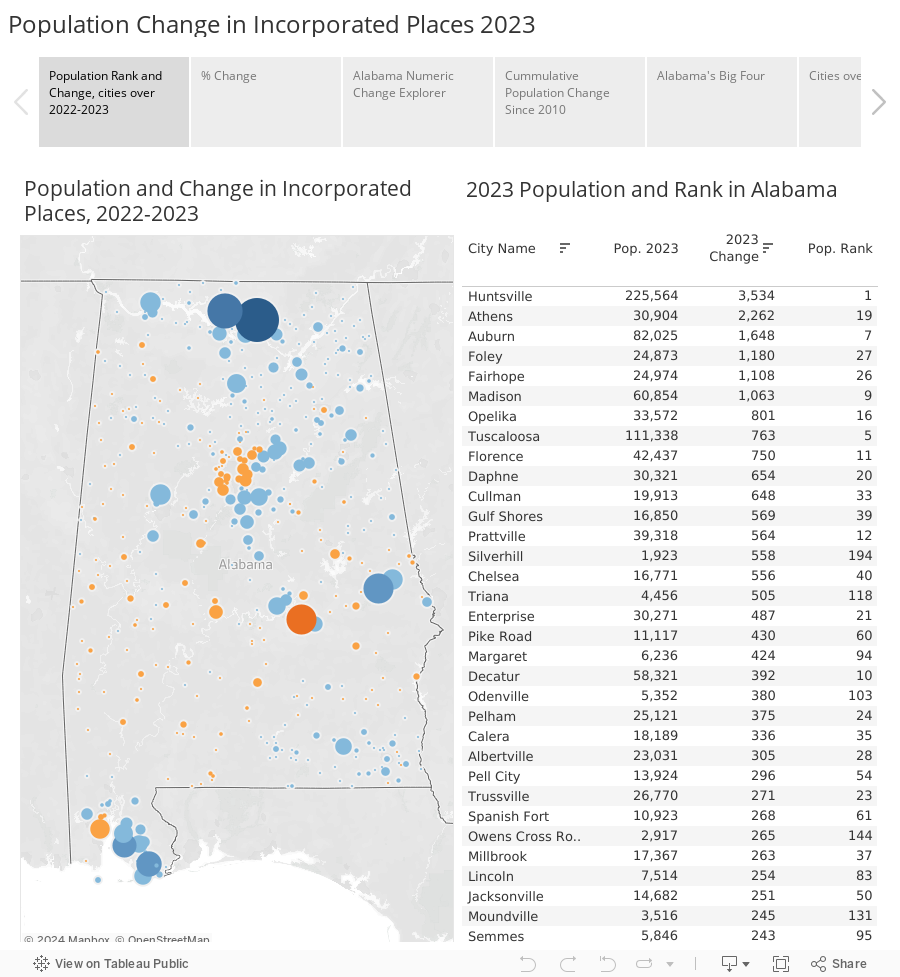
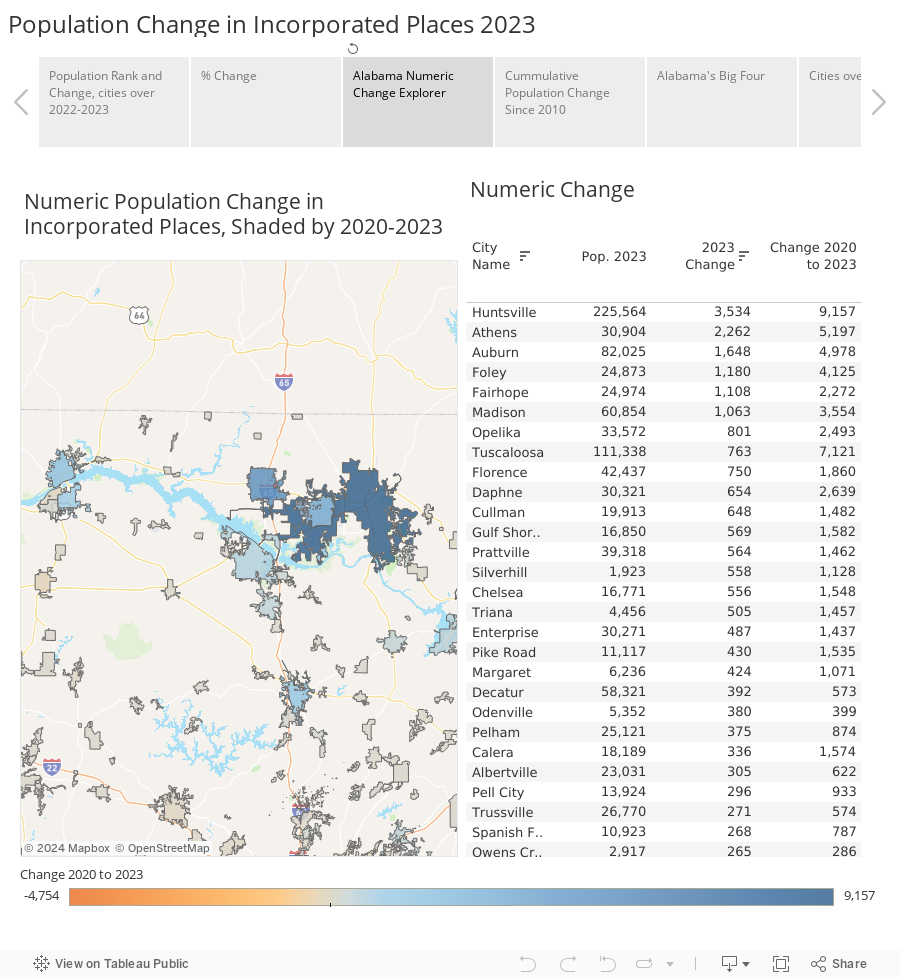
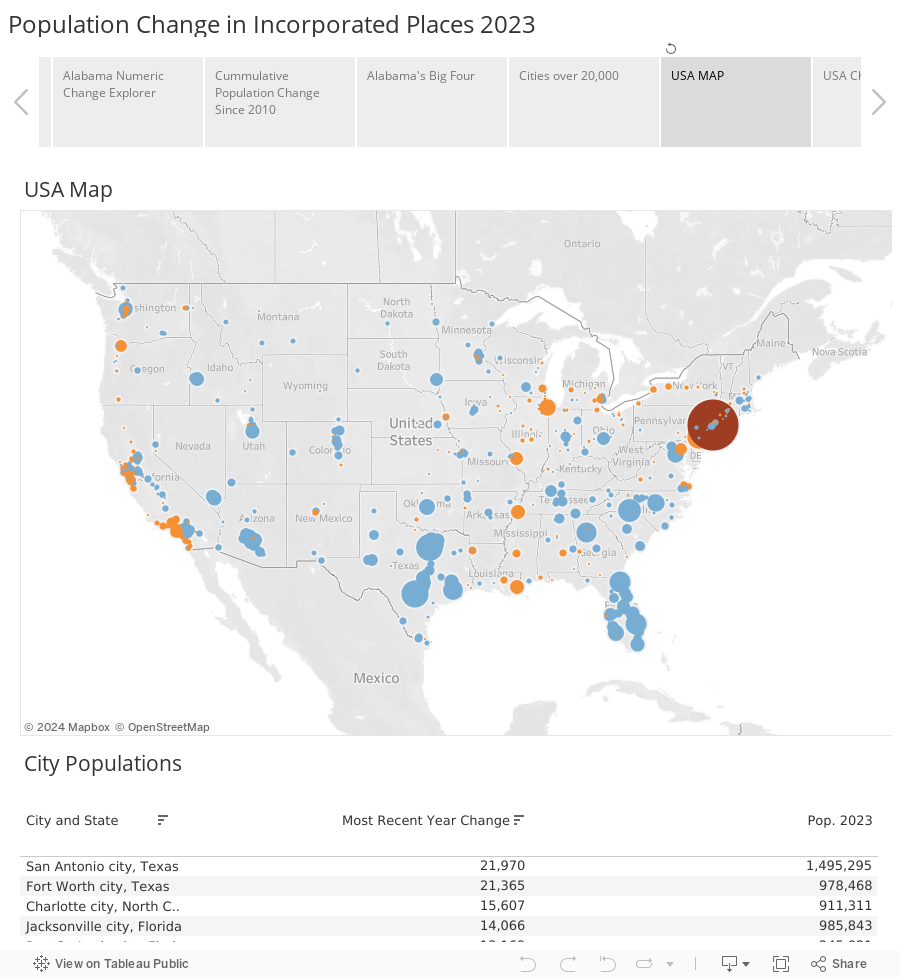
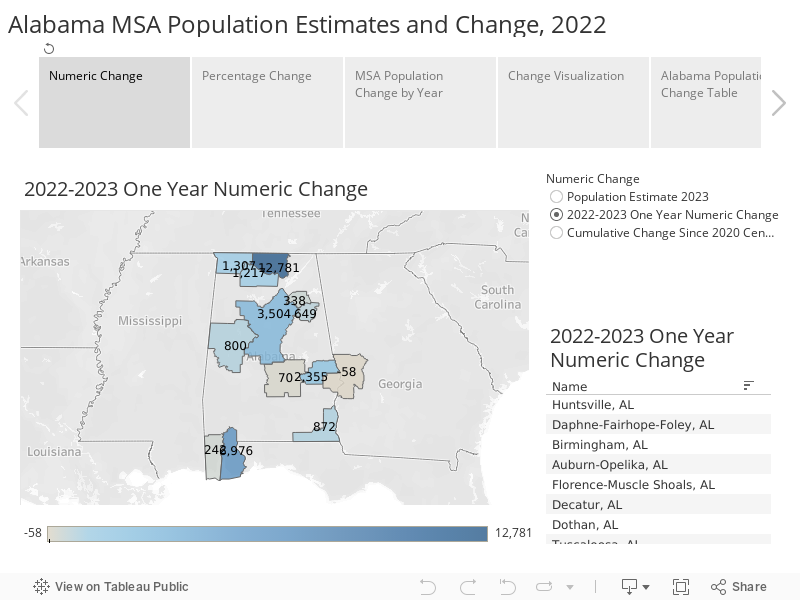
In terms of growth in numbers, the city of Huntsville is the state champ, drawing in another 4,174 new residents in 2024. The City of Madison, Huntsville’s suburban neighbor, added 3,007, ranking third in the state in numeric growth, and Athens, which also borders Huntsville, added 1,641, ranking fourth.
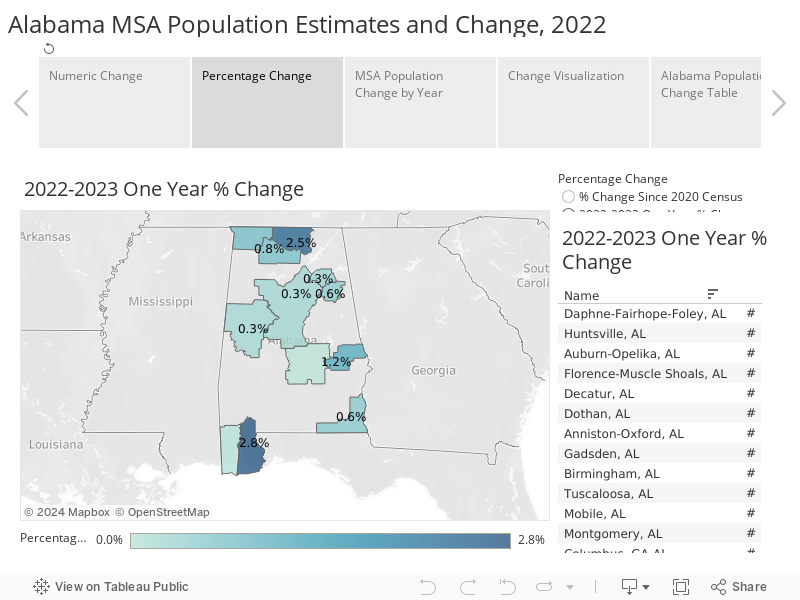
The City of Foley in Baldwin County grew by 3,012, ranking second in the state in numeric terms and tying for second in percentage growth at 12%. Foley’s fellow Baldwin County city of Loxley also grew 12%. Fairhope added 1,011 according to the estimates, ranking 8th in the state. Gulf Shores and Daphne also ranked in the state’s top 20 in the number of residents added.
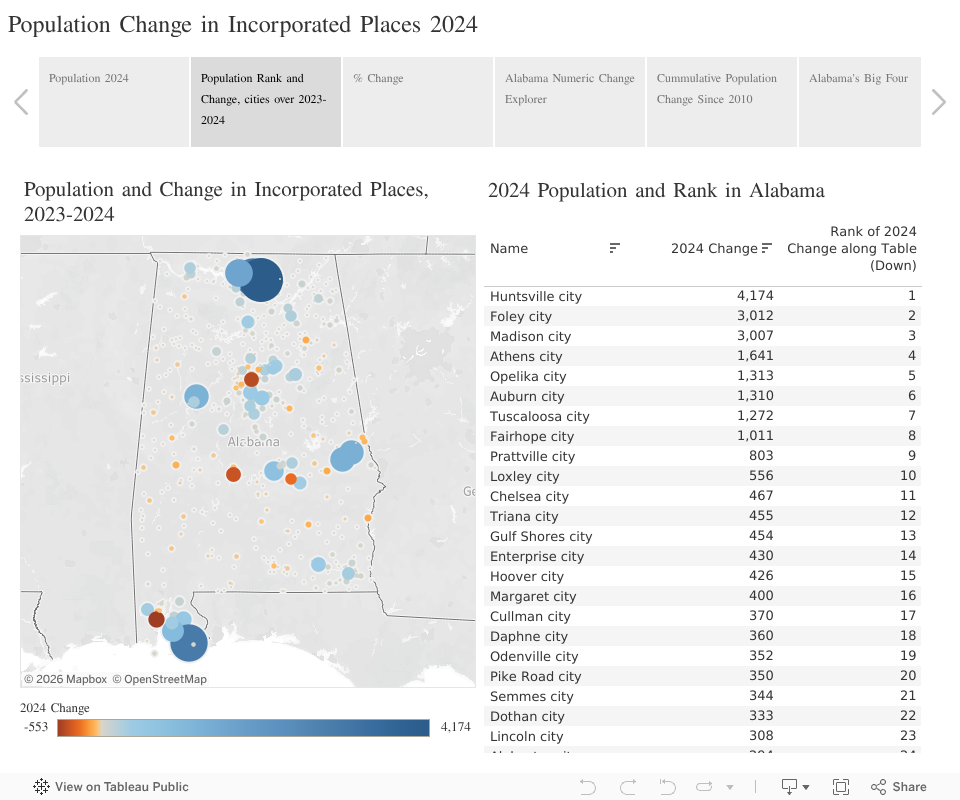
Cross state rivals Tuscaloosa and Auburn continue to grow with Auburn adding 1,310 to edge out Tuscaloosa’s gain of 1,272 new residents. Auburn also has the secret weapon of Opelika next door, which added 1,313 new residents in 2024. That far outpaces Northport which grew by 280. Together, Tuscaloosa and Northport have about 150,00 residents compared to Auburn and Opelika’s 120,000.