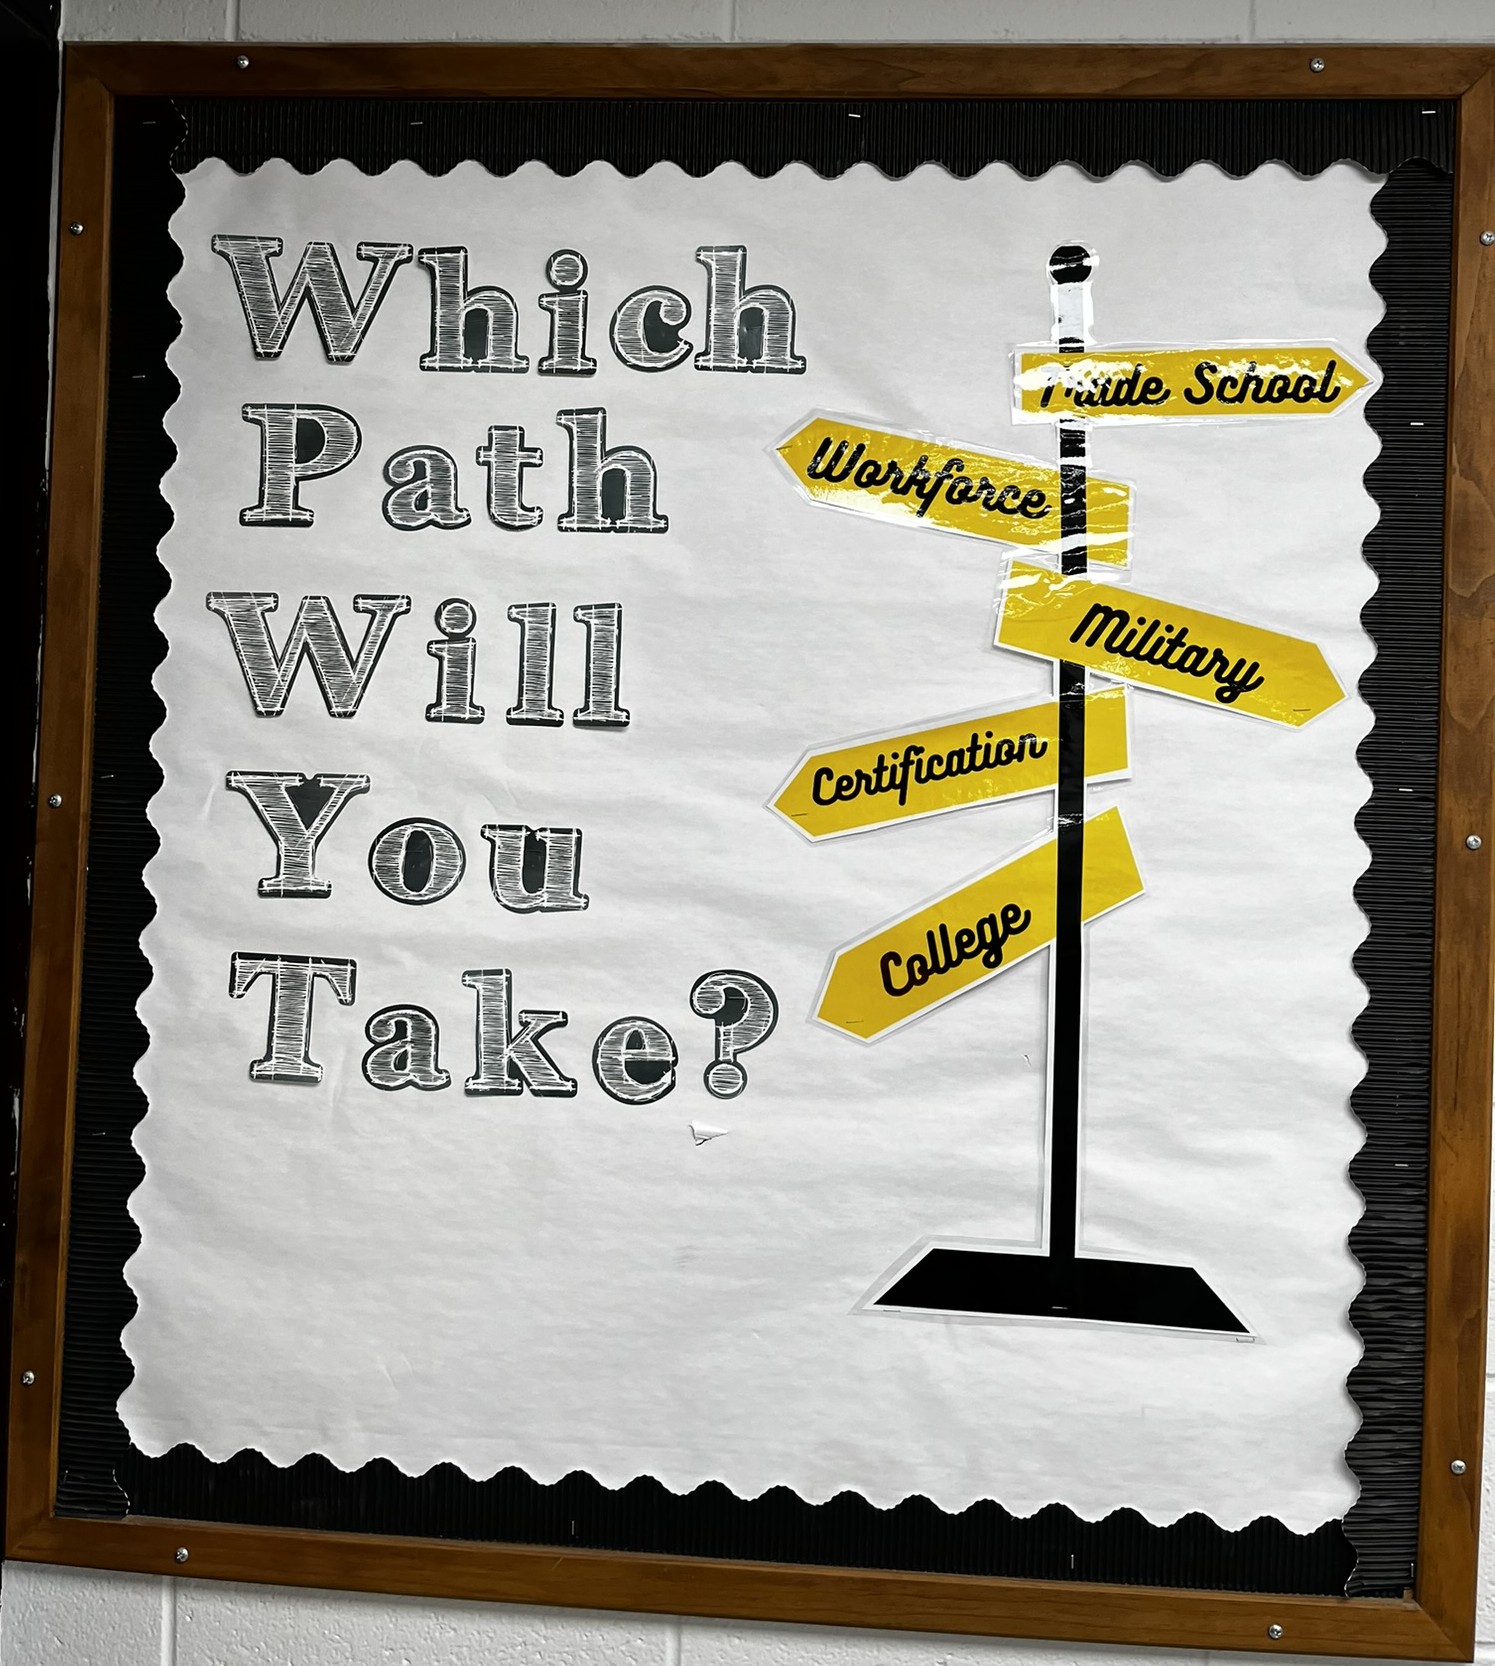
This spring, all Alabama high school graduates will have to earn a marker of college and/or career readiness in order to graduate.1
In this installment of PARCA’s Keys to Success series, we visit Opp High School, which has been one of the state’s most successful schools at producing college and career-ready graduates. In fact, for five years running, more seniors were college or career-ready (CCR) than actually earned a diploma.
In 2024, 94% of Opp’s seniors graduated (beating the state average of 92%), and 99% of seniors ended the year with a marker of college and career readiness, a CCR rate that is 10 percentage points higher than the state average.

How do they do it?
- More attention per student thanks to small school size
- A close dual enrollment partnership with the local community college
- Creative use of practical, local opportunities for students to earn Career Technical Education credits and credentials
- Practice and deliberate effort on the measures that qualify students for college readiness
PARCA’s Keys to Success series identifies schools and systems that are exceeding expectations and explores how they are doing it. The series aims to identify and share best practices.
Small Town Personalized Attention
The City of Opp, located in rural Covington County, was formerly a textile mill town. Despite the closing of the textile mills, Opp has maintained a stable population of around 6,700 people since 2000.
The school system produces between 80 and 90 graduates per year, which ranks among the 20 smallest school systems in the state. Opp’s percentage of students from economically disadvantaged households is higher than the state average. Thanks to federal anti-poverty education dollars, Opp’s per-student expenditure was slightly above the state average in 2023.

In some ways, that small size helps Opp. The high school is the center of activity and energy for the entire community. That keeps students and the community engaged.
“What is going on at school is the hottest thing in town. That is very much an asset for us,” said Opp High School Principal Matt Blake.
A smaller school can, in some instances, mean each student receives extra attention. For example, in addition to a traditional guidance counselor, Opp High School has a full-time career coach, who works with the counselor, to make sure all students have a plan to progress through school on a trajectory that points toward one of the “three e’s”: graduating from high school, either Enrolled, Employed, or Enlisted.
Student preparation for college and career readiness begins in middle school, with the career coach visiting students and making them aware of potential career pathways. During orientation, rising ninth graders and their parents are presented with career options, and students begin developing four-year plans to meet both academic and college- and career-readiness markers they’ll need to graduate.
Once at the high school, the counseling suite is highly visible, located at the top of the high school stairs, with glass windows for walls. The visibility serves as a reminder to students of the stream of opportunities available. Opp has a regular stream of visits from college, employment, and military recruiters.
When Blake moved to Opp from Gulf Shores in 2022, he brought his career coach, Courtney Blake, with him. She also happens to be his wife. The two have creatively conspired to leverage resources to expose students to college and career opportunities.
Community College Collaboration
A primary partner in the CCR enterprise is Opp’s community college, the MacArthur branch of Lurleen B Wallace Community College (LBW).
In the past, more than half of Opp graduates flowed into LBW after graduation. More recently, the relationship is even tighter and starts earlier through dual enrollment. Opp students, while still in high school, make up a healthy share of the college’s enrollment.
In fact, Opp now delivers all its college-caliber courses in partnership with LBW, rather than offering Advanced Placement courses at the high school.
In the 2024-2025 school year, Opp students took almost 400 credit hours at LBW, including college-level courses in English and history, calculus, biology, and psychology. That total also included about 52 career tech classes, including industrial maintenance, engines, computer science, and cosmetology. Opp High School students also took aviation courses through Enterprise State Community College.
Some students attend classes on the LBW campus. In other cases, an LBW instructor may come to the high school campus to lead class two days a week, with students led by Opp teachers the other three days, who focus on ACT prep skills and strategies. Opp High School also has its own teachers who are certified to teach dual-enrollment classes on campus at OHS, but through LBW.
Both academic and career-tech courses taken through LBW count toward degrees or certifications. The academic courses can be transferred to universities, allowing Opp graduates to start college with a bank of credits toward a degree.
Taking Creative Advantage of Available Opportunities
Opp isn’t a big city full of employers and businesses that can offer internships or sponsor training programs for high school students. But the Opp High has a tradition of Career and Technical Education programs that creatively intersect with school and community needs.
Plant Science teacher, Josh Kyser, is a graduate of the turfgrass management program he now leads. After graduating from Opp, he continued in the field at Auburn, which led to a career in golf course management and design.
Family ties eventually drew him back to Opp, and after a few twists and turns, he was recruited to serve as the City of Opp’s director of Parks and Recreation. The City maintains the high school’s fields, so he had a close relationship with the school. Eventually, high school leaders persuaded him to lead the program that had launched his career.
The horticulture class helps care for the school’s athletic fields, which, over time, can lead to students earning turfgrass management and plant biotechnology certifications. Meanwhile, through a competitive grant program, Opp won extra career-tech funding to put students to work and in class during the summer on a school field project.
The students worked with the City and the county on a project to grade and pave a road from the school to the athletic field. Through their summer work, the students earned money and certifications for operating skid steers, mini-excavators, and bulldozers. Those certifications have real value in the employment marketplace.
In another summer project, students in the plant biotechnology classes designed and constructed a pollinator garden. Students also planted and tended vegetable and herb gardens, projects that were also funded in part with CTE money won through a competitive grant.
This fall, that pollinator garden was fluttering with butterflies and darting with hummingbirds. The vegetable and herb gardens yielded beans, collards, Brussels sprouts, and other ingredients that contributed to a community banquet organized by the students in the food and nutrition program.
In preparing for the event, students earned ServeSafe certifications, a credential often required for those working in the restaurant industry. The preparation and execution also dovetailed with nutrition science course credits.
Increasing College Readiness
Opp High School has also ramped up student preparation for four-year colleges, focusing on improving performance on the ACT college admissions test.
Historically, most college-bound Opp graduates started at a community college, then transferred to four-year universities after earning college credits.
With the sharp rise in students taking community college courses in high school, students are in a better position to go straight to a four-year college after graduation. However, that means ACT scores take on more importance for college admission and scholarships.
Blake, who spent time as a football coach, recognizes the value of practice.
So, in his effort to improve student performance on the ACT, Blake created more opportunities for students to take the test. The school pays for ninth-graders to take the Pre-ACT, in addition to administering it to 10th-graders in the fall.
The school then offers students a first attempt at the ACT in the spring semester of their 10th-grade year.
In January, teachers begin reviewing the test and have students take a mock version of the ACT.
They take mock versions again in February. Using a digital test reader, students receive immediate results. Teachers identify questions that tripped up students and talk through the answers, and address the underlying skill.
Students participate in a two-day ACT boot camp. The school brings in an ACT specialist in Math and ELA to lead a two-day intensive review before the last mock exam. This allows students to use the strategies and tips from the last mock exam to build confidence in their abilities.
In late March, juniors take the real test, the required junior year administration.
Blake concedes that he has greatly increased the emphasis on the ACT. However, he doesn’t think that emphasis distracts from educational goals. “Test-taking skills aren’t frivolous,” he said. “It teaches problem-solving and critical thinking. And they’ll have to take similar tests in college or if they apply to graduate school.”
Results
Between 2023 and 2024, the percentage of students earning a benchmark score on the ACT leapt from 34% in 2023 to 52% in 2024, exceeding the state benchmarking rate of 42%
The Opp graduating class of 2024 posted major gains on the ACT in every subject, outperforming the state in all four subjects.

The college-going rate in Opp rose from 62% in 2022 to 68% in 2024, far exceeding the state college-going rate of 57%.
The gains were particularly pronounced in the percentage of students who went straight to a four-year college after graduating from high school, rising from 10% in 2022 to 31% in 2024.

Conclusion
Blake said Opp’s success has resulted from long-term planning by the school, students, the system, and the state.
The school works with students and parents, beginning in middle school, to chart a student’s path through choices and courses that lead to a college or career goal. The school works with local partners such as LBW Community College, Opp’s Mizell Memorial Hospital, and the City of Opp to expand work and internship opportunities for students.
The school also works with the system and the state to pay for enhanced opportunities. The school has been aggressive and creative in pursuing grants and establishing budget priorities in order to pay for novel CTE programs, summer work opportunities, and intensive ACT training for faculty and students.
As the requirement that all students earn a CCR credential goes into effect this fall, the State Department of Education and the governor’s office have indicated continued support for enhanced investment in College and Career Readiness. The Governor’s proposed budget maintains support for career coaches and for K-12 career tech programs and initiatives. The budget proposes increasing support for dual enrollment through the Alabama Community College System by $10 million. The Legislature will consider the budget during its session, which opened earlier this month.
Footnotes
- In order to demonstrate college and career readiness, a student must achieve one of the following:
1. Score college-ready in at least one subject on the ACT
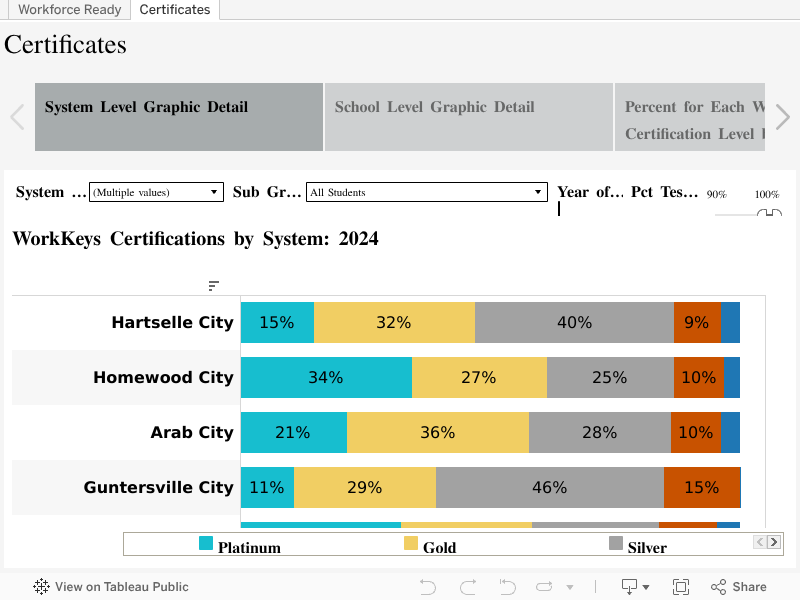
2. Score at the silver level or above on the WorkKeys Assessment.
3. Earn a passing score on an Advanced Placement or International Baccalaureate Exam.
4. Successfully earn a Career Technical Education credential or earn Career and Technical Education (CTE) completer status.
5. Earn dual enrollment credit at a college or university.
6. Successfully enlist in the military.
7. Complete a CTE program of study.
8. Complete an in-school youth apprenticeship. ↩︎