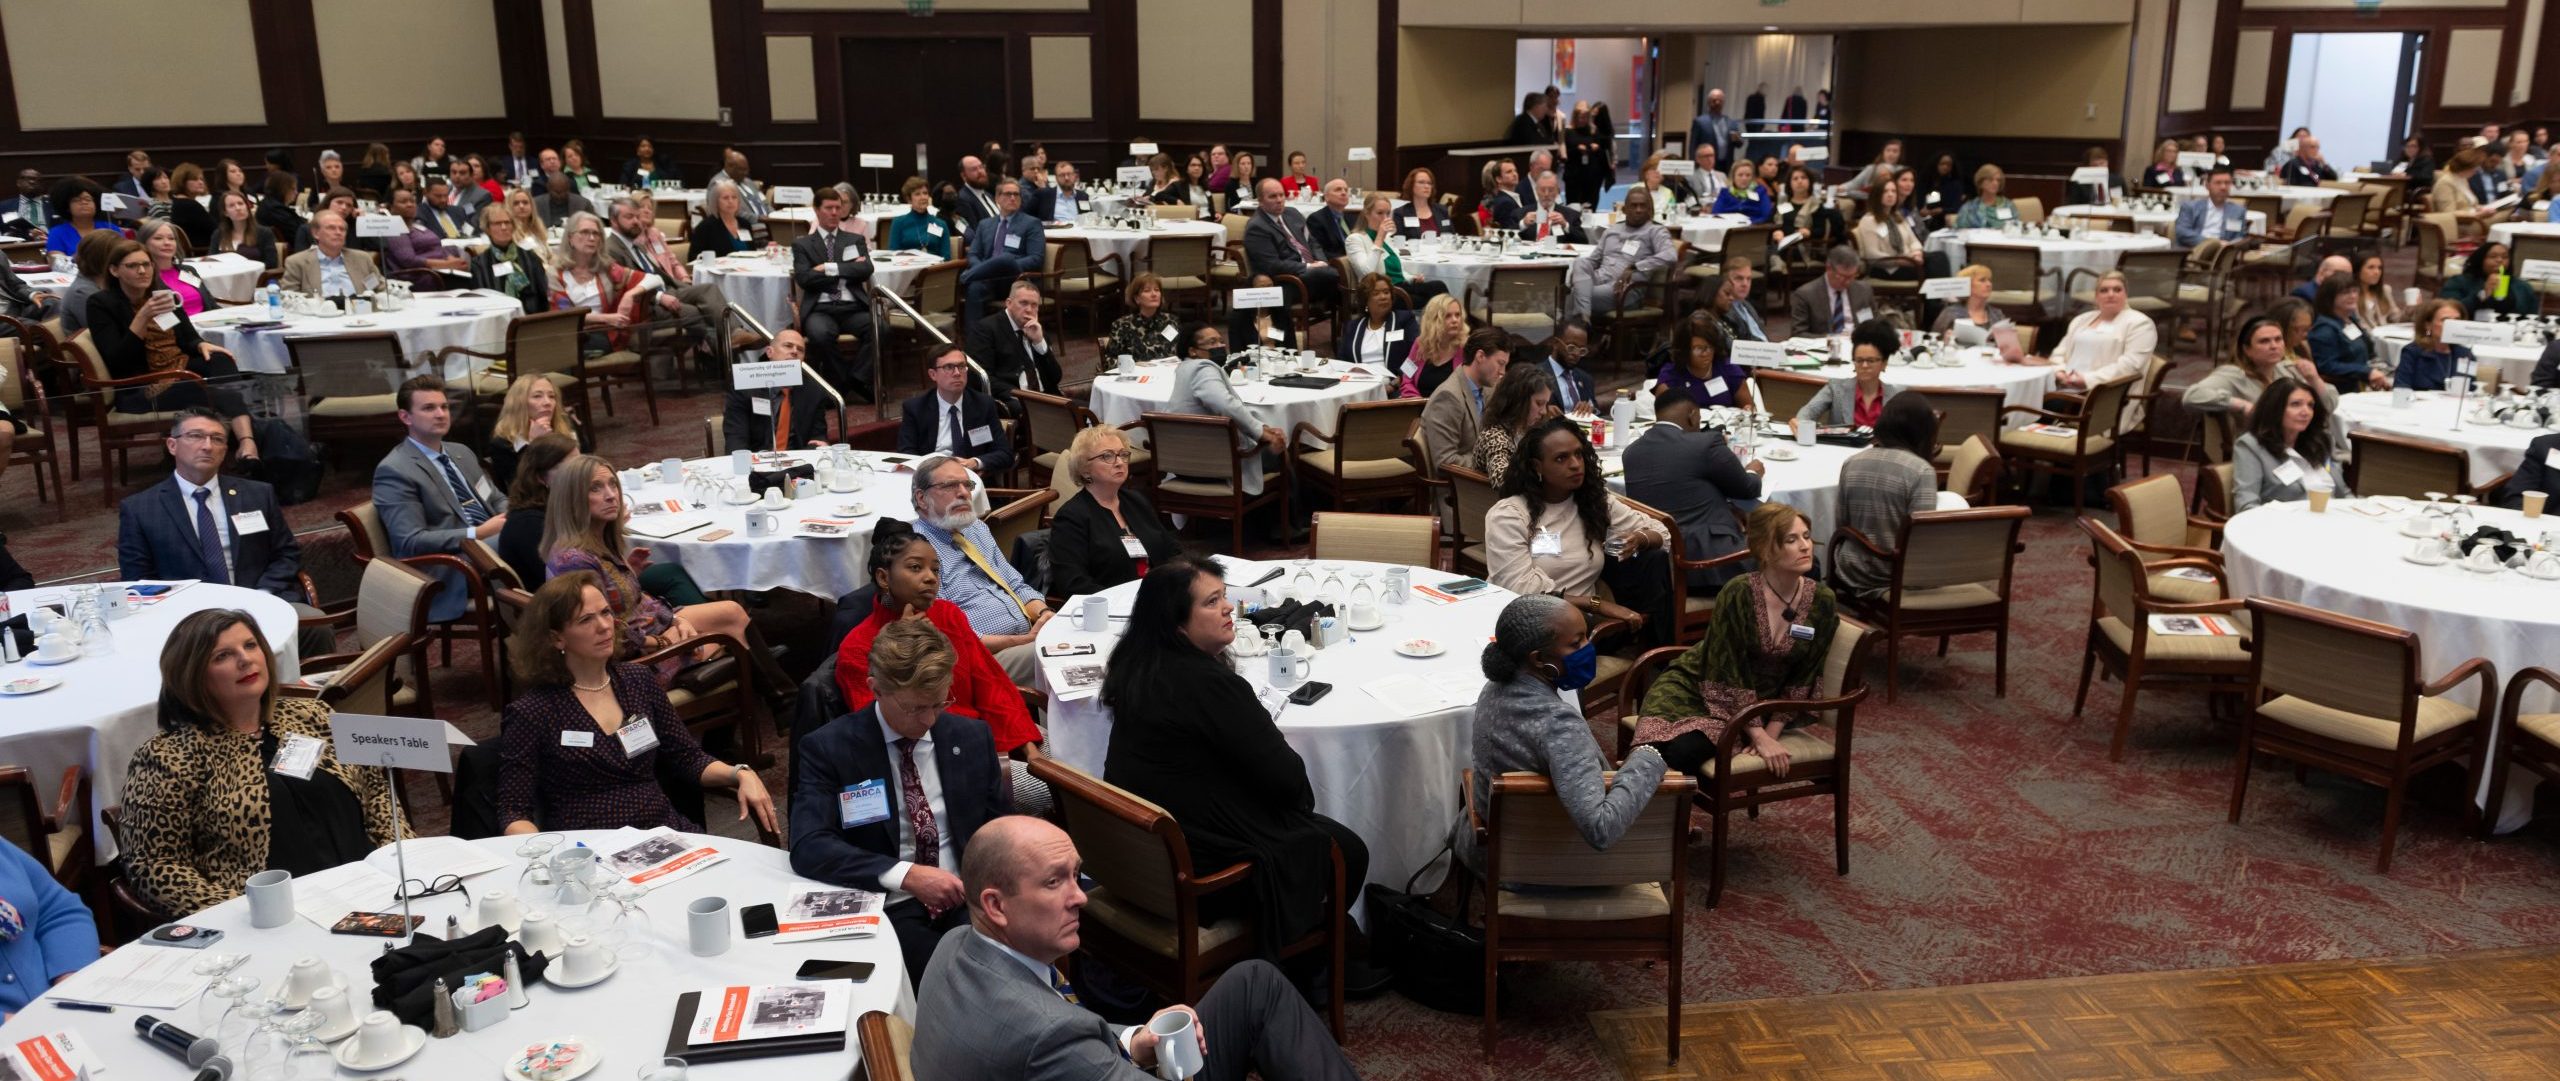
PARCA’s Annual Forum on March 11, 2022, focused on efforts to improve math and reading education instruction for students in Alabama and Mississippi. The program featured the Superintendents of Education for Alabama and Mississippi, with Alabama Gov. Kay Ivey delivering the keynote address.
Bridging for Math Strength — Online bank of math education resources for teachers and leads developed by the Virginia Department of Education and George Mason University.
Bed Time Math — free resource for parents offering ideas on how to incorporate math into everyday interactions with children.
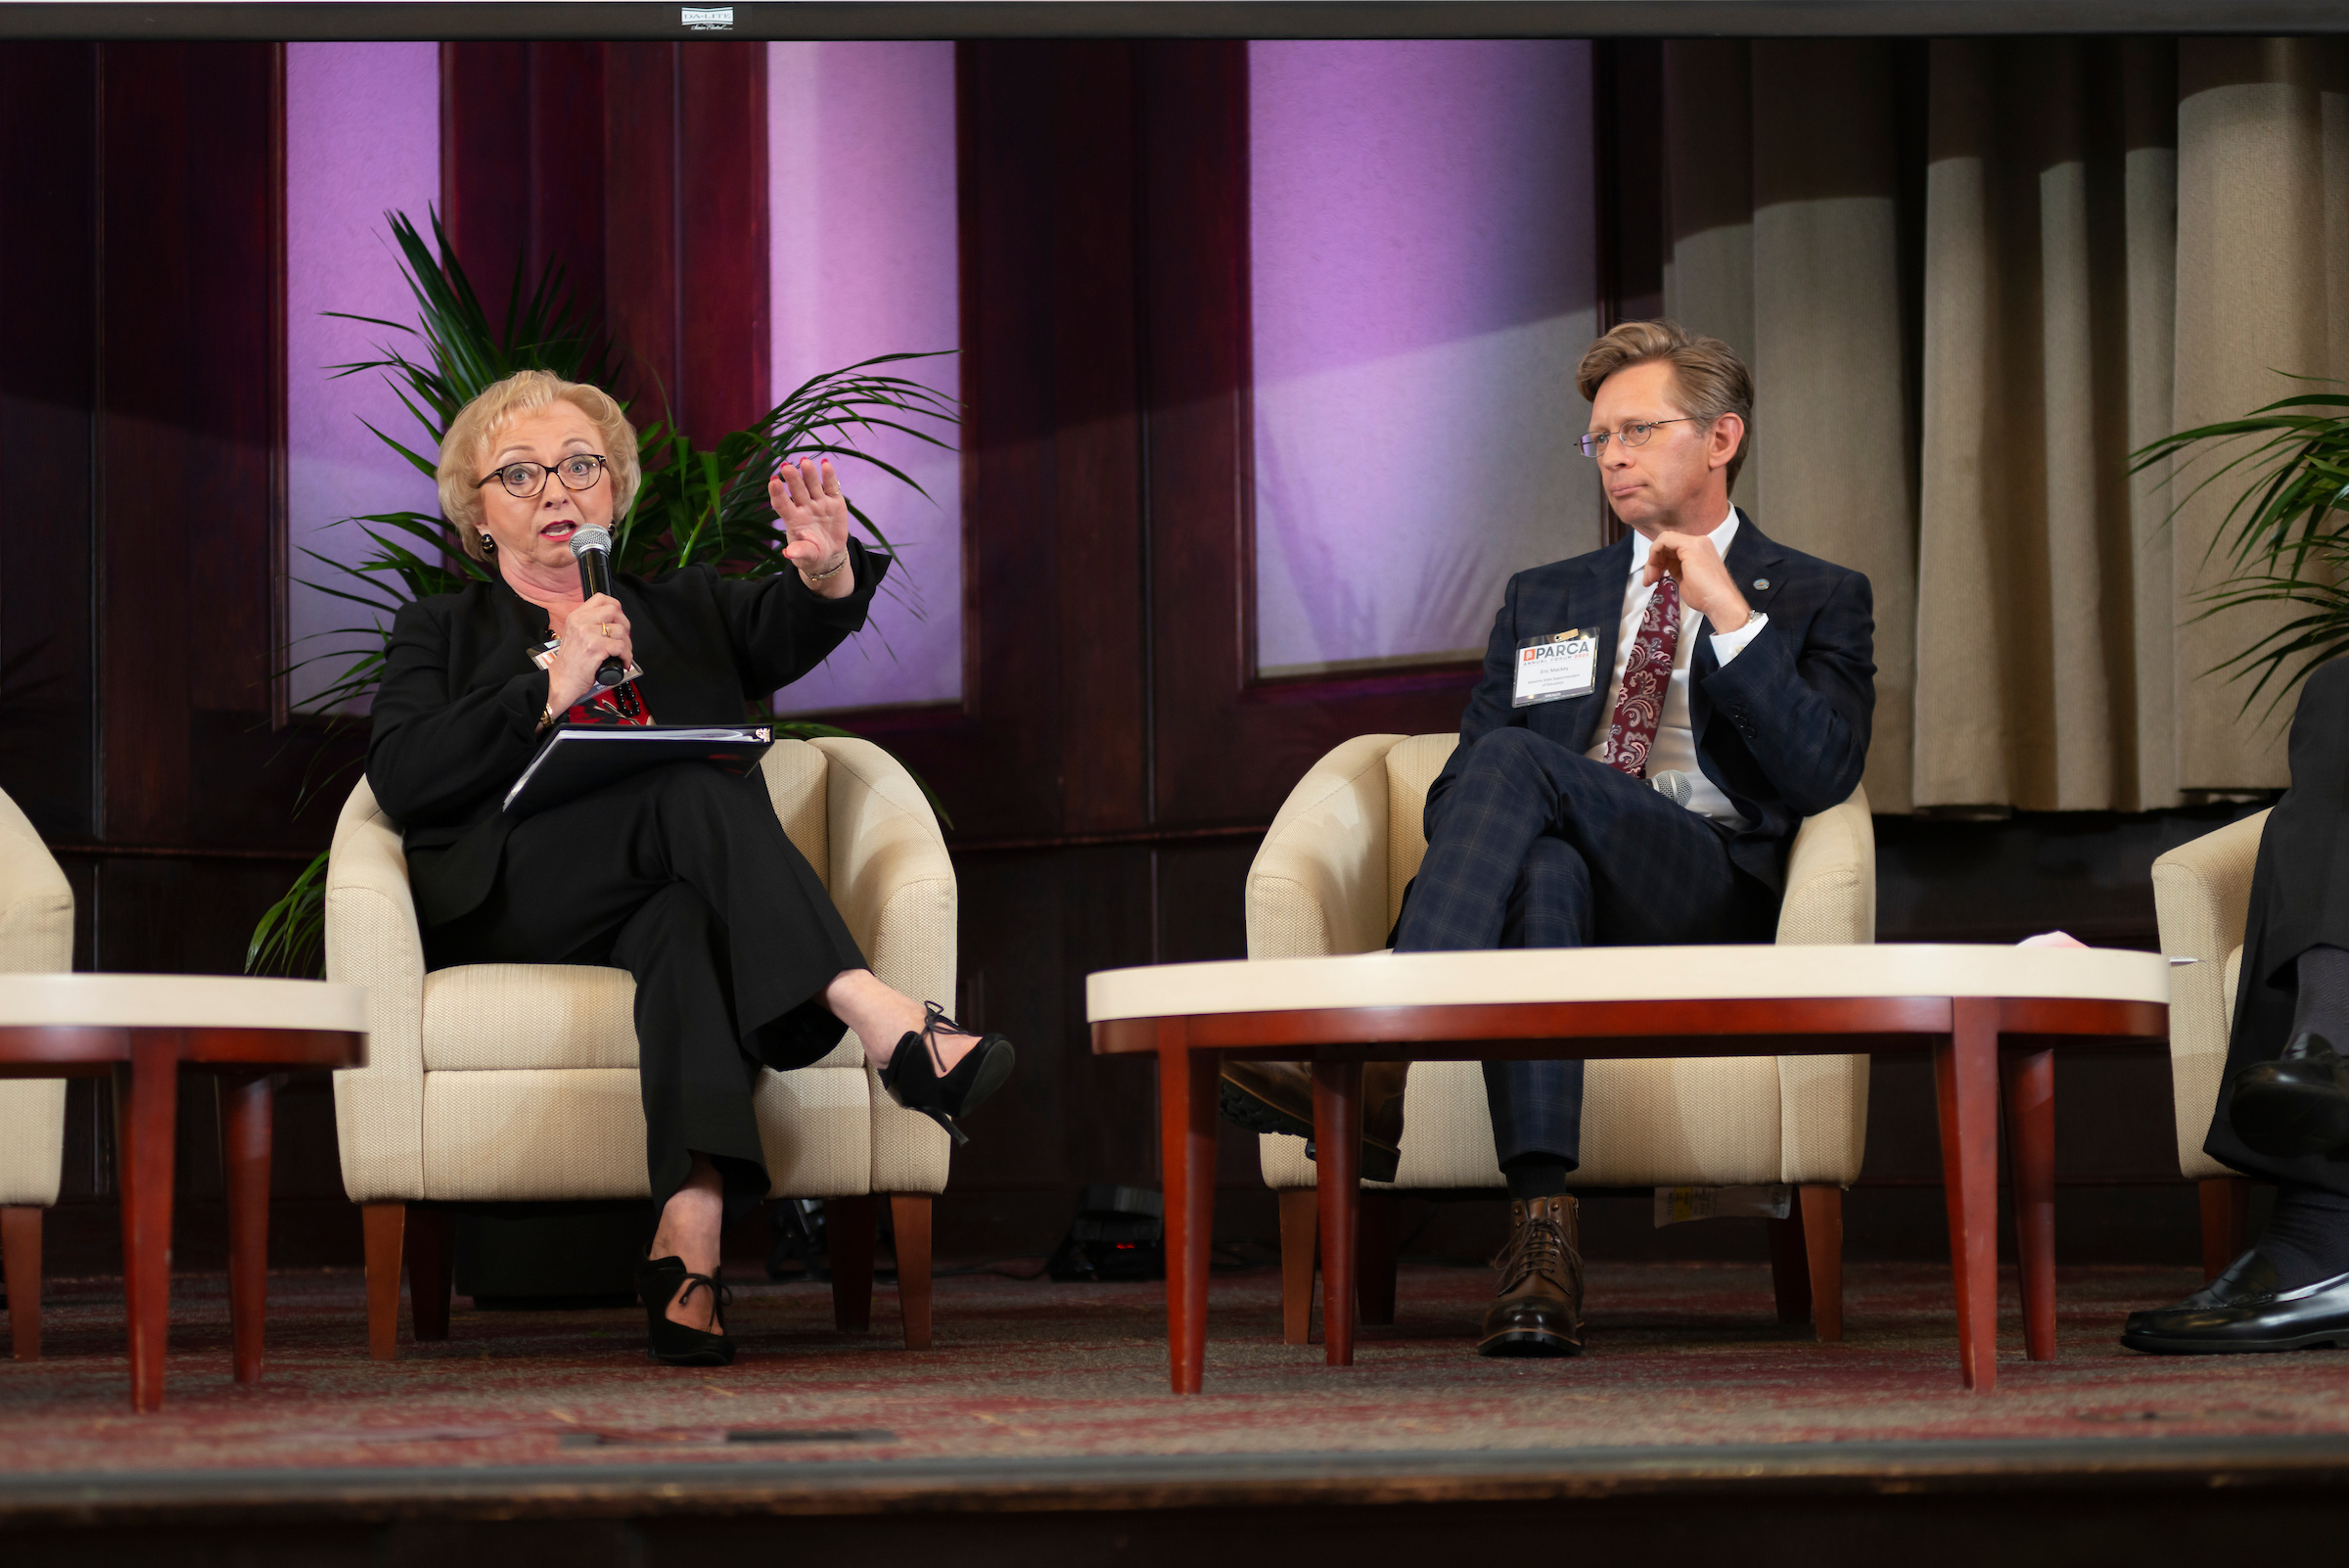
Superintendents’ Conversation
PARCA Annual Meeting
Video of discussion between Dr. Eric Mackey, Alabama State Superintendent of Education, and Dr. Carey Wright, Mississippi State Superintendent of Education
Mississippi’s Literacy-Based Promotion Act: An Inside Look, a study of Mississippi’s Literacy-Based Promotion Act (LBPA) with input from the Mississippi Department of Education and teachers around the state. A study by The Foundation for Excellence in Education (ExcelinEd).
Strong Readers, Strong Leaders, a bank of grade-level-appropriate resources developed for parents and community leaders to help teach children to read. Part of a public awareness campaign to promote reading.
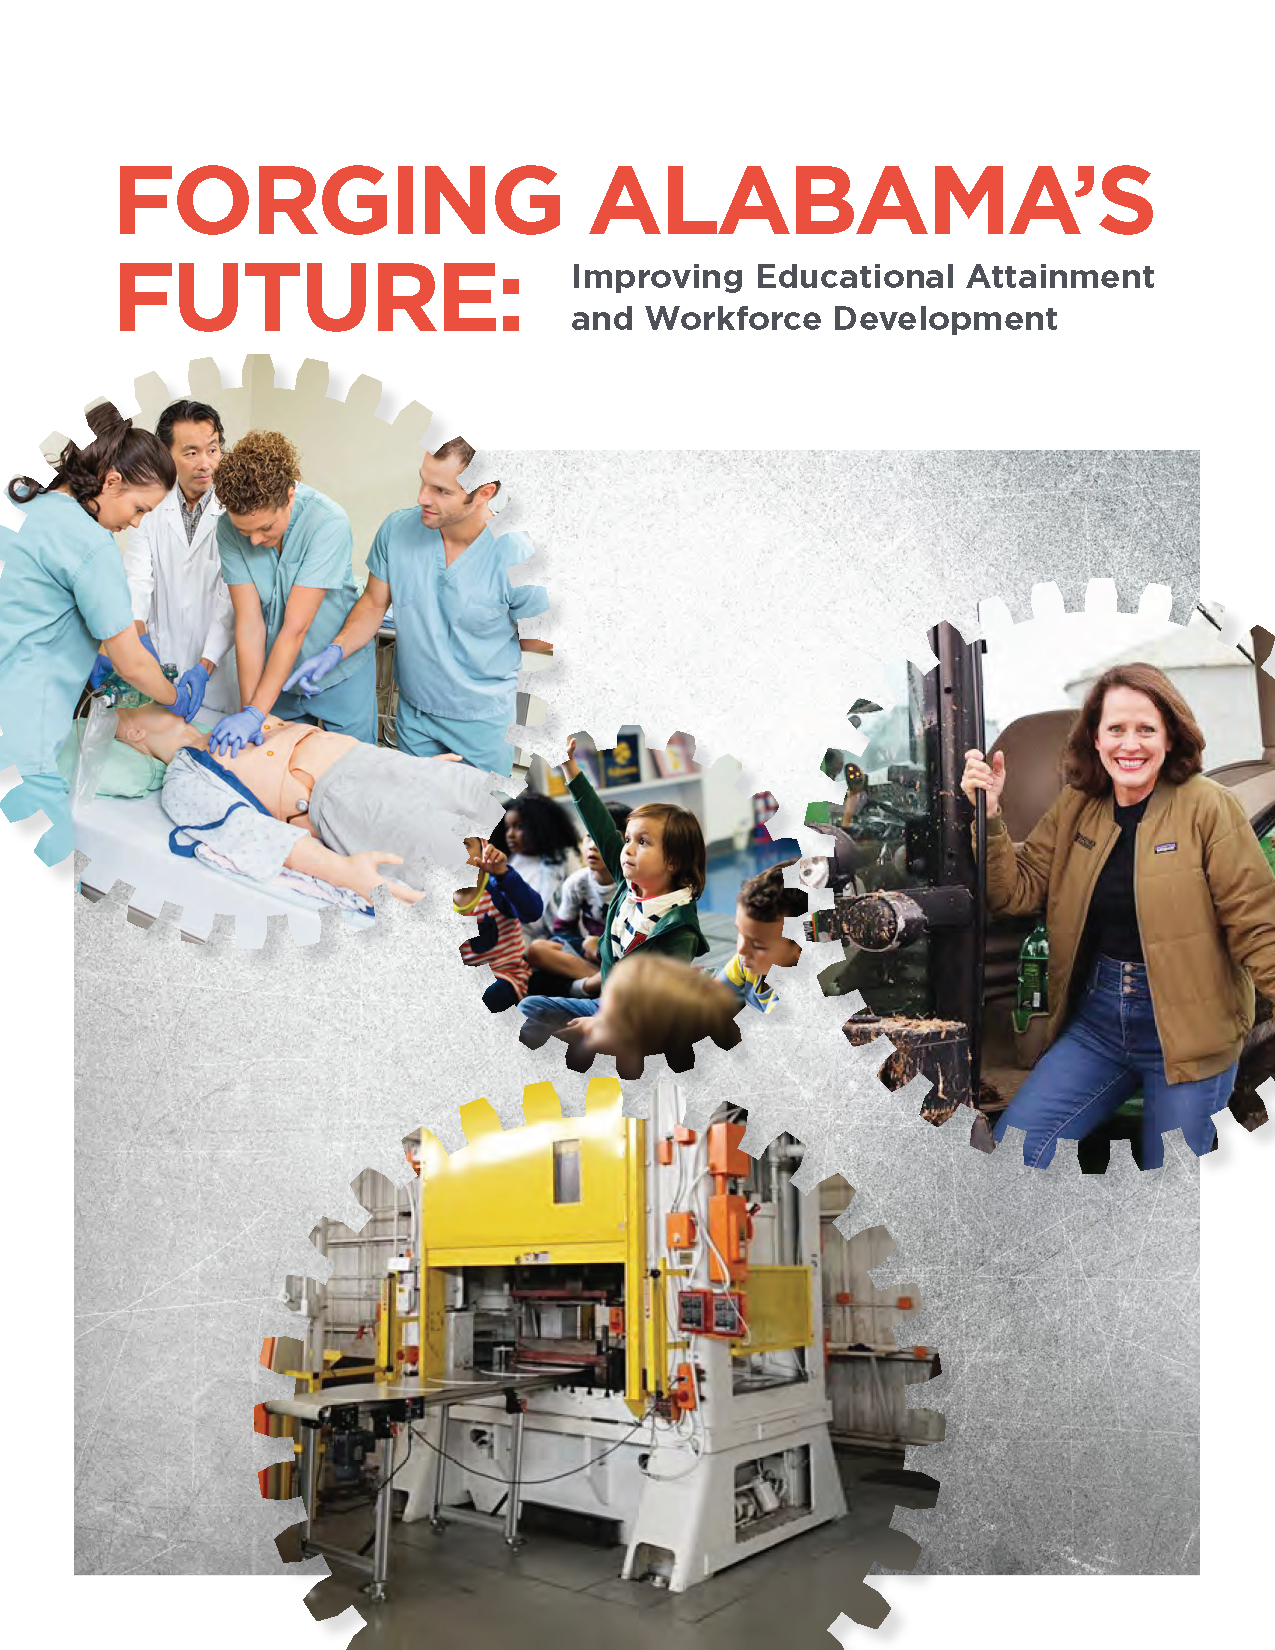
New Business Education Alliance Report Calls for Historic Investments in Education and Workforce
The recovery from the pandemic presents an opportunity for Alabama to regain momentum by investing in proven strategies for improving reading, math, and college & career readiness argues a new report commissioned by the Business Education Alliance, a non-profit formed to unite business and education around shared priorities. The Public Affairs Research Council conducted research for the report, Forging Alabama’s Future: Improving Educational Attainment and Workforce Development.
“Alabama must do more to help students prepare for success after high school graduation,” said former State Superintendent Joe Morton, the chairman and president of the Business Education Alliance of Alabama.”
The pandemic led to a drop in college-going and a slowdown in the number of students graduating with career-ready credentials. Alabama has set a goal of raising levels of educational attainment since higher levels of educational attainment lead to higher earnings and higher rates of workforce participation.
Despite low unemployment and high demand for workers, the percentage of Alabama’s population working lags behind other states. “If the state’s labor participation rates were on par with the national average,” Morton said, “not only would more Alabamians be working, but wages would be increasing, poverty would be going down, and businesses currently struggling to find help would be more likely to have the support needed to thrive. But, to meet this target, Alabama must work harder and smarter than our neighboring states.”
The report describes the mutually reinforcing goals and strategies set by the governor, the state Department of Education, and the Alabama Workforce Council. Those goals include reaching the national average on the National Assessment of Educational Progress (NAEP) in both reading and math by 2026. Alabama’s strategies for meeting those goals will be the focus of PARCA’s Annual Forum, March 11, 2022. The program features national and state experts, Alabama Superintendent Eric Mackey, Mississippi’s Superintendent Carey Wright, and Gov. Kay Ivey.
“PARCA believes that setting goals, implementing and sustaining research-based strategies, and assessing progress toward those goals is the pathway to improvement,” said Ryan Hankins, the executive director of the Public Affairs Research Council of Alabama. “Our students and teachers succeed when we set high expectations and sustain the resources necessary to achieve them. The interdependent initiatives described in this report will require patience, commitment, and the courage to change. But we’ll all benefit from their success.”
Fewer Freshmen Assigned to Remedial Education
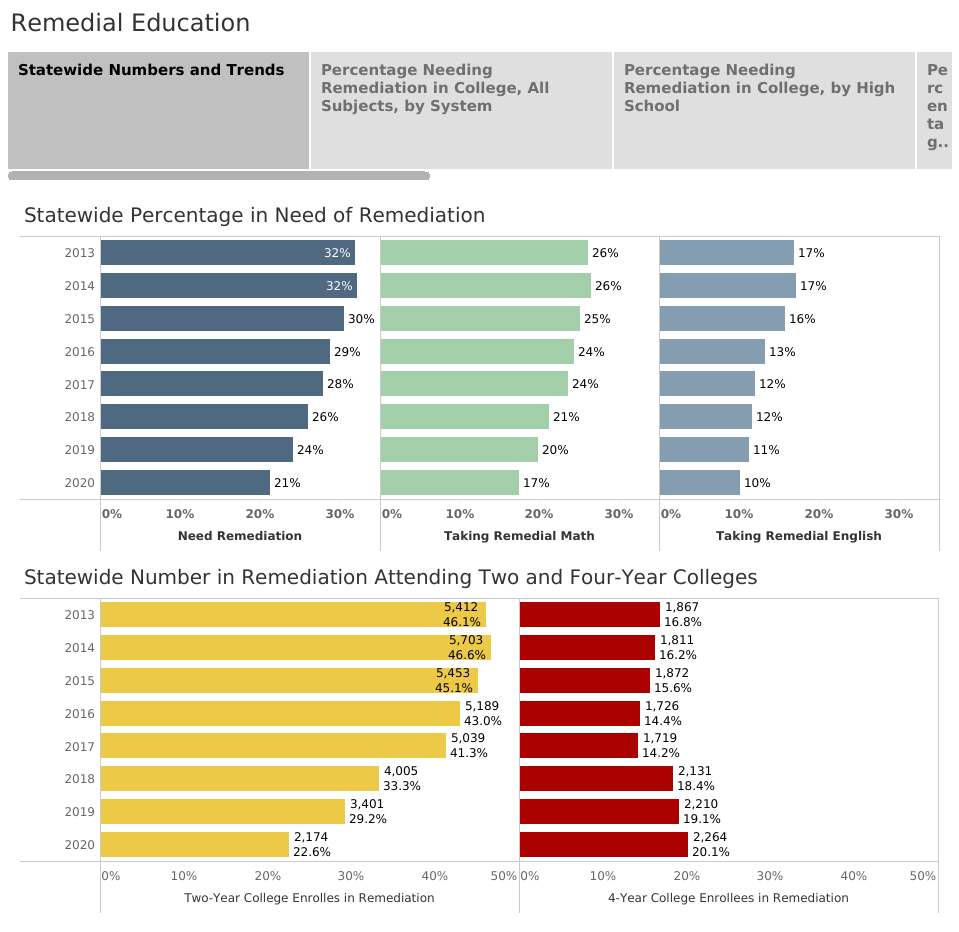
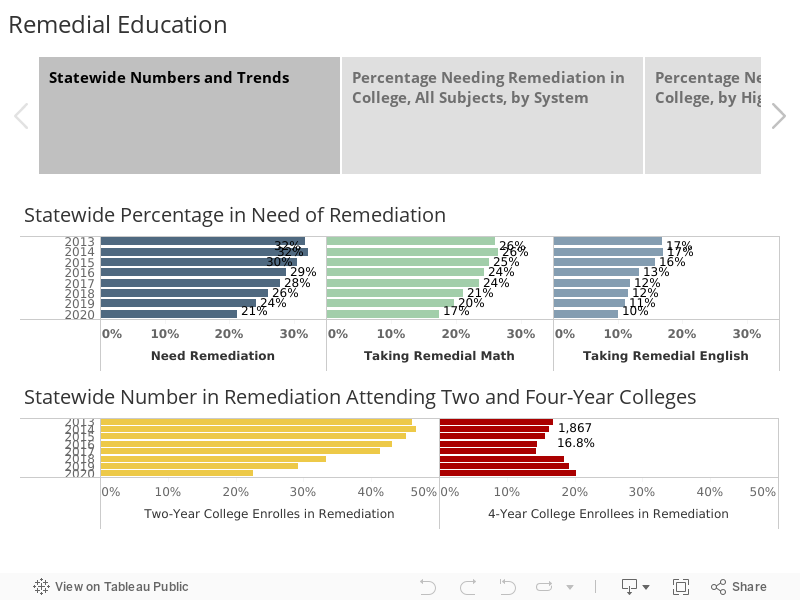
Despite the disruptions of the pandemic, Alabama high school graduates who entered college in 2020 were less likely to be assigned to remedial education and thus should be in a better position to succeed in college. The new figures released by the Alabama Commission on Higher Education (ACHE) show a continued decline in the number and percentage of students taking remedial classes in their first year, particularly among those entering community college.
Some of the declines might be attributable to fewer students going to college after high school. Only 54% of the Class of 2020 went on to college in the year after graduating high school, down from college-going rates above 60% in recent history. However, because the remediation rate among those who went to college was down and the decline in rate was concentrated at community colleges, the numbers indicate that the new approach to remedial education instituted by the two-year college system is working.
Remedial classes are non-credit college courses covering material students should have learned in high school. A student taking a remedial class is paying for a course that won’t count toward a degree. Low-income students can use Pell grants to help pay for the courses, but that can also lead to an exhaustion of Pell eligibility before degree completion. That extra cost and delay in progress are known to lower completion rates for students assigned to remedial education. High schools have been urged to improve preparation for college-bound students, which may account for some of the improvement over time. Still, since much of the drop has been in community colleges, the success in recent years points toward innovations in policy at the two-year schools.
Community Colleges Providing Alternatives
Alabama’s Community College System (ACCS) alternative to remediation has not only decreased the number of students being placed in remedial courses, but the colleges have also seen a rise in passage rates in their college-level math and English classes.
In 2018, The Alabama Community College System (ACCS) made system-wide changes designed to reduce the number of students enrolled in remedial courses (also known as developmental courses). Students were still assessed for their levels of academic preparation upon enrollment, but instead of being assigned to either regular or remedial courses, the system created other options. Students who needed extra support could be placed in a tutorial course alongside college-level math or English. Since the change, the number of students in remedial classes has declined, but the percentage of students passing gateway English and math has increased.
Meanwhile, the number of students assigned to remedial courses at four-year colleges has increased modestly. For years, the bulk of remedial education took place in the community college system. Now the number of students taking remedial classes is about equally divided between two and four-year schools. More students are assigned to remediation in math than in English, though the gap has narrowed as both rates have declined.
The report data from ACHE provides feedback to high schools about how prepared their graduates are. Use the tabs and arrows in the visualization to explore the data. Compare the performance of graduates from your local high school or system to other systems or schools.
This remediation data is the final dataset that looks back on students who graduated in the Spring of 2020. For that school year, PARCA previously published analyses of performance on ACT and WorkKeys, graduation and college and career readiness, and on college-going.
Progress Toward an Educational Goal
Decreasing the number of Alabama public high school graduates needing remediation in college was a goal identified in Alabama’s strategic plan for education, Plan 2020, adopted in 2012.
Remedial education is considered a waste of money for both the state and the individuals paying for higher education. Remedial courses cover material that should be learned in high school. Remedial classes cost students tuition and fees but do not produce credits that count toward graduation. By avoiding remedial courses, students can complete college work more quickly and at less cost.
Are entering college students better prepared?
Since 2012, Alabama has pursued multiple strategies to improve K-12 education and produce high school graduates better prepared for college and careers.
Most directly tied to college preparation, the state has increased support for dual enrollment, which allows high school students to take courses at colleges, and for Advanced Placement courses, college-level courses taught by high school faculty members.
Despite those efforts, scores for Alabama high school graduates on the ACT, the college-readiness test given to all students, have been flat to slightly declining. And while the number of students assigned to remediation has decreased in the two-year system, as noted, the number of remedial students has risen at four-year colleges.
Conclusion
Remediation is needed for students enrolling with a major gap in their readiness for college. Given the open admissions policy in the two-year system and for some four-year colleges, remedial courses continue to play a role in higher education. For others who need some help rising to the level of college coursework, it benefits students and schools to provide alternatives to remediation. The most straightforward solution is to improve preparation in high school, and those efforts should continue. The two-year system’s strategy to provide simultaneous tutoring rather than sequential remedial courses appears to benefit students, increasing passing and progression rates. The model ACCS has developed should also be explored for replication at four-year colleges.
Alabama’s College-Going Rate Down Again for Class of 2020
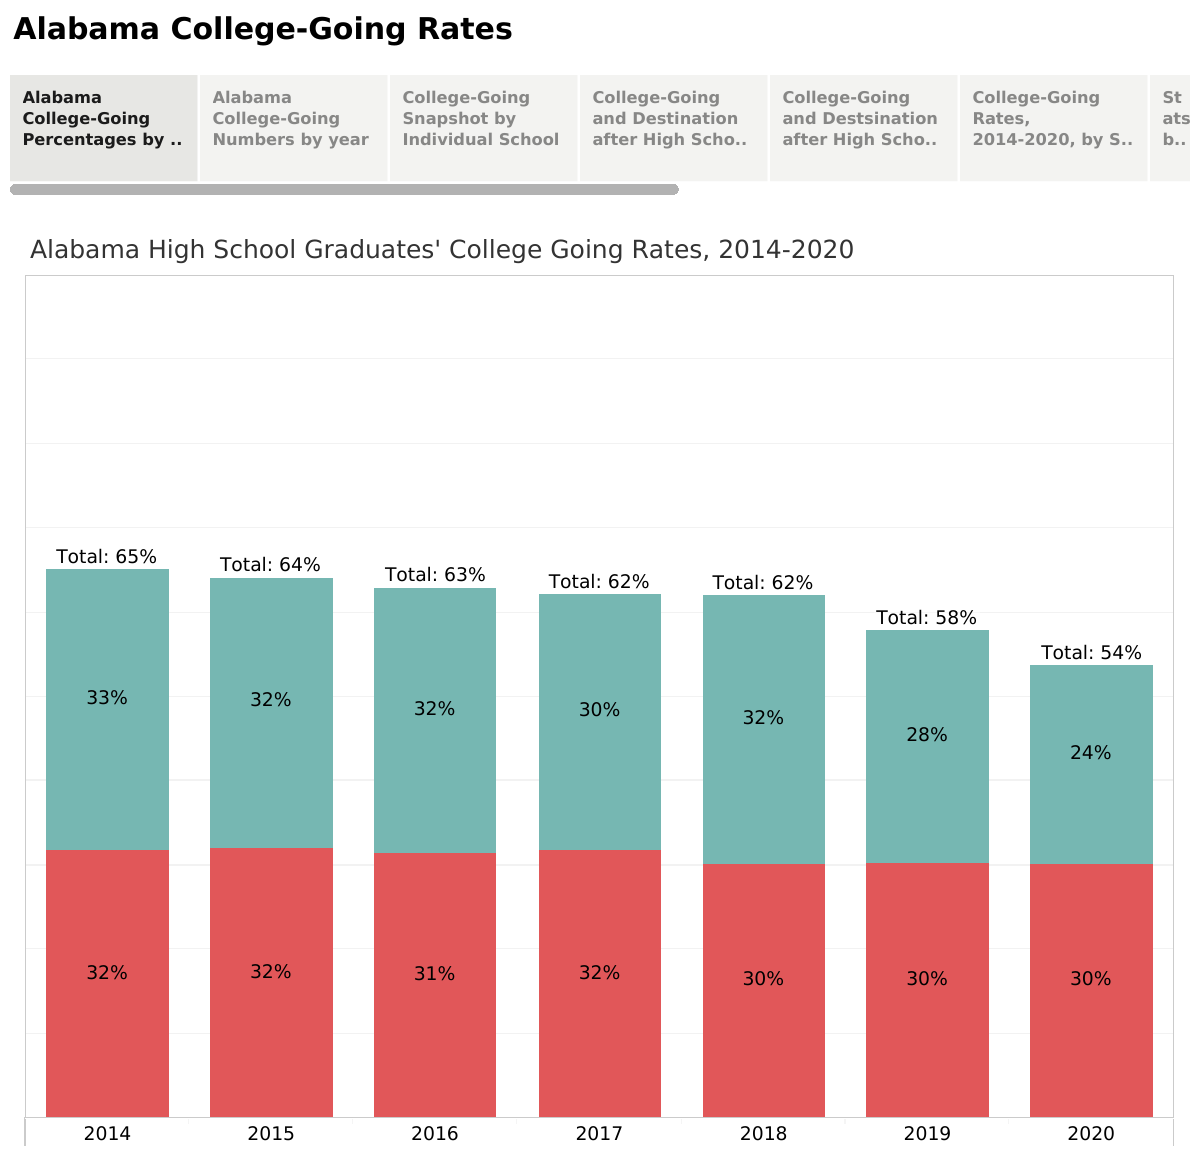
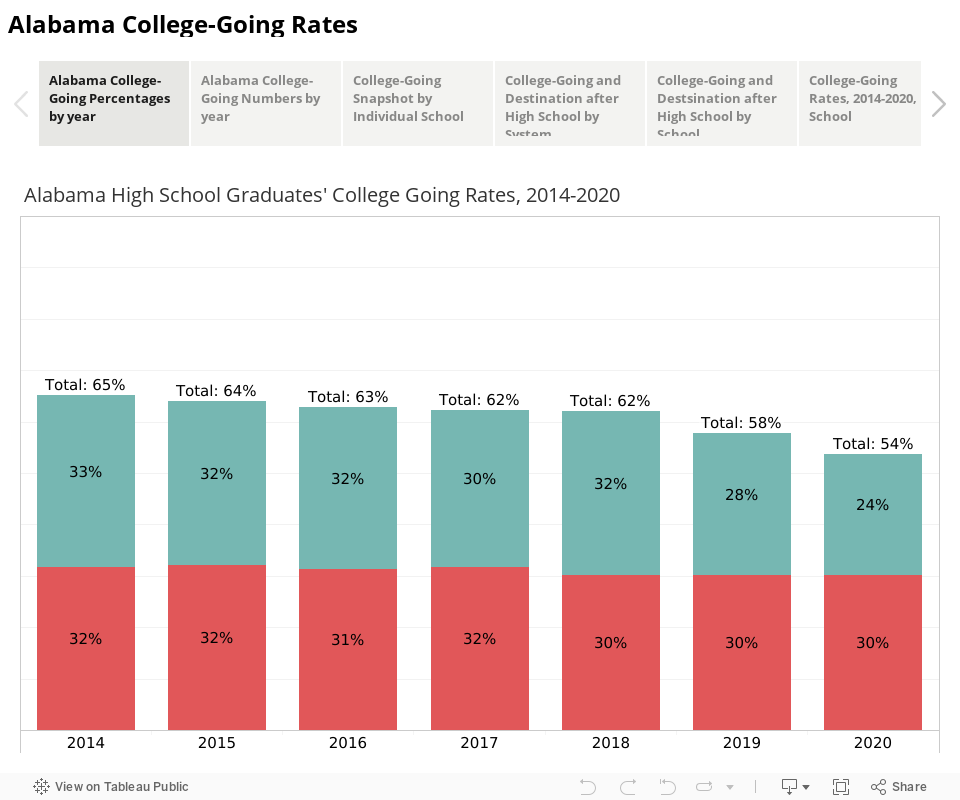
The college-going rate for Alabama public high school graduates declined substantially in 2020, reaching a seven-year low, more than 10% below the rate in 2014. A drop was expected considering the Covid-19 pandemic’s disruption to normal operations.
According to new data from the Alabama Commission on Higher Education (ACHE), only 54% of the Class of 2020 entered higher education in the 2020-2021 school year. That compares to 65% in 2014. The data is drawn from the National Student Clearinghouse and tracks college enrollment both in-state and out of state, at two-year and four-year public and private colleges and universities.
Since 2014, Alabama’s high school graduation rate has climbed rapidly. That’s led to a larger pool of graduates but also a growing share of individuals earning a high school diploma but not continuing on to college. In 2020, 23,369 out of the 50,514 high school graduates, or 46%, were not found to be enrolled in higher education the year following graduation.
Enrollment at four-year colleges and universities held up surprisingly well in 2020: 15,183 Class of 2020 graduates, or 30%, enrolled at a four-year school. That was despite the online classes and pandemic-related restrictions. That was down slightly in numeric terms, 193 students down from the 2019 total. It was down only slightly in percentage terms because the number of high school graduates was down as well.
The real drop came in the Alabama Community College System (ACCS). Only 24% of Alabama’s 2020 high school graduates, or 11,858 students, enrolled at a two-year college. In the recent past, 30% of graduates enrolled at community colleges. In 2018, a highwater mark, over 16,000 new high school graduates enrolled in community college after graduating high school.
The enrollment declines at the community college level have been taking place across the country. It may stem from the fact that a greater share of community college students are from economically disadvantaged households, and in 2020, the climate of economic uncertainty likely kept some from committing to embark on a college education.
Community colleges had already been experiencing lower enrollment numbers in the year preceding the pandemic but for the opposite reason: When the job market is strong, as it was in 2019, more graduates go straight into the workforce. When unemployment is high, enrollment tends to rise at community colleges, but that didn’t happen in 2020. This fall, community college enrollments hint at some recovery. Preliminary fall enrollment for 2021 points to some recovery at community colleges in Alabama, with total enrollment up 5.6% compared to 2020. But that’s still down 7.8% compared to 2019.
ACCS officials said that because high school students didn’t finish the 2020 school year physically present at school, two-year colleges missed a traditional window for recruiting students. Applications for federal financial aid (FAFSA) were down significantly, as well. With students away from school, k-12 counselors and community college representatives were unable to make a final push for completion. The resources the FAFSA process unlocks often are a deciding factor for students as to whether they can afford to attend.
As schools return to more normal operations, it is hoped that a yearlong push for FAFSA completion and a return to traditional models of student engagement and recruitment will increase college enrollment. ACCS is also partnering with the American Institutes for Research (AIR), the Alabama State Department of Education, Alabama Possible, and ACHE on an experiment testing whether text messages can help students enroll and succeed in college. The grant-funded project aims to keep high school seniors from dropping through the cracks in the summer between high school graduation and the fall semester of that year. Participating students will receive text messages reminding them to complete specific tasks related to college admission and course registration. The data will be analyzed to measure the impact of participation.
Importance for Attainment
The post-graduation trajectory of the state’s high school graduates is important. Alabama has set a goal of improving its level of educational attainment. Producing college and career-ready graduates and propelling them into advanced technical training or toward college degrees is a key priority. The labor market is increasingly demanding higher levels of training and education. Higher levels of educational attainment are associated with higher incomes, lower unemployment, better health, and longer life.
Alabama’s high school graduation rate was 90.6% in 2020, down slightly from the record 92% in 2019. ACHE followed 50,410 high school graduates and found:
27,041, 54%, enrolled in higher education
15,183, 30%, enrolled in four-year colleges
11,858, 24%, enrolled in two-year colleges
23,369, 46%, were not found to have enrolled
90% of enrollees went to a college in Alabama
91% of enrollees went to a public college
College-Going Patterns
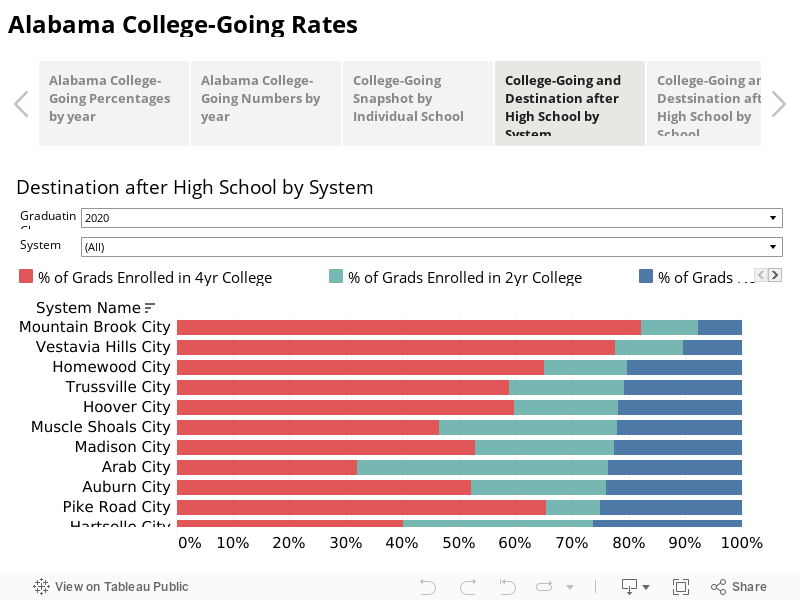
Magnet schools and suburban school systems send higher percentages of students to four-year colleges.
Birmingham’s magnet high school, Ramsay, ranked No. 1 in the state with 93% of its graduates going to college in 2020, most to a four-year university. Three Montgomery County magnet high schools ranked in the top 10 for college-going. Suburban high schools like Mountain Brook, Vestavia-Hills, Hewitt-Trussville, Homewood, and Hoover also rank in the top 10.
Some rural and non-metro counties and systems achieve high college-going rates based on high enrollment in the local community college.
Muscle Shoals and Arab ranked in the top 20 for college-going due to the strength of their community college enrollments.
Rural counties isolated from population centers and urban high schools in high poverty neighborhoods tend to have the lowest college-going rates.
Outliers
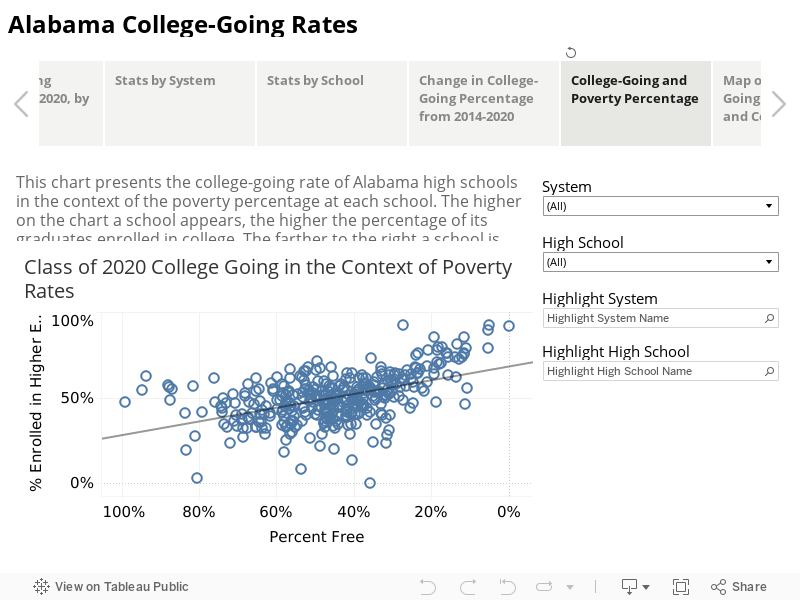
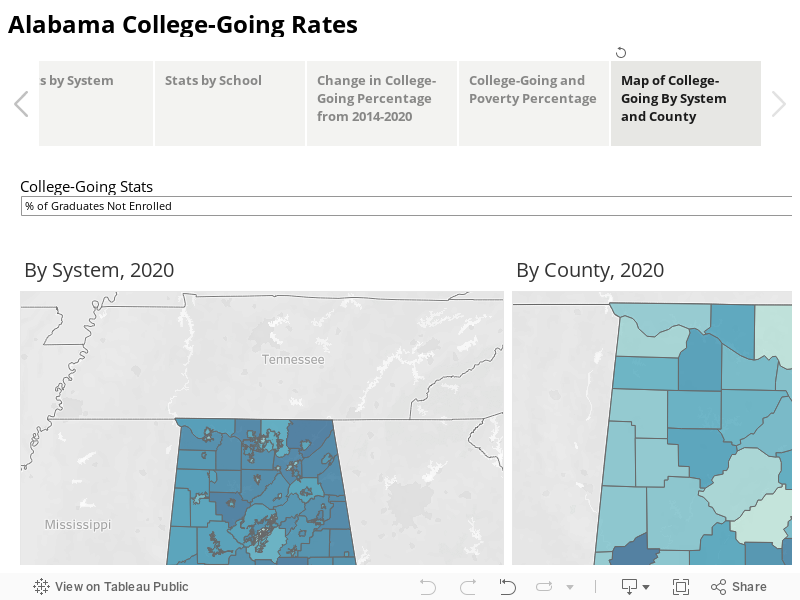
While generalizations about performance can be made, some schools are outliers. The chart below compares Alabama high schools’ college-going rate (the vertical axis) with the student body’s poverty rate (the horizontal axis). The higher a school is on the chart, the higher the percentage of students who leave high school and enter college—the farther to the right on the chart, the lower the level of poverty. The slanted line in the middle is the average of the values, which forms a line of prediction. In general, the college-going rate rises as the student body poverty rate gets lower.
However, some schools outperform the level at which they would be predicted to perform based on the economic status of students. In 2020, examples included high schools like Amelia L Johnson High School in Marengo County (94% qualifying for free lunch; 63% of graduates entering higher education), Pickens County High (76% free and 61% in higher education), and Sweetwater High, also in Marengo County, (50% free and 72% entering higher education).
The tabs above the chart allow navigation to a variety of measures of college-going and educational attainment at the school, the system, the county, and the state level. The statistics are presented in graphics, tables, and maps.
Alabama Tax Revenues Surge in 2021
By the end of FY 2021, Alabama tax collections had grown at their fastest pace in recent history, fueled by economic recovery from pandemic shutdowns and by unprecedented injections of federal stimulus for governments, businesses, and individuals.
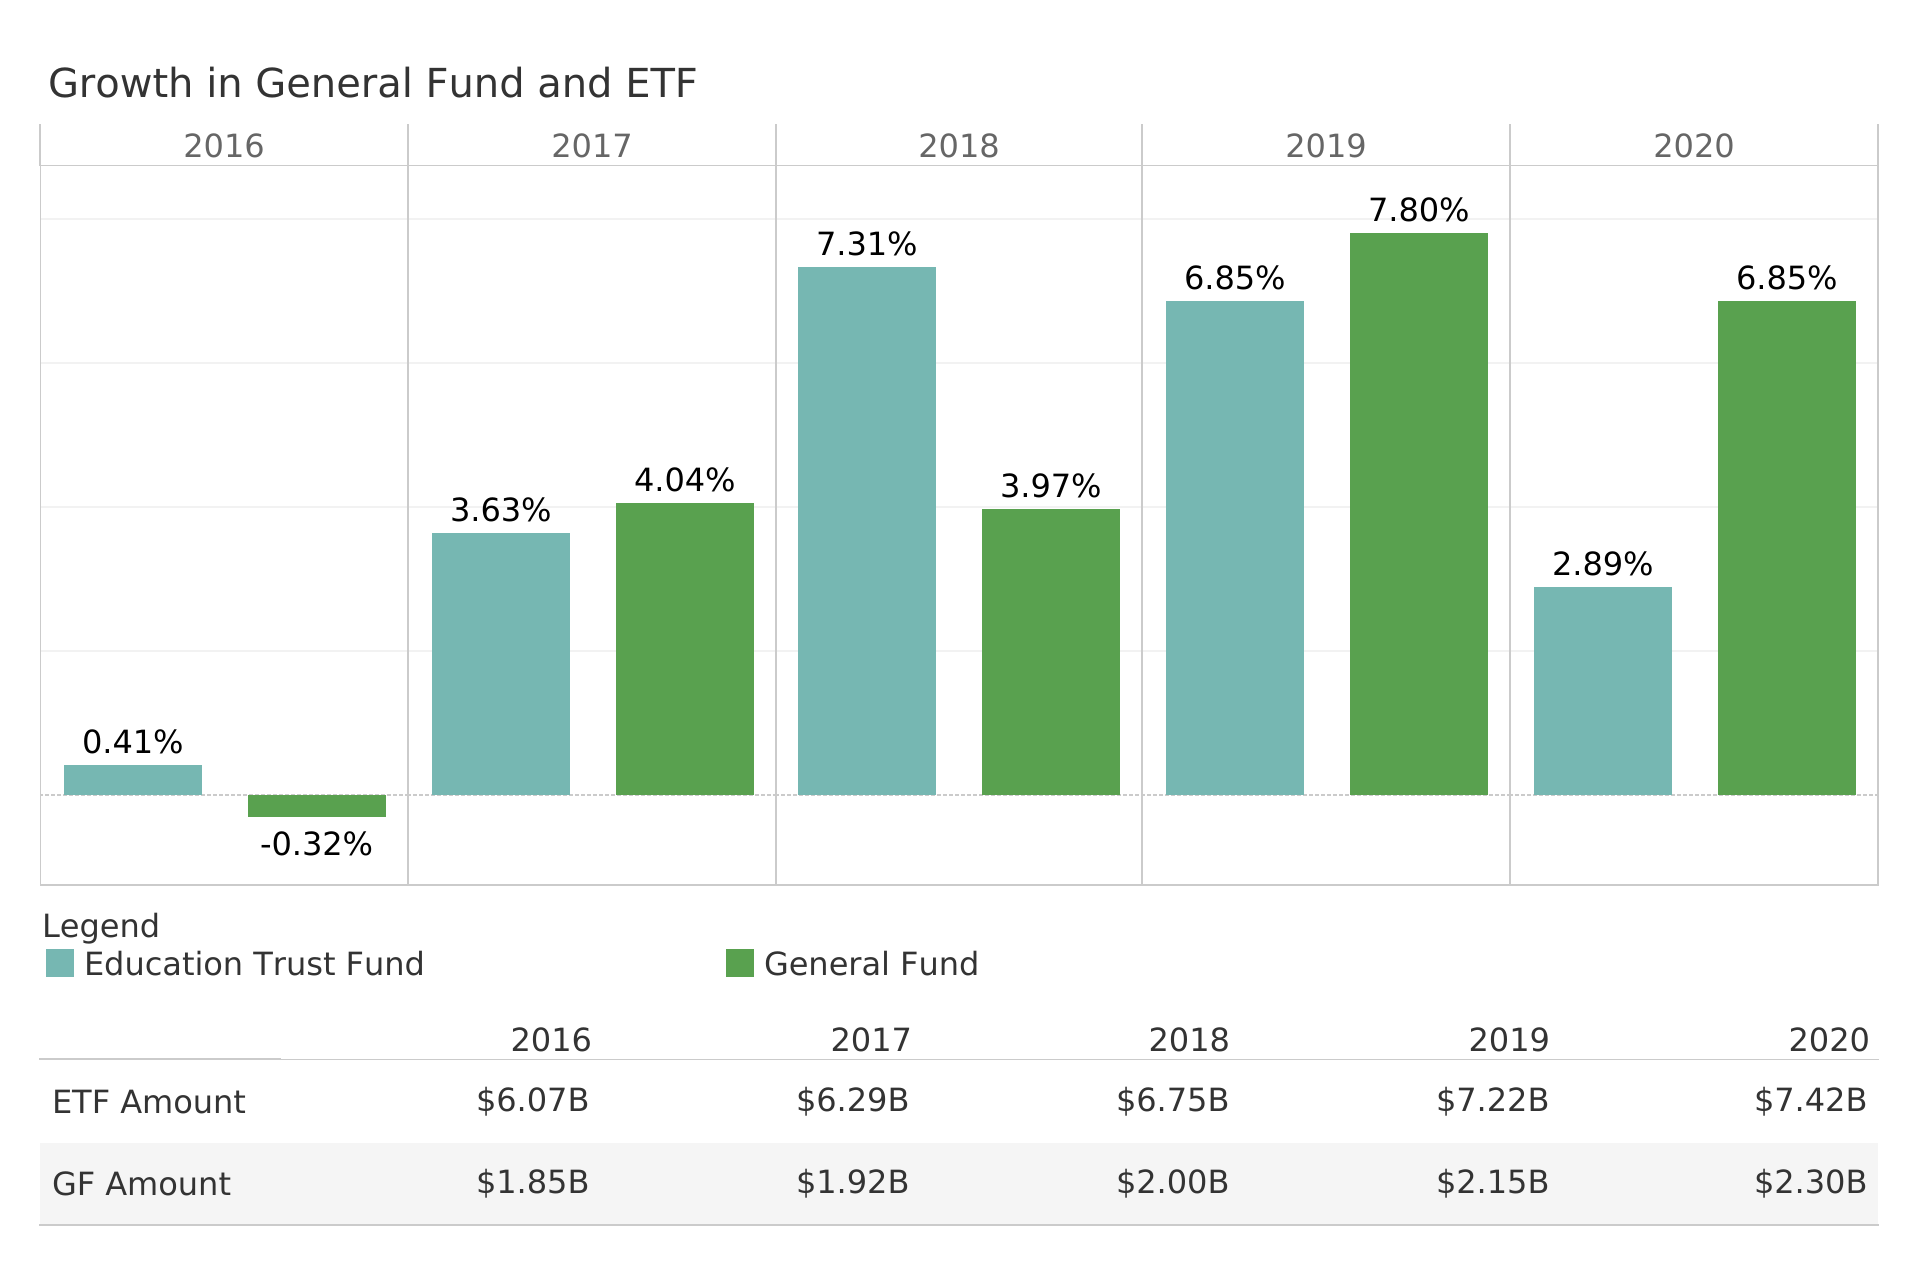
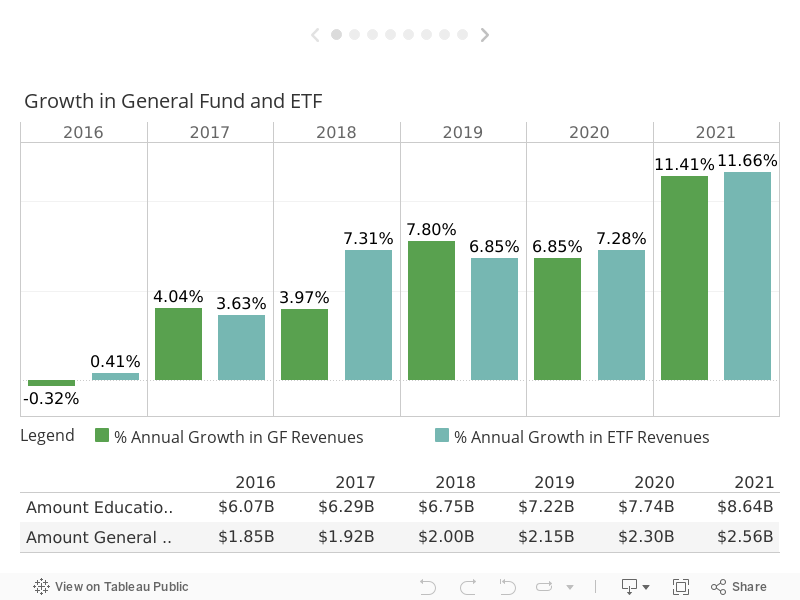
For the fiscal year that ended September 30, both the Education Trust Fund (ETF) and the General Fund grew by more than 11%, compared to historical averages of 3.5-3.7% for the ETF and 2-2.25% for the General Fund. Alabama’s percentage gain in tax revenue since the pandemic crash ranks 7th among the states, according to an analysis by the Pew Charitable Trusts. The growth rates far exceed any year since at least 1995.
However, it is important to remember the growth comes in comparison to FY 2020, a year in which COVID shutdowns constrained growth. During FY 2021 (from October 2020 — September 2021), businesses were open throughout the year, though some were still affected by restrictions related to the virus.
The growth is also taking place in the context of rising inflation, meaning the revenue is based on higher prices, and the money collected won’t have the same purchasing power it previously did. Regardless, the growth was substantial.
The ETF took in $900 million more than in FY 2020, topping $8.6 billion. And that understates the gain. FY 2020’s total included over $300 million borrowed from the Budget Stabilization Fund for cash flow purposes. That money was returned to the fund later in 2020.
The General Fund took in almost $2.6 billion, an increase of $262 million over last year.
Where did the growth come from?
Based on estimates from the Federal Funds Information for States, Alabama budget analysts estimate that $30 billion in federal relief flowed to individuals and businesses in Alabama. In addition, $16 billion in federal relief was authorized and is in the process of flowing through the state out to agencies and local governments.
That extra money in the hands of consumers fueled spending. Gross sales tax collections increased almost 15%, driven by multiple rounds of economic stimulus payments to individuals and parents with children. Spending was also boosted by unemployment benefits, which provided roughly twice the minimum wage. For some laid-off workers, the benefits amounted to a raise. Aid from the paycheck protection program kept businesses solvent and employees on payrolls.
While the bulk of the sales tax is deposited in the ETF, the General Fund also benefited from the increased spending and changed consumer patterns. The Simplified Sellers Use Tax (SSUT), the tax on online sales, rose almost 40% over 2020 totals (and 2020 was 99% higher than 2019). The Legislature’s decision to deposit the bulk of the SSUT into the General Fund added a growth element to the General Fund that had been lacking. Instead of lurching from crisis to crisis, the fund has kept pace with the rising costs.
Gross individual income tax collections were also up, increasing 13%, despite the fact employment levels haven’t reached pre-pandemic highs. By the beginning of FY 2021, employment levels had rebounded to about 60,000 short of March 2020 employment. Since then, they have continued at that level. Meanwhile, wages have been on the rise as businesses seek workers in the face of a shortage of workers.
Surpluses and Temptations
Thanks to the additional revenue, the state covered the 2021 ETF budget and ended with a balance of $1.24 billion, which will be available for lawmakers when the lawmakers convene in 2022.
The General Fund ended with a surplus of $368 million, which has already been put to use, appropriated as part of the funding for new prison construction.
The surge in state tax dollars has come along with a surge in federal support for state government operations as well. In a typical year, federal funds provide almost the same amount the state raises in taxes. But with the pandemic, the U.S. government sent an estimated $17 billion in relief funding to Alabama to schools, hospitals, and other agencies. Some of that is flowing through the appropriation process, but much of it is flowing directly to the agencies, making it difficult to know whether it has been spent yet or not.
The danger comes when those federal relief funds dry up. Growth will taper. State agencies receiving federal relief cannot count on that level of funding to continue. Legislators will convene in 2022, in an election year, with a lot to spend. But they will also have to keep an eye toward an unpredictable future and not commit to unsustainable levels of recurring expenses.
Thus, it’s useful to look for clues in the FY 2021 collections.
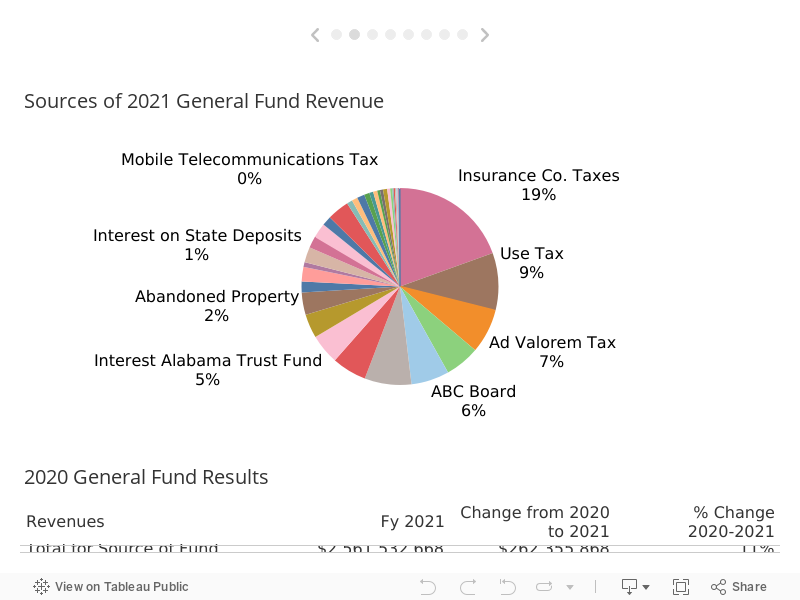
General Fund Revenue Sources
A myriad of tax sources supports the General Fund. Traditionally, most of those sources saw little growth from year to year. The General Fund struggled to keep up with rising expenses in non-education expenses, like funding for prisons and the Medicaid program.
However, in recent years, some growth taxes have been added to the General Fund, and its rate of growth has been similar to the Education Trust Fund. Since 2017, General Fund receipts have increased 33%, while ETF receipts have increased 37%.
Big gainers
Insurance Co. Taxes: The largest tax in the General Fund, the tax on insurance premiums, contributed close to $500 million to the General Fund, increasing by $77 million or 19% over 2020 collections. As insurance rates go up, and as more people take out insurance, the tax brings in more. Also, $30 million of the tax had been going to the ETF. That ended with a law change in 2019, increasing the yield to the General Fund.
Simplified Sellers Use Tax: The SSUT continued a string of huge gains as the shift to online sales continued in FY 2021. An additional $55 million came in from this source, an increase of 39% over 2020 (In 2020, the increase was 99%). It has quickly grown into the third-largest source of revenue in the General Fund at $192 million. That represents 75% of the tax. The remaining 25% goes into the ETF. Some of the growth may be attributable to new retailers submitting the tax. Still, this year’s growth is likely attributable to both the increased spending power of consumers because of stimulus and rising wages and to the continuing shift to purchasing online for home delivery. Considering the decreased threat of Covid, the tax is expected to grow more slowly in the future.
Financial Institutions Excise Tax: Coming off a down year in 2020, this tax source jumped by $55 million, an increase of 156%. The big jump is attributable to a new law in 2019 that required banks to make payments quarterly rather than in a lump sum. It also changed how the tax amount due was calculated, bringing it more in line with the federal definition of taxable income. The big surge in collections was not expected, as the law changes were expected to be revenue-neutral. State budget officials think the shift in the schedule for payment of the tax may have resulted in a surge of revenue in FY 2021 will not continue.
Sales and Use Tax: a share of the sales tax on autos and boats is distributed to the General Fund, and each of those lines was up by more than $25 million, thanks to the strong demand and rising prices for both.
ABC Board: Liquor sales continued a rising trend posting a 12% gain over 2020, a year when ABC proceeds climbed by 14%. This may result from a continuing shift toward purchase for home consumption, as restaurant and bar operations continued to be somewhat curtailed in FY 2021. The revenue sent to the General Fund from the ABC sales increased to $157 million.
Mortgage and Deed Record Taxes: About $20 million additional came in through taxes related to home sales. Both prices and activity spike in 2021, reflected in a 34% increase in the mortgage tax, adding $15 million to reach a total of $58 million, and a 45% jump in the deed record tax, reaching $17 million. Continued low-interest rates led to more refinancing and home purchases.
Lodging Tax: This tax on hotels and vacation rentals was up 26% in 2021 after being down 15% in 2020, bringing in an additional $13 million compared to 2020. Gulf Coast rentals saw a record demand though some units were offline because of damage caused by Hurricane Sally in Sept. 2020. Convention and hotel traffic remained depressed compared to historic norms.
Interest on the Alabama Trust Fund: More accurately described as investment returns on the Alabama Trust Fund, the contribution from this source increased 8%, or $8 million, thanks to a strong market. Also known as the State’s savings account, the Alabama Trust Fund is at nearly full strength as amounts borrowed during previous downturns have largely been repaid.
Oil and Gas Production Tax: The oil and gas production tax was up 16%, recovering somewhat from a crash in FY 2020.
Court Costs: With the courts open again, court costs recovered some of the previous year’s drop, though FY 2021 collections were still behind 2019s. In FY 2021, proceeds from court costs contributed $60 million to the General Fund.
Big losers
Cigarette Tax: Though it remains a significant source of revenue, the cigarette tax continues to decline as smoking decreases. The taxes brought in $143 million to the General Fund in FY 2021, down by $5 million, a decline of 3%. Meanwhile, a Tax on Vapor products increased 28%, or $614,875, to $2.8 million.
Interest on State Deposits: The state earns interest on the cash it holds, but this source of revenue declined $31 million or 62% because of dropping interest rates. The state collected about $20 million from this source in 2021.
Mobile Telecom Tax: A dying tax, this tax applied to phone plans that sold talk time. For the most part, cellular plans now provide unlimited talk time at no charge but charge for data, which is not covered by this tax. Revenue continues to decline, bringing in just over $11 million, down another nearly $4 million or 26% lower than last year.
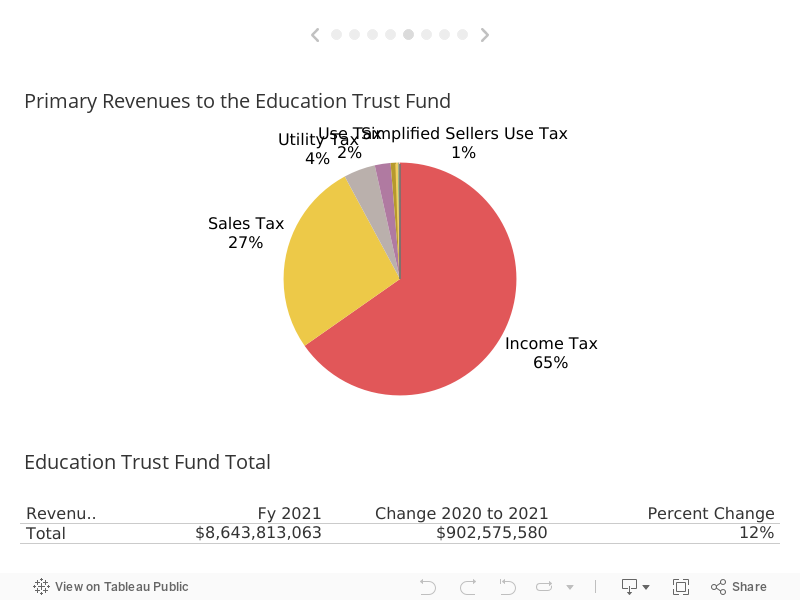
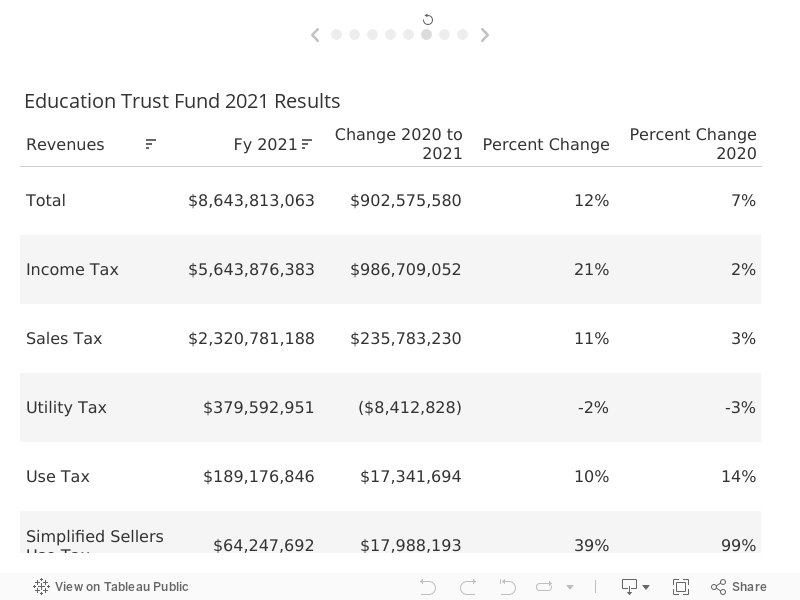
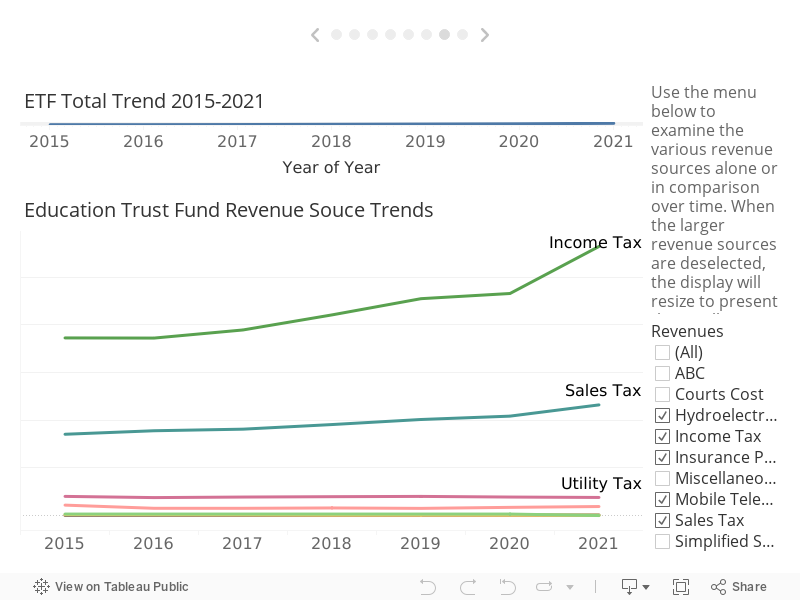
Education Trust Fund
The ETF supports K-12 schools, colleges, and universities. The state’s two largest revenue sources flow into it: the income tax and the sales tax.
Benefiting from growth taxes, the ETF has traditionally seen the most substantial ups and downs: rapid growth in good times and jarring contractions when the economy falters. However, more recently, the Legislature has spread some of the growth taxes and has imposed rules on how fast spending can grow. These restraints have thus far prevented mid-year budget cuts and have allowed the accumulation of reserve funds.
Big Gainers
Income Taxes: Net income tax deposited in the ETF was increased by a jaw-dropping 21%. The anemic growth of income taxes in FY 2020 is part of the story. FY 2021 full-year of full-time employment earnings produced a substantial gain in gross personal income tax collections, up $643 million to a total of $5.8 billion. But even more staggering was a 61% increase in corporate income taxes. Corporate income taxes increased $370 million to a total of $974 million. Explanations for such a large jump are not completely clear. Certainly, the recovering economy had businesses operating a full calendar year. Pent-up demand and the stimulus in the economy drove up sales bolstering income over a down 2020. Budget analysts also speculate that corporations may have realized more revenue in 2021 to avoid potentially higher federal taxes in 2022. After refunds and other adjustments, the income tax contributed $5.6 billion to the ETF, increasing $987 million over 2020.
Sales Taxes: The state received over $2.3 billion in sales tax revenue in 2020, and $325 million more than last year was sent to the General Fund, an 11% increase. Sales were robust at grocery and hardware stores as people continued to invest in home improvements. It’s also important to note that inflation has driven up the prices of some goods, which in turn drives up sales taxes, which are based on the total cost. With the dissipation of stimulus money, this pace of growth is unlikely to recur. But, with the pandemic under better control, activity continues to accelerate, Demand is strong. Unemployment is low, and wages are rising. That suggests income and sales taxes will continue to grow.
Simplified Sellers Use Tax: As in the General Fund, the contribution of this tax was up 40%, adding $18 million to the ETF, for a total contribution to the ETF of $64 million. The proceeds of the tax are divided, with the ETF receiving 25% and the General Fund 75%.
Big losers:
Insurance Premium Tax: Before FY 2021, $30 million from the Insurance Premium Tax was deposited into the Education Trust Fund. That ended because of a 2019 change in the law governing the distribution. The total amount is now in the General Fund.
The Utility Tax: Down 2% or $8 million, this is a tax on electric, water, telephone, and gas utilities. FY 2021 saw both a mild summer and winter and a wet one. That leads to decreased energy consumption and lower levels of water use. However, the extra rain provided more opportunities for hydropower generation, driving up receipts from the hydroelectric tax.
From the Year’s End Looking Forward
Both funds ended FY 2021 with substantial surpluses. FY 2022 budgets were built on the assumption of 3% growth over the 2021 budgets. Current conditions suggest the state should easily exceed those predictions.
Alabama is in an unfamiliar position of having to manage its way through unexpected excess revenue.
General Fund
FY 21 Budgeted $2,393,272,863
FY 21 Receipts $2,562,158,281
FY 22 Budgeted $2,637,874,471
Education Trust Fund
FY 21 Budgeted $7,217,422,487
FY 21 Receipts $8,643,813,063
FY 22 Budgeted $7,672,576,575
And that’s only part of the picture
The ETF and General Fund totals don’t even represent half the revenue that powers public agencies, state schools, universities, and hospitals. Nor does it represent the federal benefits that flow through state agencies like Medicaid, the Departments of Human Resources, Health, Mental Health, Labor, and Rehabilitation Services. The chart below gets closer to a picture of the scale of public spending in Alabama.
Reserve Fund Balances
Current conditions suggest continued recovery, But if things were to falter, Alabama has built up major reserves that are available to tap in case of an economic downturn. A recent analysis on state reserves and rainy day funds by the Pew Charitable Trusts estimated that Alabama $1.1 billion in rainy day funds or 11.2% of spending. The state could run on its rainy day funds for 41 days, Pew estimated. That puts Alabama well ahead of the 50-state median for the strength of its reserves.
ETF Budget Stabilization: $448,410,575
ETF Rainy Day: $484,979,764
ETF Advancement & Technology: $282,314,668
GF Budget Reserve: $75,303,255
GF Rainy Day: $263,994,883
Results of New Statewide Tests Tell Both Familiar and Alarming Story
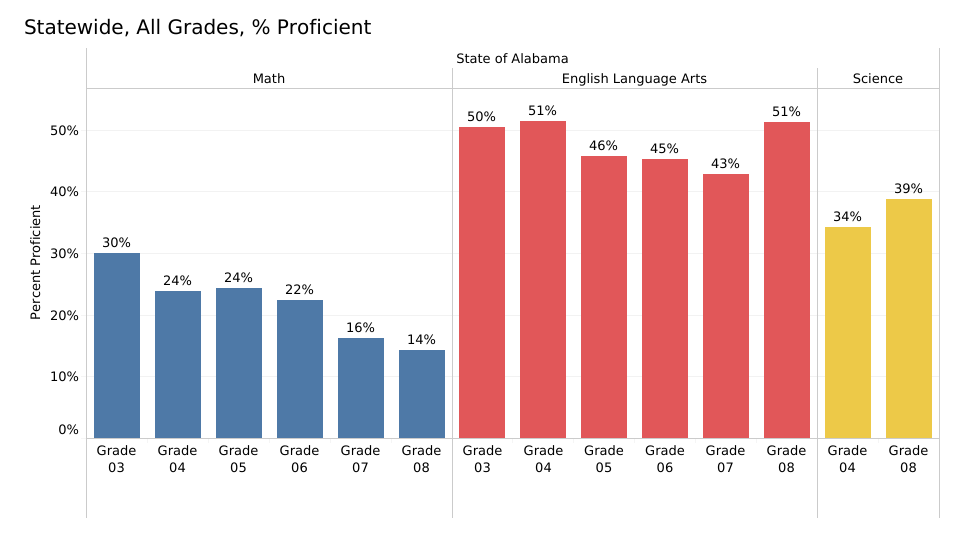
After a year and a half of Covid-clouded schooling, only about half of Alabama students, grades 3-8, scored proficient in reading, and less than a quarter reached the proficient level in math on the state’s new statewide standardized test, the Alabama Comprehensive Assessment Program (ACAP). If the Alabama Literacy Act were in full effect this year and the reading cut score was set at the level recommended by experts, 23% of third-graders taking the test, or almost 12,000 students statewide, would be in jeopardy of being held back, based on the results.
The results are both shocking and familiar. At the same time, though, it’s hard to know what to make of them.
It’s the first year of a new test, the 4th variety of statewide assessment given over the past decade (5th if you include the NAEP).
ACAP was taken in the spring of 2021, after Covid’s unprecedented disruption of the education system. A significant number of students did not have a full-year of in-person instruction.
Because of the disruption, the results are not being considered by the state accountability system. Schools will not be graded based on the scores.
Statewide, 93% of students took the ACAP, an impressive percentage considering the conditions, but participation was significantly lower in some districts.
The acheivement levels for the test have just been set and need additional evidence to establish their validity.
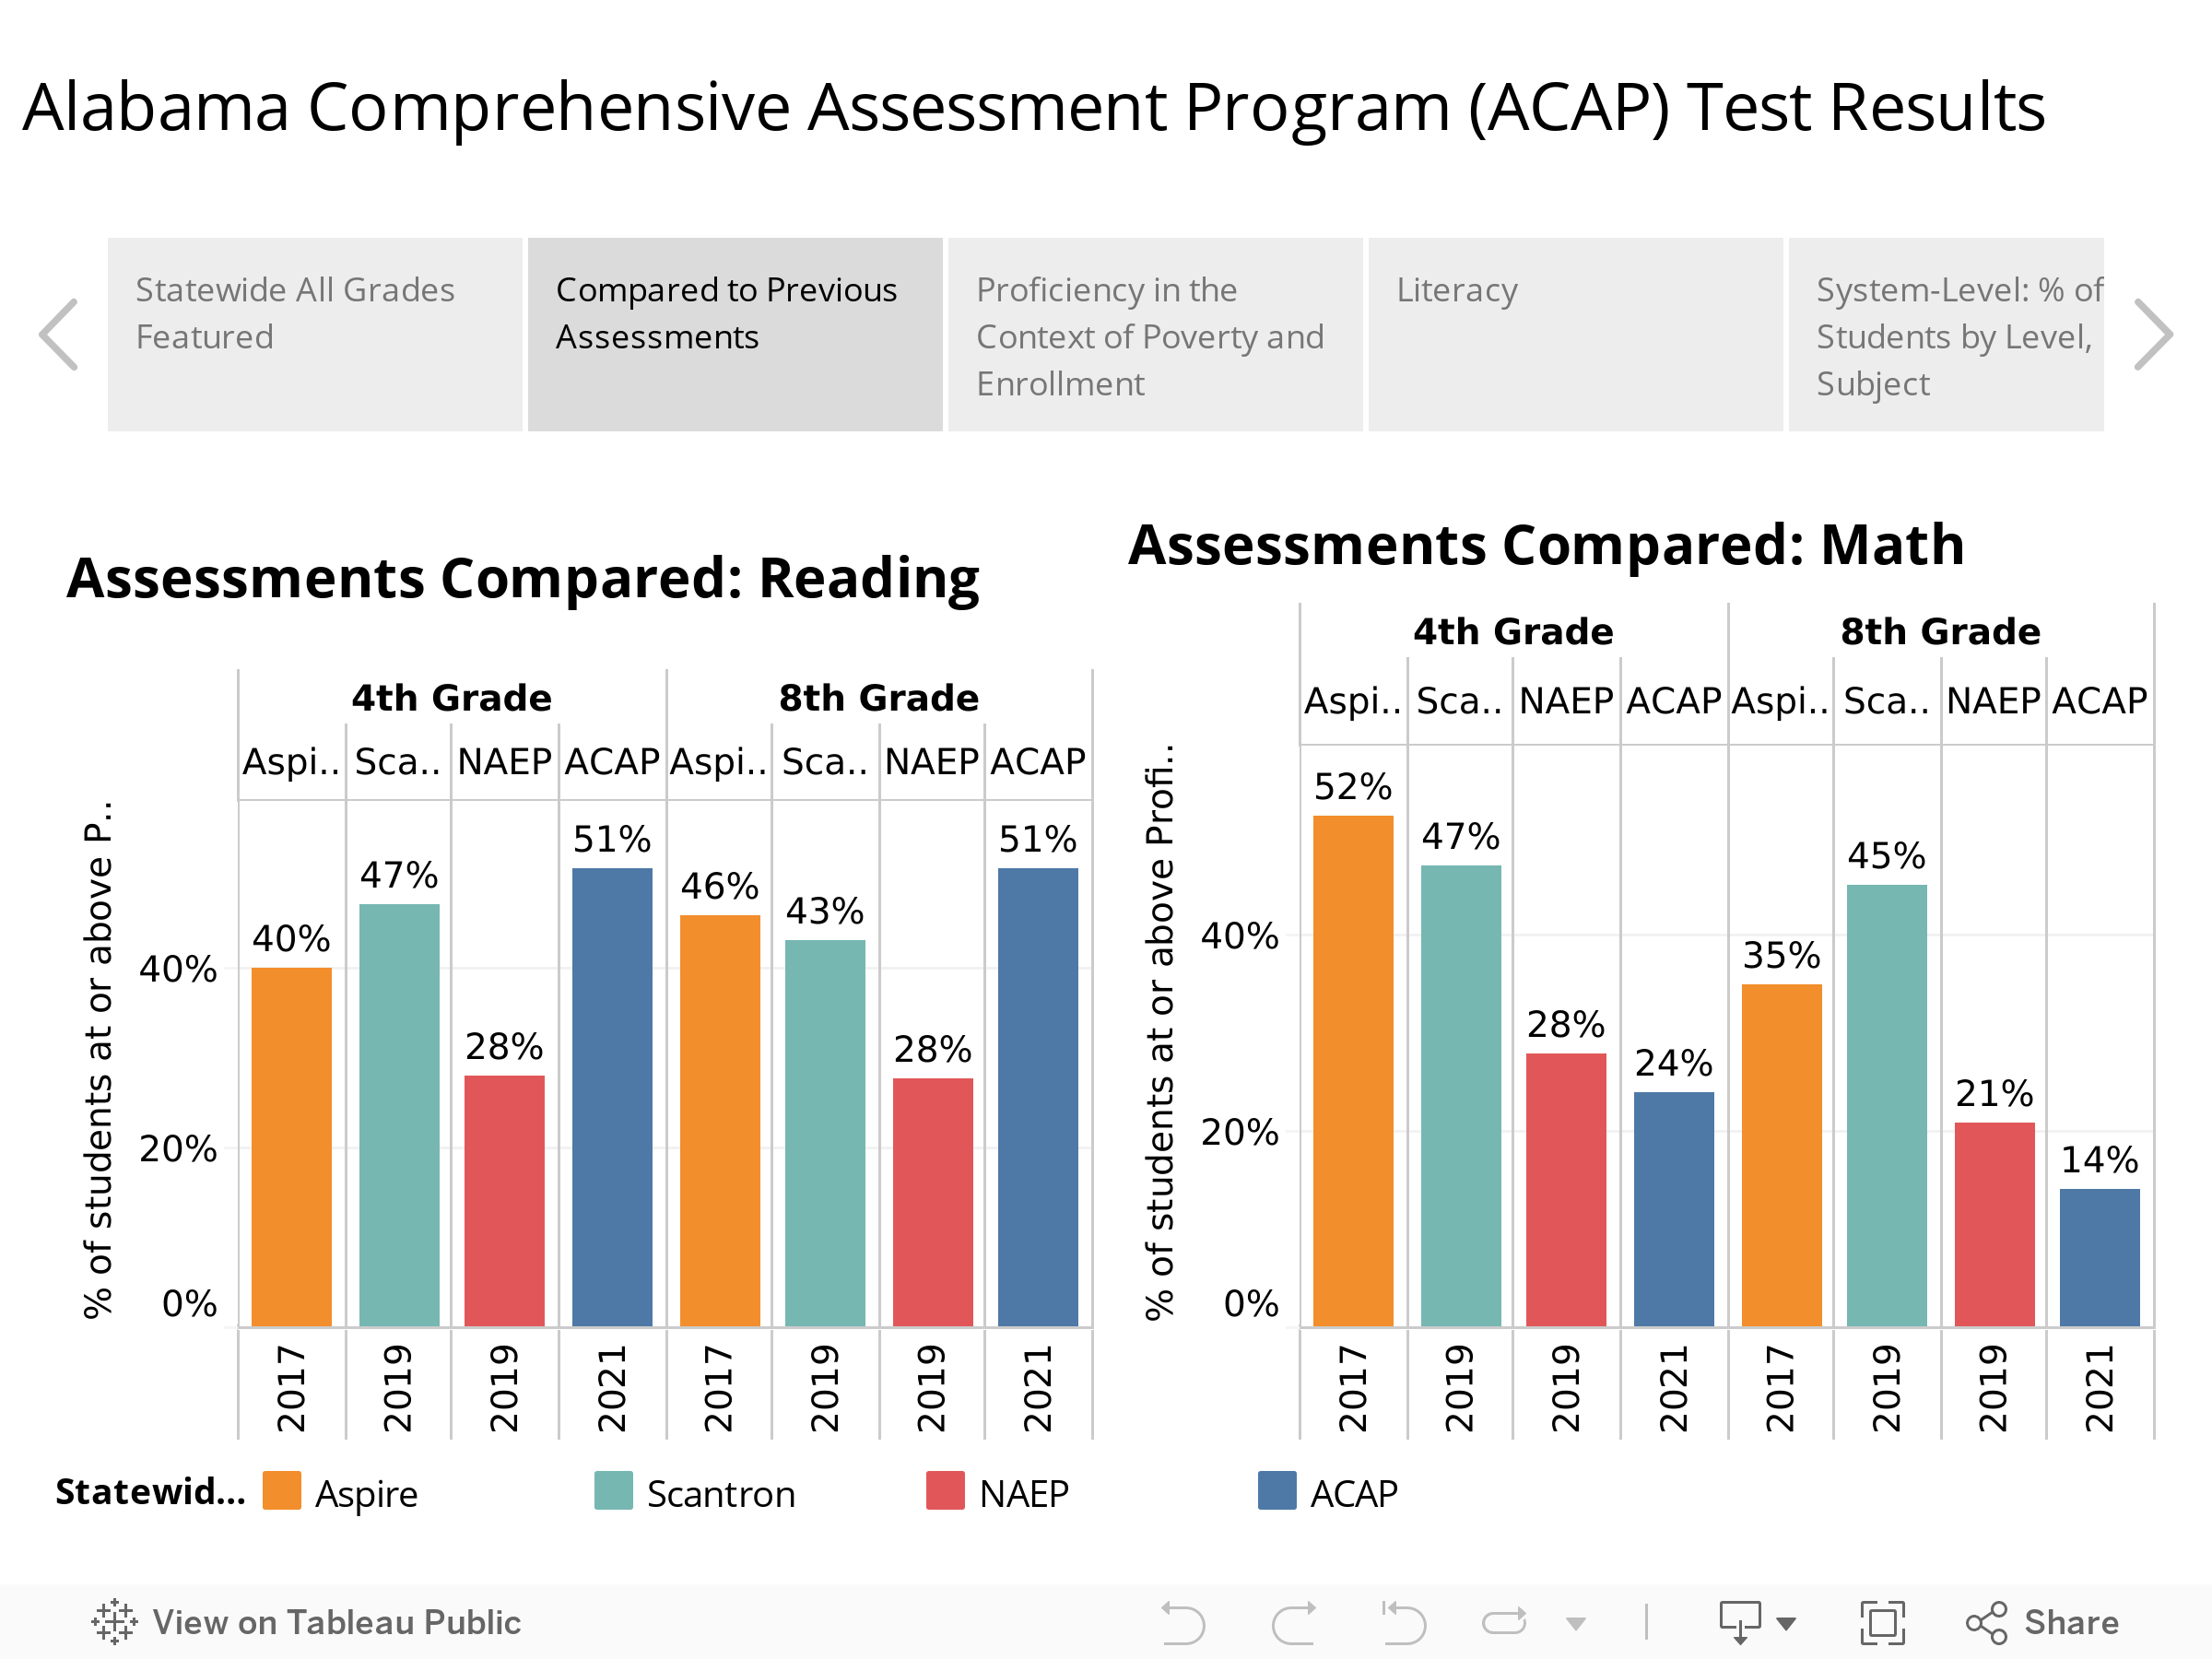
Accepting all those caveats, a deeper look shows familiar patterns. Figure 2. compares Alabama student scores on the ACAP and the two standardized tests the state has used to judge performance: the Aspire, given most recently in 2017, and Scantron, most recently administered in 2019. Also in the comparison is the 2019 National Assessment of Educational Progress (NAEP), a national test given to a representative sample of each state’s students. NAEP, also known as The Nation’s Report Card, is the only test that allows for comparison with students in other states.
ACAP results in English Language Arts (ELA) are higher but in roughly the same range as prior state assessments, with half of students proficient. However, only 28% of Alabama students scored proficient or above in reading on NAEP in 2019.
ACAP’s math percentages (24% of 4th graders and only 14% of 8th graders) are close to and even worse than Alabama’s performance on the NAEP in 2019. Alabama has consistently scored at or near the bottom on math for a decade on the NAEP. ACAP’s low math results contrast with the higher proficiency percentages generated by Scantron and the Aspire in math.
An optimistic view of the test results is that during a period of disrupted learning, students maintained progress in English and reading. The loss of in-person instruction and practice time may have done more damage in math. Regardless, the results indicate that Alabama needs to develop the same level of urgency about math as it is currently directing at reading.
Literacy Act Implications
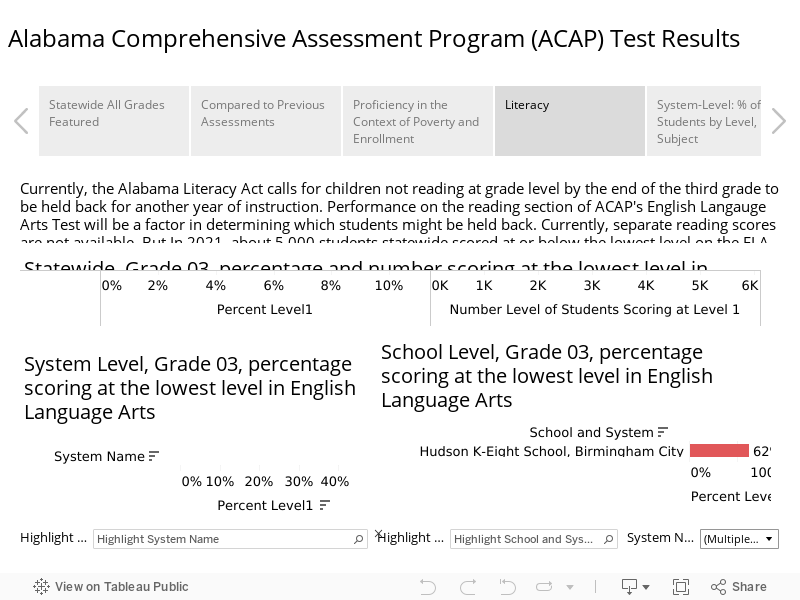
ACAP’s results are also being closely studied because of the impending impact of the Alabama Literacy Act, which requires that students be reading on grade level by the end of the third grade. If students fail to meet that benchmark, they are to repeat third grade.
ACAP scores serve as the first identifier for those students vulnerable to being held back. Starting this spring, third-grade students who don’t make a specified cut score on the reading portion of the English Language Arts ACAP will receive intensive intervention, further evaluation, and perhaps retention. The State Board has not finalized that cut score yet but is scheduled to at its next meeting. At its October 14, 2021, meeting the board received recommendations from a technical advisory committee on what the cut score should be.
If the committee’s recommended cut score were in place this year, 23% of students would be judged to be below grade-level expectations in reading and, potentially, could have been held back. However, the technical advisory committee also unanimously recommended that the retention provision of the law not go into effect this coming spring. Committee members said that an additional year of test results are needed, results generated in more normal conditions, in order to affirm the validity of the cut score.
Earlier this year, the Legislature passed a bill delaying the retention provision, but Gov. Kay Ivey vetoed the bill. In issuing her veto, Ivey said the Legislature could revisit the issue after seeing the 2021 test results.
When the retention provision does take effect, students who don’t make the ACAP reading benchmark would be offered intensive intervention at a summer literacy camp and would be retested later in the summer. Other conditions and evidence would also be considered before the child is recommended for retention. For instance, students who have been previously provided with two years of reading intervention or students who already have an Individualized Education Plan in place would be eligible to progress with their classmates, though they would still be provided with continued support to get them up to grade level on reading.
The reading results are not available at the school level because the cut score has not been set, nor have the results been calculated or published. However, the scores on the ELA section of ACAP provide some insight into how students performed across the state.
About 10 % of students, or 5,008 of the 55,000 third graders, scored at the lowest level, Level 1, on the ACAP’s ELA section. The number and percentage falling below the cut score on the reading subsection would be higher considering the figures presented by the technical advisory committee, a little more than double.
In the 30 best-performing school systems, less than 5% of third-graders scored in Level 1 range. However, in the 15 lowest-performing systems, 20% or more of the students scored at Level 1. That includes 32% of Birmingham City School students or close to 500 students in that system.
New Tests, Similar Relative Results
Regardless of where the proficiency bar is set, the relative performance of the state’s various school systems on these standardized tests tends to remain constant. There is a socioeconomic component: the higher the percentage of economic disadvantage in a school, the lower the percentage of students scoring proficient. Figure 3 shows that as poverty decreases, proficiency rates increase. At the same time, Figure 3 shows that systems with the same level of poverty can produce vastly different proficiency rates. In Tarrant, 53% are economically disadvantaged, and only 10% of students tested were proficient. By contrast, Piedmont’s rate of economic disadvantage is the same. Still, half its students scored proficient, exceeding the state’s average despite having a higher poverty percentage than the state as a whole. So while income matters, a system’s approach, its setting, resources, and community support, can make a difference.
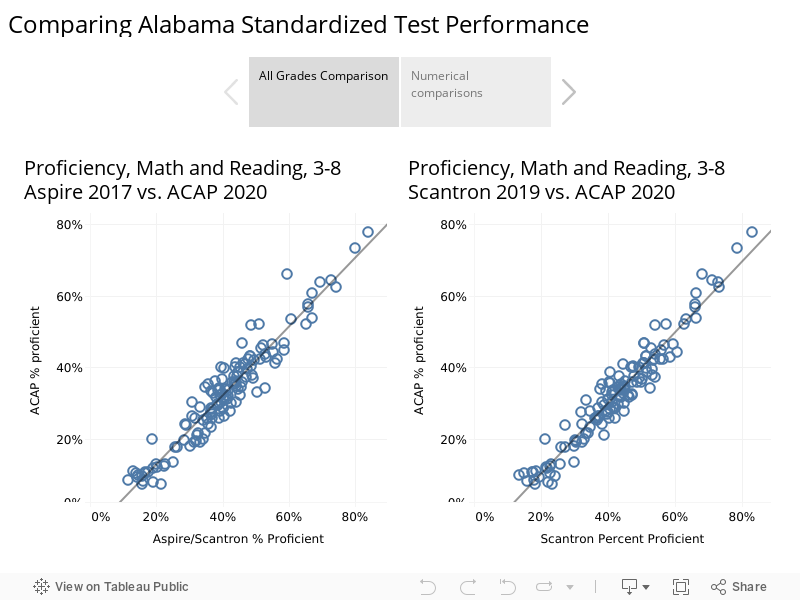
And despite the complaints about previous tests, the new ACAP tests, which are specifically designed for Alabama and its academic standards, showed very similar patterns in relative performance. Schools systems that performed well on previous tests did well on ACAP. Those that struggled previously struggled again. The graphs in Figure 4 compare ACAP results with prior results on Aspire and Scantron for Alabama school systems. The tight grouping along the line of prediction indicates a strong correlation between ACAP performance and performance on previous standardized tests.
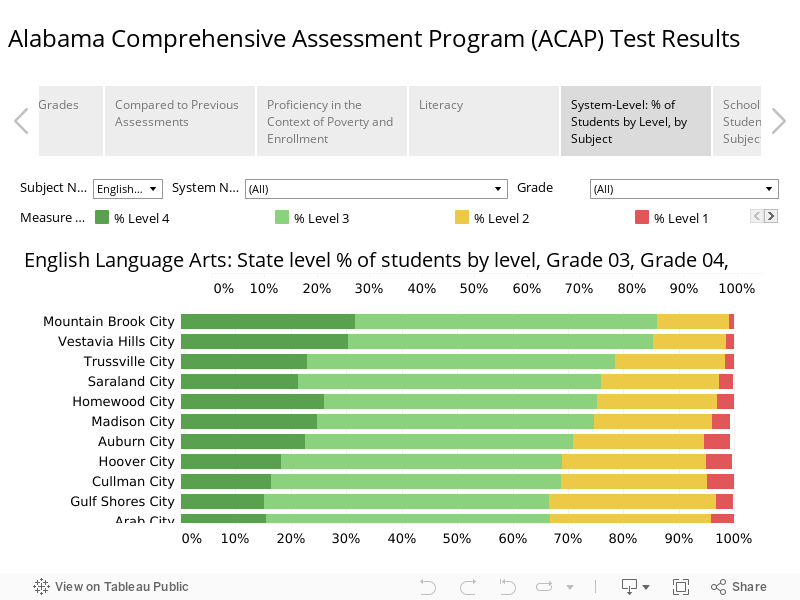
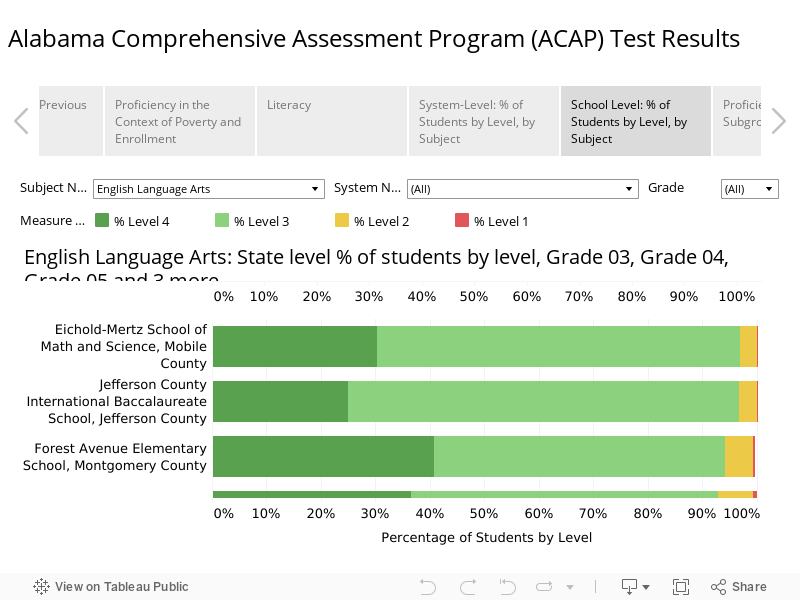
Performance by Level
As noted above, student scores are divided into four levels. Students scoring in Levels 3 and 4 are considered proficient for their grade level. The percentage scoring proficient in the graphic below is represented by shades of green (dark green for Level 4 and light green for Level 3). The percentage of students at Level 2 is illustrated in yellow, while the percentage at Level 1 is represented in red. The menu allows a choice between subjects.
That display by level is also available for schools.
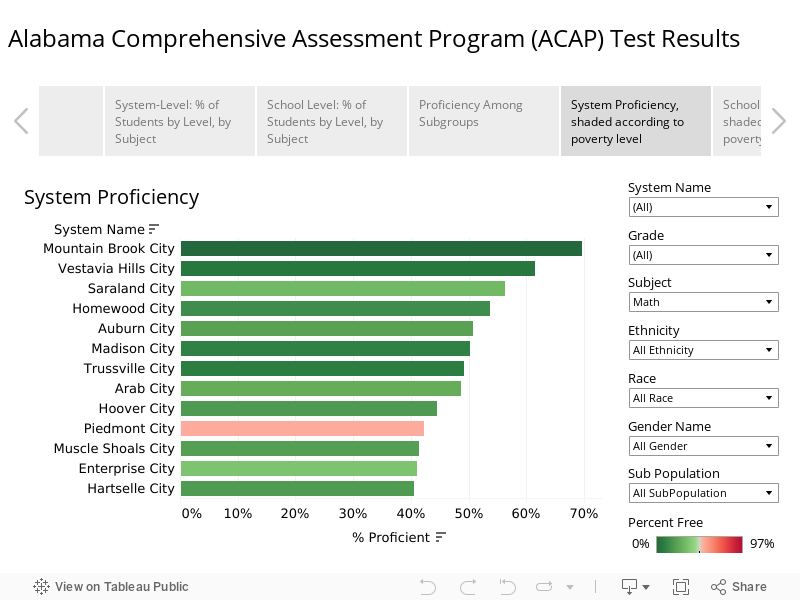
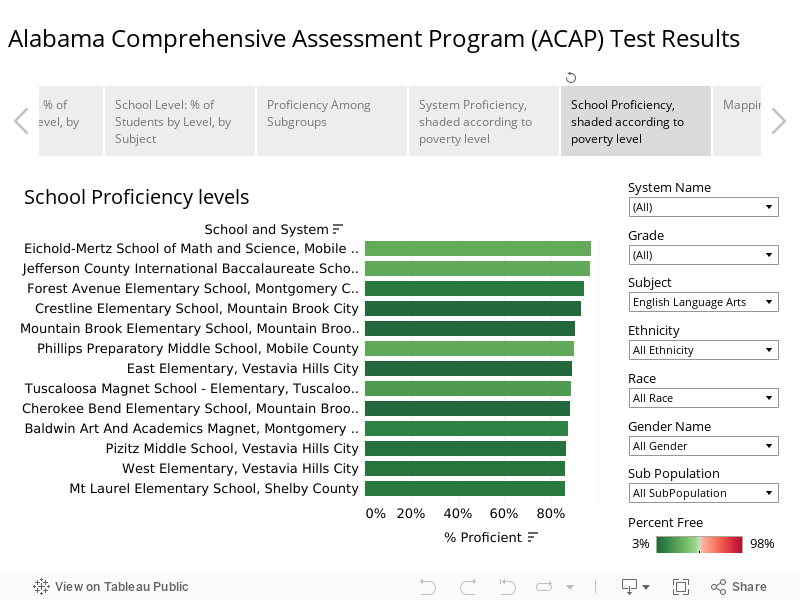
System, School, and Subgroup Performance
The charts below allow for a deeper exploration of the data, including the ability to report on performance by gender, race, ethnicity, and by other subpopulations of students. In systems and schools where there are small numbers of students within a subgroup, results are not displayed in order to protect student privacy.
The menus on the right allow a user to drill down into the results by subject, grade, gender, race, ethnicity, and subpopulation.
Results are also available at the school level.
And finally, the ACAP proficiency levels can be explored through this interactive map. Toggle between subjects and grade levels using the controls to the right of the map.
Experience with Digital Learning Helped Piedmont Exceed Expectations Despite Covid
When the pandemic closed schools in March 2020, Piedmont City Schools didn’t have to scramble to purchase laptops. The system didn’t have to figure out how to get their students internet access. It didn’t have to digitize its course materials.
Piedmont did those things a decade ago, gaining national recognition and accolades.
But Piedmont also knew, thanks to their digital experience, that teaching through technology takes preparation and practice and can lead to a declining performance if relied on too heavily.
And ultimately, Piedmont has learned the connection that matters most is not the internet connection; it’s the connection between student and teacher and student and the school. As soon as they could safely reopen, they did.
“There is no substitute for face-to-face learning no matter how versed you are in delivering digital instruction,” said Piedmont Superintendent Mike Hayes.
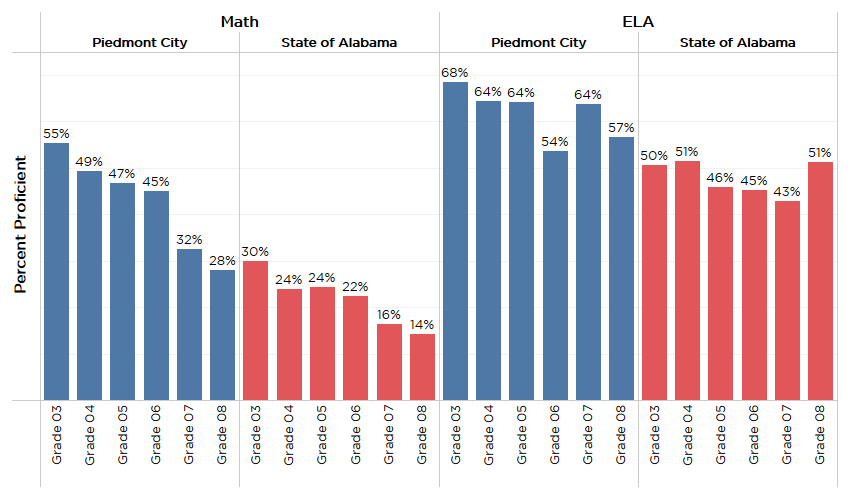
Results of Alabama’s new standardized test, the Alabama Comprehensive Assessment Program (ACAP), provide evidence that Piedmont’s experience and approach helped its students excel. Piedmont students outscored state averages in math and reading at every grade level.
Figure 1. Percentage of students proficient as measured by ACAP math and English language arts assessments, 2021, Grades 3-8, Piedmont vs. State of Alabama average
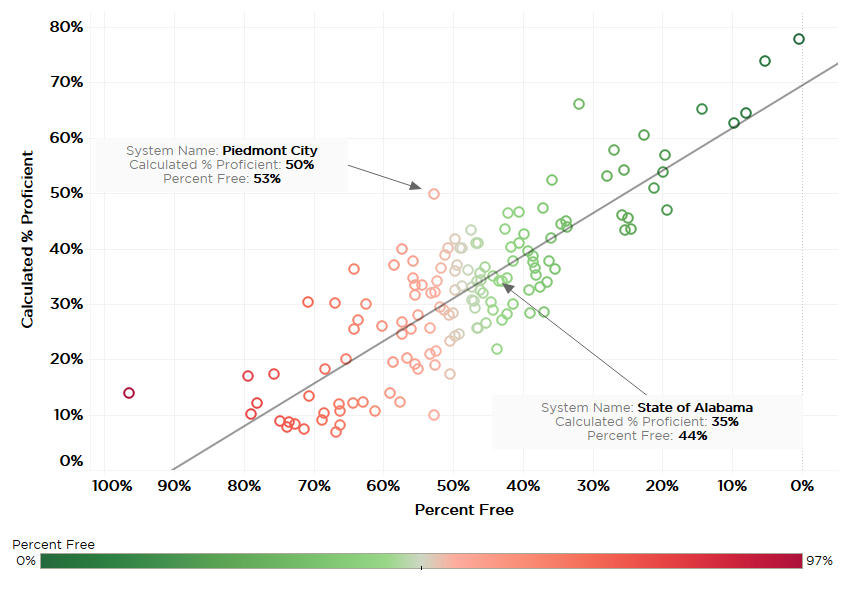
Piedmont’s performance is even more impressive when the student body’s level of economic disadvantage is considered. On average, students from economically disadvantaged households score lower on standardized tests than students from more affluent backgrounds. The percentage of Piedmont students qualifying for a free lunch under the National School Lunch Program is almost 10 percentage points higher than the state average. Figure 2. compares two factors: the percentage of students proficient on the ACAP test and the percentage of students directly qualify for the school lunch program. School systems above the line of prediction in the graph are exceeding the level of performance expected based on their level of poverty. Piedmont’s proficiency level far exceeds the performance of schools with similar demographics.
Figure 2. Percentage of Students Proficient on 2021 ACAP vs. Percentage of Students Economically Disadvantaged, by System
Across the country, there is a great deal of interest in the impact of educational changes made in emergency response to the pandemic, including the sudden switch to online instruction.
Preliminary data from across the country indicates that student academic progress lagged significantly behind pre-pandemic norms. The sudden shift to digital instruction and remote learning will be examined as one of the factors contributing to that missed learning. At the same time, though, it’s clear that aspects of virtual learning will endure, making it all the more important to understand digital instruction’s strengths and weaknesses.
So, what does Piedmont’s experience teach about the promise and pitfalls of digital education?
First, that educational innovation and excellence can happen anywhere. When then-Superintendent Matt Akin started pursuing the idea of handing each student a laptop, it seemed an unlikely dream. But in 2010, Piedmont, a small, underfunded district (106 in funding out of 138 school systems in 2019) in a town of about 4,400 in rural Northeast Alabama, became the first system in the state to provide all students in grades 4-12 with an Apple laptop computer. Eventually, all teachers were trained and Apple Certified, many traveling to Palo Alto and connecting cutting-edge educators around the country.
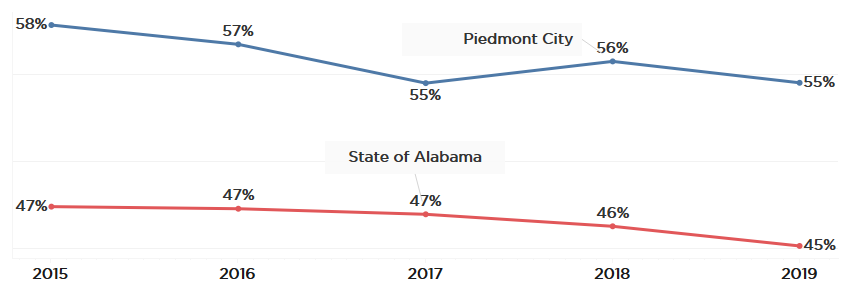
Figure 3. Percentage of students directly qualifying for the National Free Lunch Program, Piedmont vs. State of Alabama
The district was an original and continuing member of the nationwide League of Innovative Schools, a network that aims to “design, validate, champion, and scale effective, innovative learning opportunities to advance equity and excellence for every student.”
Piedmont City Schools even became a broadband provider, cooperating with community leaders and business partners to identify the best ways to get students connected to the Internet.
Akin’s successor, Hayes, said the system’s digital revolution was transformative and continues to pay dividends. However, the distribution of laptops was only the beginning of a much longer journey, a journey that is ongoing.
The technology didn’t produce overnight results. Along the way, there were disappointments and drift and continual course corrections. “We didn’t have a blueprint to follow. It was like we were building the plane while it was in the air,” he said.
Among the lesson learned:
Digital resources are tools that can supplement and accelerate learning, allowing struggling students to keep up and advanced students to excel. Data gleaned from digital assessment tools provide teachers powerful insight if the data is systematically and consistently reviewed and instruction targeted to meet all student’s needs.
However, if digital delivery is leaned on too heavily, if the local teacher doesn’t remain the central guide and shepherd of the instruction, students can fall by the wayside. Quality and engagement can suffer.
Most fundamentally, in Piedmont’s experience, the road to the future circled back to the tried and true: Good teachers and relationships make the difference.
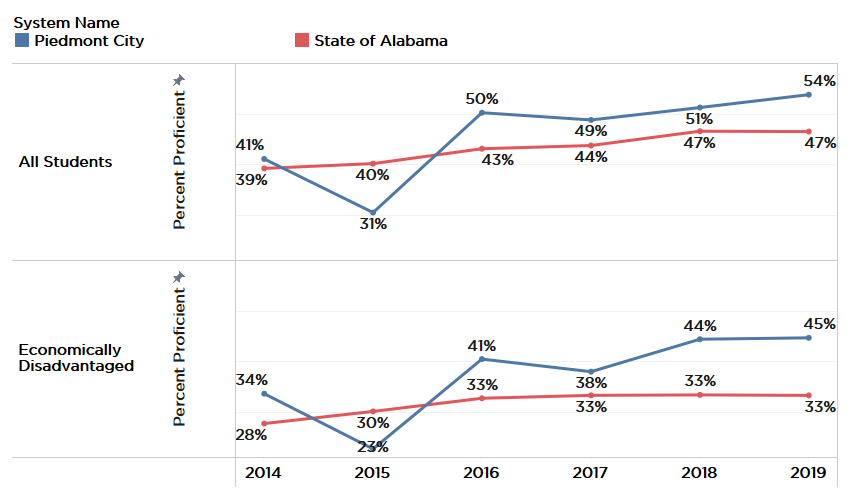
Over time, Piedmont has produced results to be proud of. In a system where the poverty percentage is ten points higher than the state average, proficiency levels are consistently higher than the state’s as a whole.
Figure 4. Piedmont vs. State, Aspire & Scantron, Grades 3-8
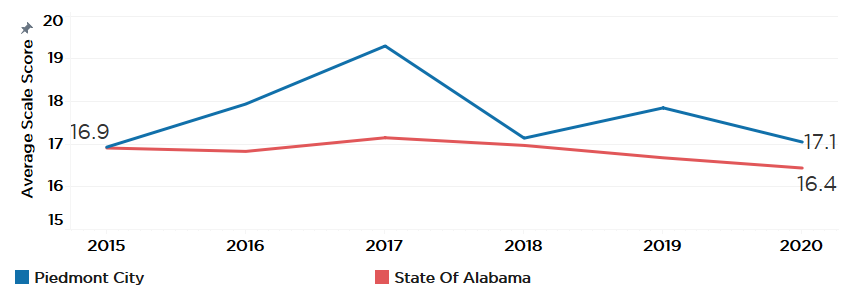
Piedmont’s ACT scores for all students trail the state average, though that’s not unexpected considering the disproportionate number of economically-disadvantaged students at Piedmont. When comparing those economically-disadvantaged students to other economically disadvantaged students across the state, Piedmont students outperform.
Figure 5. Average Composite ACT for economically-disadvantaged students, Piedmont vs. State of Alabama
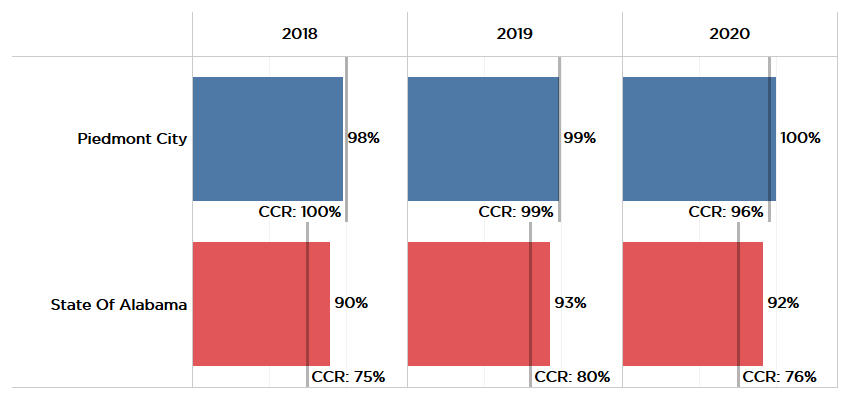
And Piedmont graduates nearly all of its seniors on time and having met the state’s definition of college and career-ready.
Figure 6. Graduation and College/Career Readiness Rates, Piedmont vs. State of Alabama, 2018-2020
What Piedmont learned about digital learning
Passing out laptops to school kids may have garnered attention back in 2010, but that was just the beginning of an ongoing journey in discovering how technology can enhance the educational experience and when it has the potential to interfere.
Don’t let the technology distract from the mission
When Piedmont first launched its technology initiative, it tried to create its own broadband network in cooperation with the city and an Alabama-based technology company. The City of Piedmont happened to have installed fiber optic cable throughout town, but it wasn’t being used. Taking advantage of that infrastructure, the school system and its partners launched a citywide wireless network.
But soon, it became apparent that it was unworkable to run a school system while also managing a small Internet provider utility, providing the necessary service and support.
Meanwhile, Piedmont had developed an alternative. Though it’s a small city system, Piedmont allows students from nearby rural systems, in Calhoun, Cherokee, Cleburne, and Etowah counties, to attend tuition free, due to its open enrollment policy. To provide Internet service to those students, they worked out a deal with Verizon for cellular data hot spots. Eventually, the system worked out a way to provide that same solution for the students who needed it in town.
Hayes said that solution might not work for other rural areas, but the rural areas around Piedmont’s happen to be well-served by Verizon cellular since more sizable towns (Jacksonville, Anniston, Gadsden, and Rome, Ga.) are not too far away.
The long and the short of it: Don’t let technology maintenance become a distraction; always seek simpler solutions.
Don’t lean too heavily on online resources; teachers are still key
With the wealth of online resources out there, you could point students to good resources and allow them to set their own learning courses. That’s part of the promise of digital education.
But in Piedmont’s experience, the local classroom teacher still needs to set the course for learning and guide the group through the material.
When material is presented in a passive digital form, it is not always well absorbed.
“Kids tend to watch, but they don’t necessarily process and synthesize,” Hayes said. “They need to be taking notes.”
“In the beginning, it was a challenge to find the sweet spot between digital and traditional curriculum,” said Hayes. “We quickly realized the teacher has to be the driving force in the classroom, with whole group instruction remaining a prominent part of the curriculum.”
Teachers divide class time between whole group instruction, small group instruction, and independent work. There is still time for advanced students to work ahead independently, while others who need more individualized instruction receive it. But Piedmont found that with too much unstructured time, students drifted.
“You lose students when you give them too much independent work on the computer,” Hayes said. “Or when they can plug in or choose answers without showing their work.”
Multiple choice computer programs don’t record a student’s path toward an answer.
So, Piedmont brought some tangible and tactile work back. That includes math and vocabulary notebooks. When students write material down and show their steps, a teacher can better understand the student’s thought process, and, if they ended up with the wrong answer, the teacher can identify where the student went wrong. Building a physical catalog of vocabulary seems to increase retention and create a sense of pride and ownership.
Clearly, digital tools are powerful—both for students and for teachers. Computer-based formative assessments, for example, can be of great value. They can create a much more detailed picture of what a student knows and where they are struggling.
But once you have that data, you need a structured plan for putting that data to use.
In Piedmont, teachers monitor data throughout and come together every four weeks to evaluate it on a full day devoted to data.
Elementary teachers meet by grade level. Middle School and High school meet by department. The teams analyze the data and devise instructional plans for the next four weeks, taking into consideration what students have successfully mastered and which standards need additional reinforcement.
“Our instruction is changing every four weeks,” Hayes said.
Cultivate your teachers and help them to continue to learn and grow
Because it highly values the classroom teacher, Piedmont has built a teacher cultivation process that starts in high school and continues throughout a teacher’s career.
Rural systems have a hard time attracting and retaining teachers.
To address this, Piedmont attempts to grow its own teachers by identifying kids in high school who show signs of interest and ability. With support and guidance from the school system, those students can find scholarships and other aid to get them into and through nearby Jacksonville State University’s School of Education. The locally-connected teachers are more likely to be invested in the Piedmont community and are more willing to stay for the long term, reducing turnover.
Once they’re on the faculty, they have ongoing opportunities to grow. The connections to the national educational technology world provide avenues for travel and training. And the system also incentivizes teachers to pursue National Board Certification, increasing their salaries and improving their classroom practice.
According to Hayes, Piedmont has the state’s highest percentage of board-certified teachers in its system and ranks No. 3 nationally, with 35% of the faculty having earned the certification.
In addition to the pay differential, National Board-Certified teachers are given two additional personal days and one additional professional development day to devote to maintaining their certification.
The system also provides continuous professional feedback to teachers between the school and central office staff; each teacher is observed teaching monthly.
Education is a relationship
For all its promise, technology can’t replace relationships. Being a small rural system may present challenges, but it also helps in keeping an eye on students as individuals. Piedmont doesn’t just rely on its small-town nature to make this happen. The intimacy is systematically cultivated.
Every Thursday, students in grades 4-12 are divided into groups of about a dozen students who meet with an individual faculty member assigned to that particular team of kids. There is a technological aspect to this. The teacher mentor maintains a Google spreadsheet for each kid, and through it, gets feedback and grades on each of the kids from their teachers and coaches. They monitor their students’ grades, attendance, and performance across subjects. The technology puts the mentor in the position to ask questions before problems get too serious: Why are your grades slipping? What are these absences? What is going on?
Most importantly, the mentor teachers build long-term relationships and 360 degree understanding of the students. That creates a unified point of accountability, based on a personal relationship between student and teacher, and also, when possible, with parents.
That may help explain why Piedmont has graduated close to 100% of its seniors on time for several years running.
When faced with a potential dropout, Hayes said, “We pull all resources at our disposal together and develop a plan to ensure the student continues on a path to graduation.”
Having learned the importance of relationships and face-to-face accountability, Piedmont went back to in-person schooling as soon as they safely could during the 2020-2021 school year, while observing all the safety protocols.
Despite that, 30 to 35% of high school students and 10% of the younger kids chose remote learning. The system allowed and supported that. However, they required virtual students to come to school twice a month for in-person check-ins. And if a student’s average falls below a 70 in a class, they were required to come back to school unless they had a special circumstance like being immune-compromised or having an immune-compromised family member.
Aiming for the Future
In launching its technology initiative a decade ago, Piedmont hoped to keep students more interested and engaged. That may help explain why the system’s graduation and career readiness rates are among the highest in the state. While the engagement with technology may have something to do with, the more obvious source of that success is the system’s longer-term methodical preparation of students.
Recognizing the importance of the ACT when it comes to college entrance and scholarships, Piedmont starts early. The Piedmont team has realized that a critical hurdle to success on the ACT involves vocabulary. The vocabulary and sentence structure of the exam is college level, but it is being given to 11th graders, many of whom are first-generation college students.
So, the system focuses on vocabulary building throughout elementary and secondary education, with students consistently challenged to learn new words.
Throughout high school, teachers are encouraged to create ACT-type questions for their regular tests. An ACT prep class is required for all juniors. And students are encouraged to take the ACT as many times as possible, which often results in improved scores.
According to Hayes, those scores mean something. A 26 on the ACT puts a student in the running for a substantial scholarship at Jacksonville State University, with even more generous scholarship benefits available to those who score higher.
College-bound or not, the high school offers students instruction in etiquette and soft skills. Every student is required to set up a Linked-In Account, develop a resume, and fill out the Free Application for Federal Student Aid (FAFSA).
Piedmont’s Career Tech educational offerings aren’t broad, but they start early, and are aligned with the needs of local employers, and, thus, offer opportunities for work placement. Also, an additional requirement – that each student do at least some community service –serves to engage students in the real needs of the community.
Conclusion
Piedmont’s bold work with technology has undoubtedly benefited students in a world that is increasingly reliant on technology for educational delivery. At the same time though, Piedmont recognizes that technology can become a distraction if not utilized thoughtfully. To provide a complete education, you need teachers, well trained and open to growth and adaptation. You need students motivated to learn and engaged by the school and community. You need a destination and a methodical approach to getting there.
Due to Covid, Fewer High School Grads Rate as College and Career Ready
Despite the pandemic, Alabama public schools maintained a high on-time graduation rate in 2020. However, the number and percentage of students meeting the state’s definition of college and career-ready fell by 4 percentage points, likely held back by missed opportunities due to the closure of schools in March 2020.
Because of the challenges posed by the pandemic, state policy allowed seniors to graduate as long as they were in good standing at the end of the third nine weeks of the 2020 school year (local systems made the final decision over who qualified for graduation). For this cohort of seniors, students who were 9th graders in 2017, 92% received a diploma in 2020.
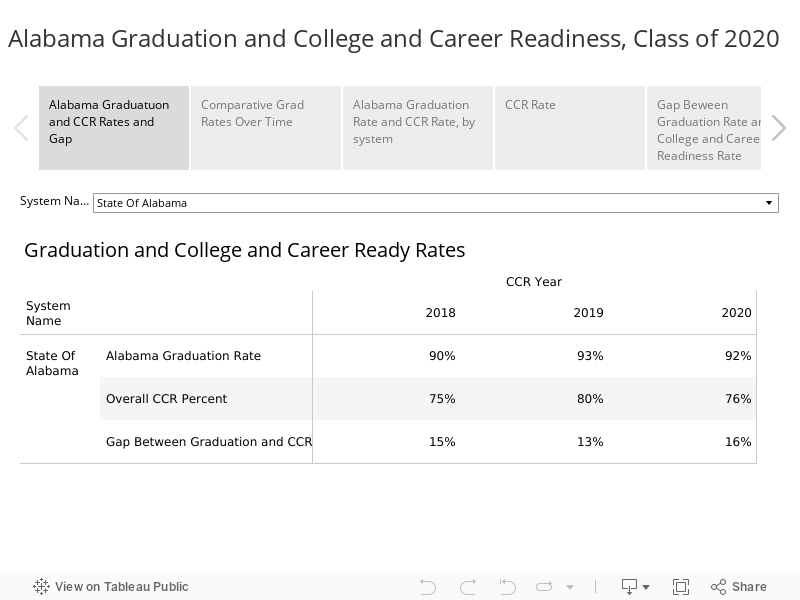
However, when it came to college and career readiness measures, some of those seniors were unable to complete the requirements, as the final months of the 2020 school year were conducted online. Of that same cohort, 76% met the definition of college and career-ready established by the Alabama State Board of Education.
Other data suggest that fewer of those 2020 graduates enrolled in higher education after graduation. The Alabama Commission on Higher Education has reported a 10% decline in the number of Alabama high school graduates enrolling in higher education in the fall of 2020 compared to the previous year, with community college enrollment most affected. The enrollment decline had more to do with the unprecedented circumstances of the pandemic than the decline in the college and career readiness rate (CCR rate).
Still, the CCR rate and the decline in higher education enrollment should be noted as the state seeks to make up for lost time and opportunity in the aftermath of the pandemic. Alabama’s 2020 high school graduation rate will likely be among the nation’s highest again. In 2019, Alabama’s reported federal graduation rate, 91.7%, was the highest in the nation. It was the culmination of a steep rise — Alabama’s graduation rate was 72% in 2011. Historically, the state’s graduation rate has been in the lower tier of states.
Despite the meteoric rise in the graduation rate, the CCR rate and other measures indicate that Alabama schools still have work to do when it comes to turning out prepared graduates. The State Department of Education has called on public schools and systems to close the gap between the graduation rate and the CCR rate. Ideally, every student should graduate ready to succeed in college or in advanced training that leads to higher-paying jobs. The CCR rate can also indicate the range of education and training opportunities available to students at a school or in a system and in normal conditions, serves as a gauge of the effectiveness of the educational program offered.
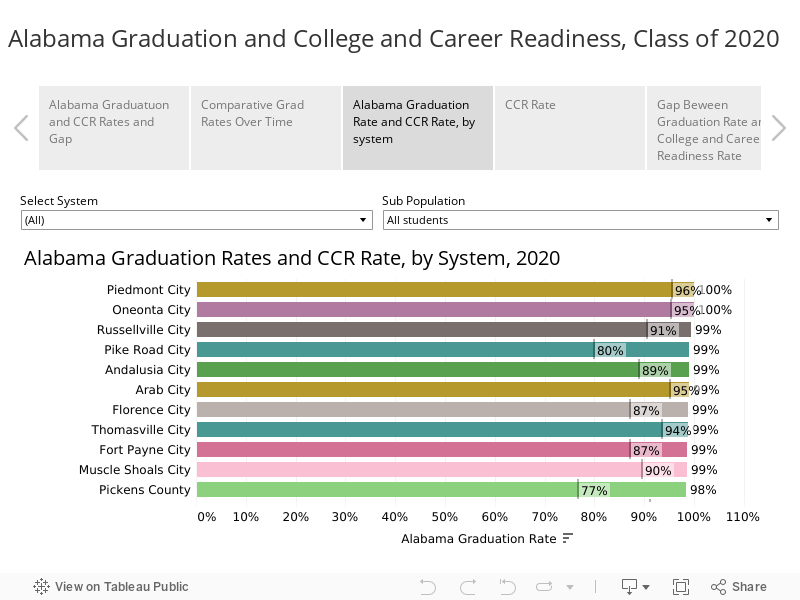
Gaps between school systems
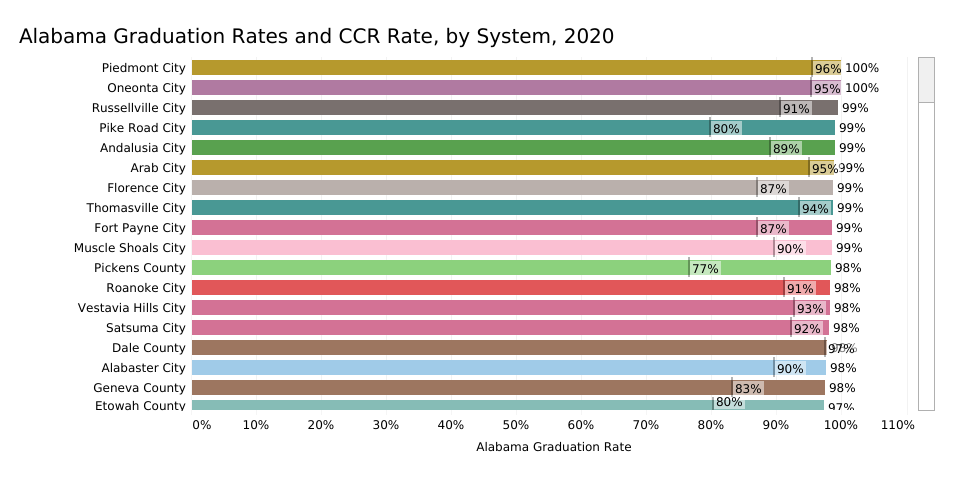
When looking at local school systems, wide gaps remain even in the graduation rate. While 100% of students graduated from Piedmont and Oneota City Schools in 2020, only 69% of Bessemer seniors graduated on time.
The gaps are wide in college and career readiness as well. In 2020, 97% of Dale County seniors were rated as college or career ready, compared to only 25% of Bessemer seniors.
Gaps between student subgroups
Alabama’s graduation rate gap between the races and socio-economic groups has also narrowed at the state level. But when it comes to college and career readiness, gaps between the races and between socio-economic groups persist. For example, 84% of white seniors are rated college and career ready, while only 64% of Black seniors earn the distinction.
Does the CCR rate really matter?
To be counted as college and career ready, an Alabama high school student must meet at least one of six different indicators. In an official sense, a student’s status as college and career-ready doesn’t matter. It is not required for graduation. Neither colleges nor employers look for the rating on an individual’s resume.
On the other hand, some of the indicators have real-world implications for individuals. They can help an individual get into college, secure college credit, or successfully apply for a job. The chart below shows the percentage of seniors earning the college and career readiness distinction through each of the established measures. A detailed description of each of the measures follows the chart.
The changes in the percentage of students earning college and career readiness in each of the categories reflect changes in emphasis, investment, and effort. The changes can also reflect strategic choices by students or schools to pursue the easiest path for meeting college and career readiness requirements.
Below are the indicators of college and career readiness as established by the State Board of Education.
1. Score at or above the benchmark on one section of the ACT, the college-readiness test
In recent years, about 50% of students benchmarked on the ACT in at least one subject, most commonly English. According to ACT, a student who scores at or above the benchmark in a subject has a 50% chance of making a B in a college course in that same subject.
For the Class of 2020, only 46% of students made at least one benchmark score. With the coming of the pandemic, ACT had to cancel several test dates, which may have prevented some students from retaking the test and reaching the benchmark score. In light of that, many colleges and universities waived the ACT requirement for admission.
Still, the ACT results might also indicate that the disruption left some seniors less prepared for college.
2. Score Workforce Ready on the ACT WorkKeys test
In addition to its academically oriented college-readiness test, ACT offers WorkKeys, a standardized test that measures practical skills in math, language, and comprehension, skills as they might be applied in the workplace.
In 2019, 61% of seniors scored Silver or above on the WorkKeys, an indicator that they had the practical skills needed to function in most workplaces.
For the class of 2020, only 45% of seniors earned scored Silver or above. One potential reason for the drop is that schools are no longer required to give WorkKeys to every senior. Many systems, particularly those with an orientation toward college preparation, let students who scored college-ready on the ACT skip the WorkKeys test.
Also, for the Class of 2020, the WorkKeys was given in the Fall of 2019 as usual. But normally, spring re-tests offer opportunities for students to improve their scores. These re-tests were canceled in 2020 due to the pandemic.
For some, that lack of opportunity to better their WorkKeys scores has implications. Employers in some regions of the state, particularly West Alabama, have come to value the WorkKeys results as a meaningful credential. But there is a remedy. For those graduates who want the credential, Alabama’s two-year colleges offer preparation and WorkKeys testing.
3. Score 3 or above on an Advanced Placement (AP) or International Baccalaureate (IB) end-of-course test
AP and IB are college-level courses offered in high schools led by a trained teacher, following a nationally standard curriculum. Scoring 3 or above (out of 5) on an end-of-course test can earn a student college credit in the corresponding college course. IB exams were canceled in 2020 because of the pandemic. However, AP tests proceeded in an online format. Impressively, the percentage of seniors earning AP credit (11%) was only down 1 percentage point from the previous year.
4. Earn an industry-recognized credential through a Career Technical Education course
In 2020, 35% of seniors graduated having earned at least one industry-recognized credential. Considering that many of the credential certification tests don’t take place until the end of the year, it is impressive that the percentage of seniors earning a credential was only down two percentage points, from 37% in 2019.
Overall, the number of credentials earned in 2020 was down significantly compared to 2019 (final tallies are still being compiled). However, seniors appeared to have already earned credentials in prior years or earlier in the school year. The change to online instruction after March of 2020 disrupted the normal process of awarding credentials and closed some avenues for earning them. However, schools were encouraged to make a special effort to help seniors complete their industry-recognized credentials, an effort that appears to have been largely successful.
5. Earn college credit through dual enrollment
This is the one area that actually saw an increase, with 15% of graduating seniors earning college credit through dual enrollment in 2020 compared to 14% the year prior.
Dual enrollment, having high school students take classes for credit through universities or community colleges, has been gradually increasing in participation. Apparently, the courses were able to continue and be completed virtually.
6. Successfully enlist in the military
In 2020, 2% of graduating seniors enlisted in the military, a percentage that has been consistent for several years.
One notes trends in looking across the years at the variety of methods for achieving college and career readiness. The percentage of students CCR Ready on the ACT has been relatively flat. The percentage CCR Ready through WorkKeys has grown as schools and students have become more familiar with the test, though it fell back in 2020 thanks to changes in policy and disruptions. An increasing number and percentage of students have demonstrated college and career readiness through success in AP courses, dual enrollment, and in particular, participation in career technical education.
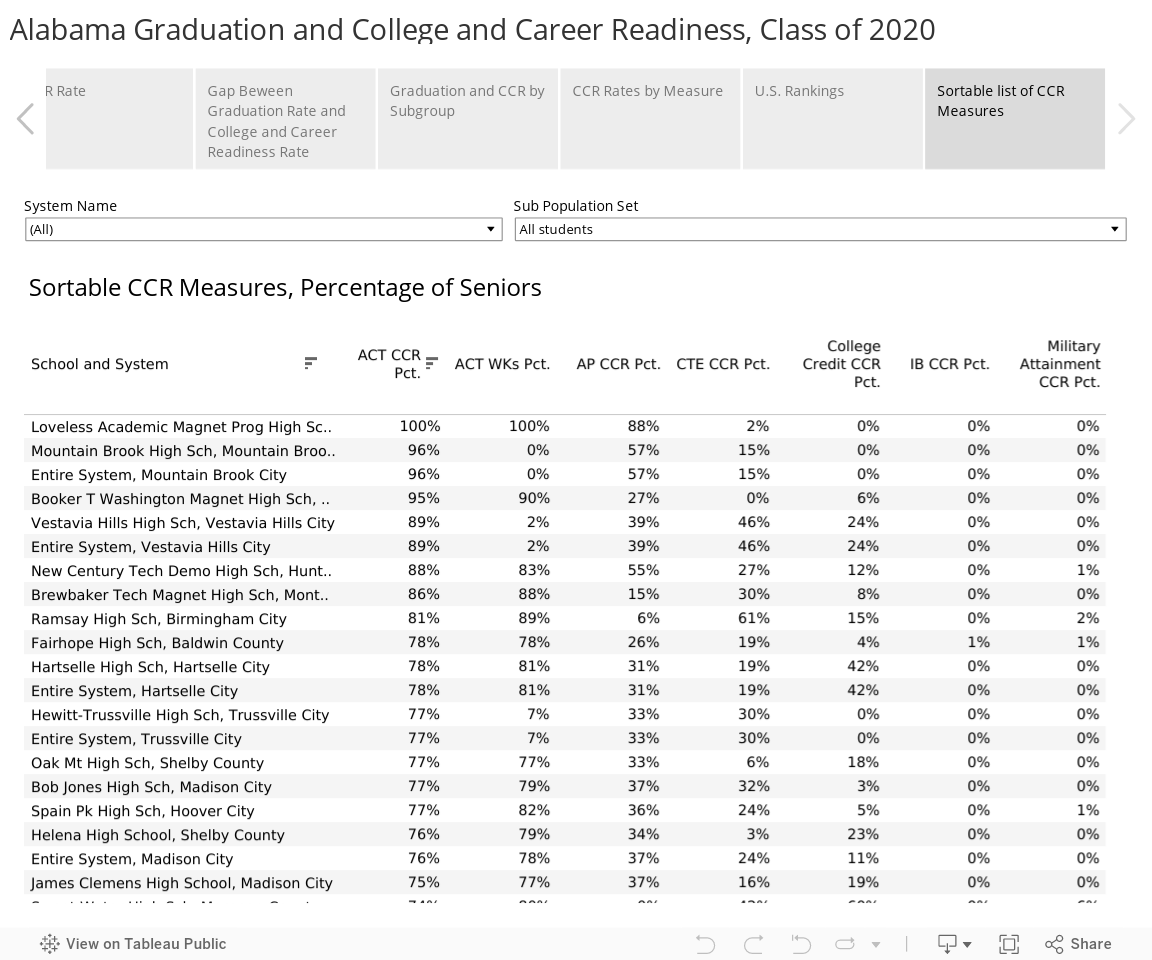
Different approaches to achieving college and career readiness
While a statewide analysis of college and career readiness measures provides some insight, a closer examination of local system results reveals that there is a tremendous variety in how different school systems approach college and career readiness for their students. For example, magnet schools and affluent suburban systems record high percentages of students earning benchmark scores on the ACT or AP. Systems with a close relationship with a local community college might offer more dual enrollment opportunities. At the same time, schools with strong career technical education programs might produce more college and career-ready students through that route.
Conclusion
The Covid-19 pandemic presented unprecedented challenges for schools and students. Schools and students posted relatively minor and understandable declines on major performance measures like the high school graduation rate and the college and career ready rate.
However, at a time when the state has set lofty goals for raising the educational attainment level of the workforce, both the pandemic and underlying trends point to needed areas of focus.
Alabama’s high school graduation rate is high. Still, students need to graduate better prepared with meaningful credentials and solid evidence that they are ready for education and training beyond high school. In 2020, 24% of high school seniors failed to demonstrate college and career readiness, even by the relatively generous standards established by the Alabama State Board of Education.
Among Alabama high school graduates, an increasing number are not seeking higher education. Some of that may stem from a robust job market that is drawing graduates straight into the workforce. Some of the most recent drop is pandemic related. However, for individuals’ long-term prosperity and for the state’s economic future, our workforce needs increasing levels of education and training. There needs to be continued attention to building solid bridges between high school and the next level of opportunity. There is also an opportunity to reach out to recent graduates, particularly 2020 graduates affected by the pandemic, to make sure they have access to advanced education and training.
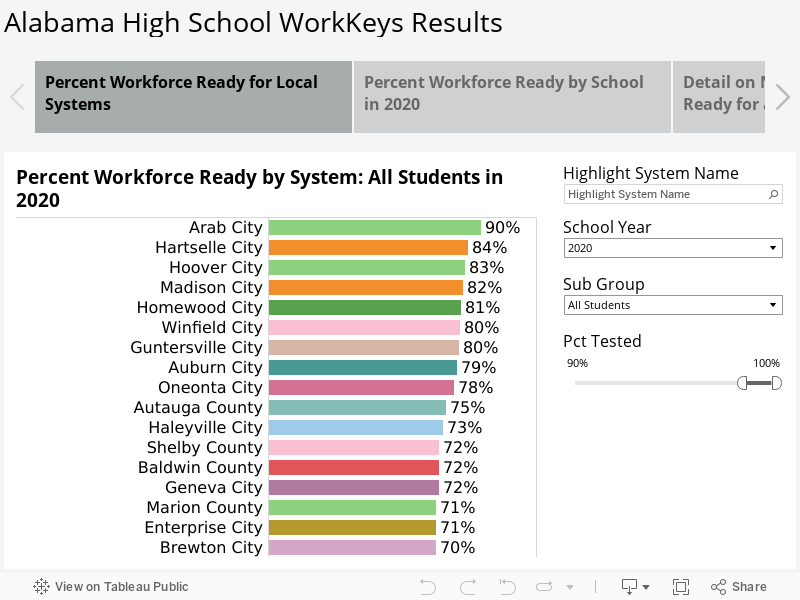
Work Readiness Test Results Affected by Covid and the Now-Optional Nature of the Test
Between 2015 and 2019, an increasing number and percentage of Alabama students earned high marks on the ACT’s WorkKeys, a standardized test designed to measure skills in workplace applications of reading, math, and graphical literacy. Results for the Class of 2020 can’t be compared to those prior years for two reasons:
The test is now optional, and a much smaller percentage of 2020 seniors students took it.
The Covid-19 pandemic canceled the spring window for retesting, an opportunity that usually led to higher scores.
So, within the senior class that graduated in 2020, 80% of high school seniors took WorkKeys compared to 93% of seniors the previous year. Those that take WorkKeys are awarded a National Career Readiness Certificate, the highest scoring earn a Platinum, with Gold, Silver, and Bronze level following down the scale. Of those who did take the test in 2020, 59% scored at the Silver level or above, compared to 66% for the Class of 2020.
Earning a Silver certificate or above on WorkKeys is one of the six ways an Alabama high school senior can prove that they are college and career-ready. Some systems made the test optional for students who had already demonstrated college and career readiness through qualifying ACT or AP scores, students who would have likely performed well on WorkKeys.
WorkKeys, as it is administered to high school seniors, consists of three tests: Applied Math, Workplace Documents, and Graphic Literacy. ACT works with employers to evaluate jobs and determine the level of reading, math, and comprehension skills each job requires. Research from ACT finds that someone earning a Silver-level WorkKeys certificate would have the basic skills necessary to function in 69% of the jobs they have profiled.
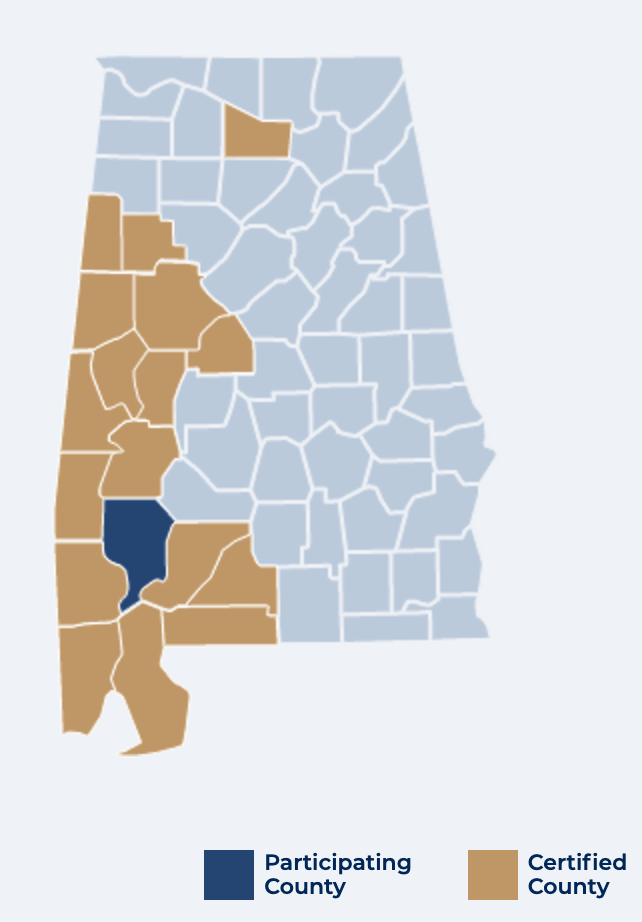
In West and Southwest Alabama, where economic development organizations have worked to familiarize businesses with WorkKeys, the credential is valuable. Employers, particularly in manufacturing, regard the scores as an indicator of a candidate’s ability to effectively function in the workplace. A student can use the credential when applying for a job with those employers that recognize what the credential means. The map depicts the counties that have worked with ACT to document the WorkReady credentials of their workforce and to educated local employers about the test.
However, in other areas of the state, where fewer employers are familiar with WorkKeys, and in school systems where almost all of the students are going to a four-year college, the WorkKeys assessment can be viewed as extraneous. In 2020, in Mountain Brook and Vestavia Hills, for instance, only 25% of the students opted to take the test in 2020.
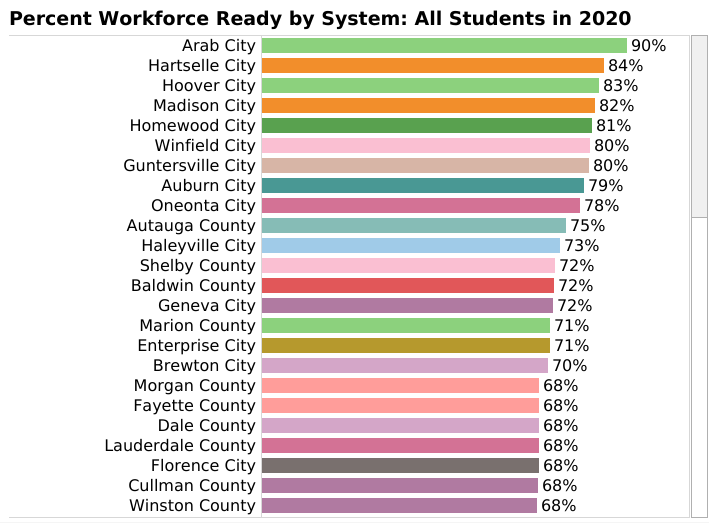
Because the pool of students taking the test was significantly altered, the results shouldn’t be considered as part of a trend or a statewide indicator of performance. However, in schools and systems where almost all students take it, the information can be useful for communities evaluating the level of preparation the students are receiving.
The different nature of the WorkKeys test has tended to allow a slightly different set of schools and systems to show up as top performers in the state. In 2020, the top-performing system was Arab City Schools, where 90% of students scored earned a Silver or better. Hartselle City Schools placed second, with 84% of students scoring Silver or above. The default listing in the visualization shows only systems in which 90% of students took WorkKeys. The slide allows the viewer to adjust that percentage. Other controls allow exploration of other views of the data, changing the year, or looking at the results for a particular demographic subgroup.
Looking at the performance of individual schools, a familiar pattern is apparent. Magnet schools from the Montgomery, Huntsville, and Birmingham school systems top the list. But joining them in the Top 10 are Arab High School, Marengo County’s Sweet Water High School, Autauga County’s Billingsley High School, Fairhope High School, and Hoover’s Spain Park.
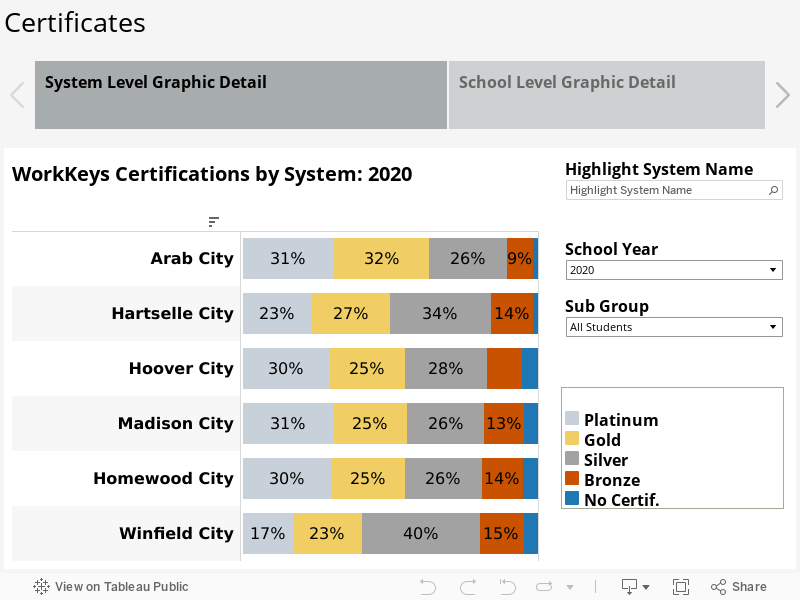
For a more fine-grained look at performance, the chart below breaks down the percentage of students scoring at each level on WorkKeys, ranging from the percentage earning a Platinum-level certificate to the percentage of students who took the test but failed to earn a certificate. Other views of the data are also available through the tabs at the top of the visualization.
Alabama Public Opinion Survey 2021
PARCA’s 2021 public opinion survey finds a growing majority of Alabamians support spending more on education but a lack of consensus on how to pay for the increase.
Among the findings:
Taxes
61% of respondents say upper-income Alabamians pay too little in state taxes. The percent of respondents who believe upper-income earners pay too little increased by 10% from 2020.
53% say lower-income earners pay too much, up from 40% in 2016.
49% say they pay the right amount of taxes, compared to 57% in 2016.
Despite Alabama’s low per capita tax yield, 69% of residents believe they pay the same or more taxes than people like themselves in other states.
Public Education
Alabamians believe education is the most important service state government provides, but its lead over other services is declining.
44% rank education as the most important service, while 31.3% rank healthcare No. 1.
78% believe the state spends too little on education, compared to 74% in 2019 and 68% in 2013. Large majorities in every subpopulation have this belief.
69% support increasing taxes to support education, but no single tax increase option garners majority support.
This year, respondents were asked what supplemental programs might improve education. No program received a majority response, but the top priorities were expanded tutoring, increased technology funding, and more mental health counseling.
When asked what respondents’ top priority for new education funding would be, the highest percentage (41%) said that new revenue should go to increasing salary and benefits for teachers
59% say local boards of education are best suited to decide how education dollars are spent.
Respondents believe that the local board of education are best suited to decide school spending, school policy, and school closings.
Other notable education findings:
77% believe that taxes on Internet sales should be distributed to local schools in the same way as sales tax revenue from brick-and-mortar sales.
Alabamians are almost evenly split on tax-funded vouchers to pay for private school tuition. However, 61% of Alabamians believe vouchers, if allowed, should be available to all students.
Trust in State Government
Alabamians’ trust in state government improved slightly compared to 2019 but is still well below rates reported in the early 2000s.
77% support keeping the General Fund and Education Trust Fund separate, down from 80% in 2020 and 82% in 2019, but still well above the 69% reported in 2016.
63% believe state government officials do not care about their opinions, down from 66% last year. This compares to a low of 55% in 2008 and a high of 74% in 2010.
61% believe they have no say in state government, up from 55% last year, but well above the low of 43% in 2008.