Halfway through 2025, Birmingham’s homicide total is half what it was midyear 2024, a dramatic turnaround after a year of record-setting violence.
According to data from the Jefferson County Coroner’s Office, total homicides in Jefferson County have been trending down from a peak in 2021, despite the record number of homicides in the City of Birmingham in 2024. Countywide, there were 196 murders in 2024. In 2021, there were 216.
Excluding Birmingham, homicides in the rest of the county dropped from 87 in 2021 to 47 in 2024, marking a return to pre-pandemic levels.
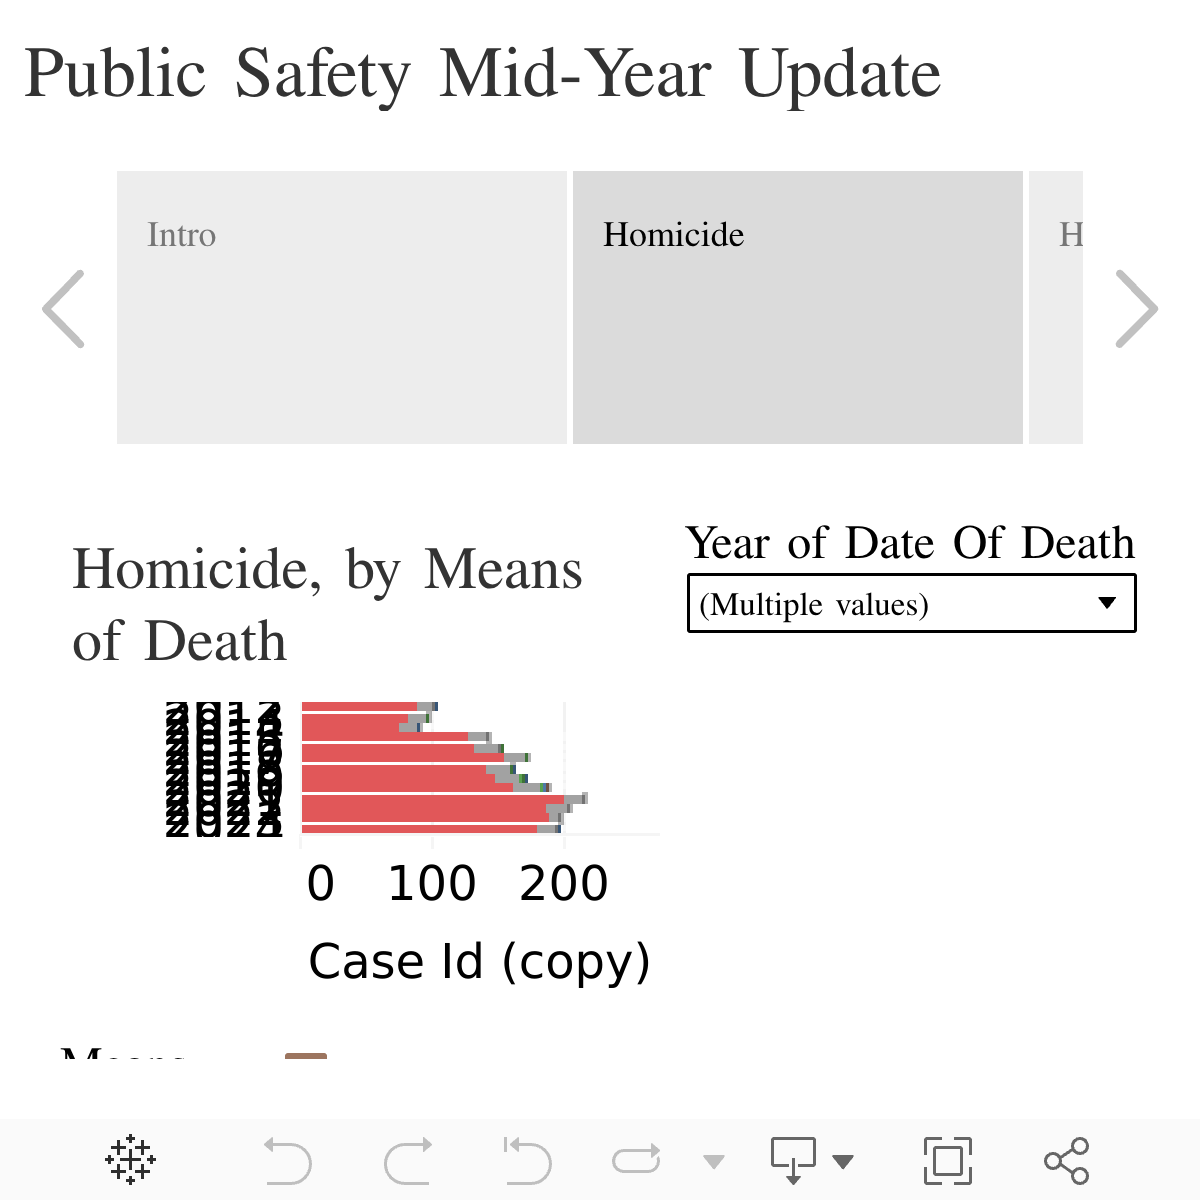
Figure 1 shows total homicides by year. The bar is shaded by the means of death. The red-shaded portion of the bar represents homicides involving guns. Most homicides in Jefferson County involve guns.
Figure 1. Jefferson County Homicide Trends, by Means of Death
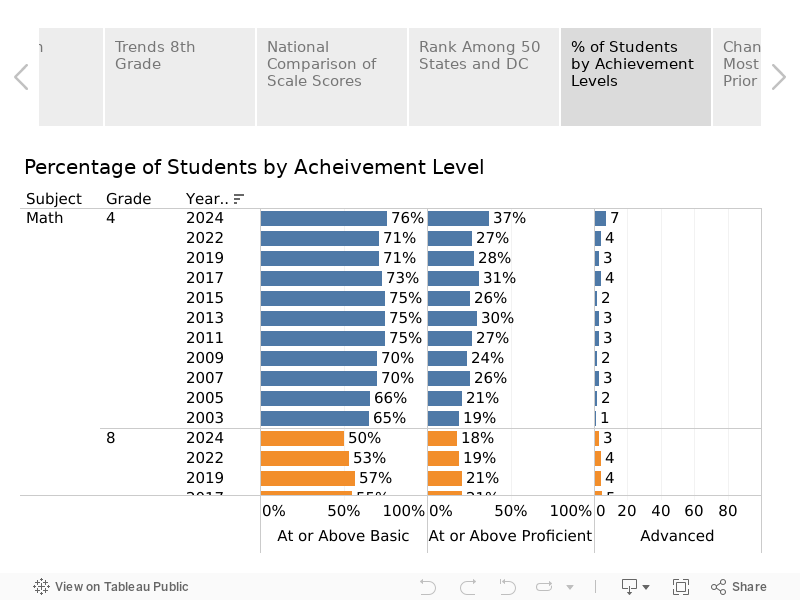
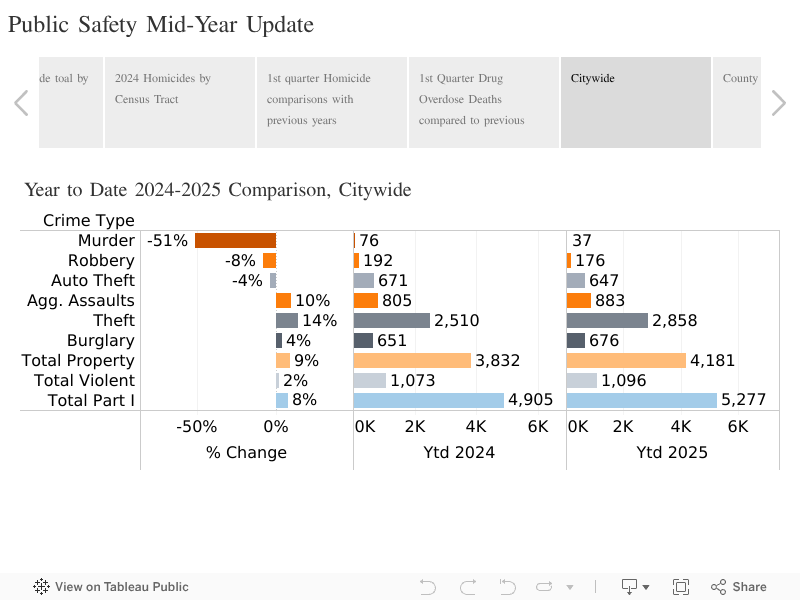
In the first half of 2025, Birmingham saw a precipitous drop in the number of murders, with 37 murders in the first six months of the year, compared to 76 by midyear 2024, according to data provided by the Birmingham Police Department.
While murders, robberies, and auto theft were all down compared to the first six months of 2024, aggravated assaults, theft, and burglary were up.
Taking the statistics together, Birmingham police have recorded more total criminal incidents in 2025 than for the same period in 2024.
Figure 2. Birmingham Part I Crime Trends
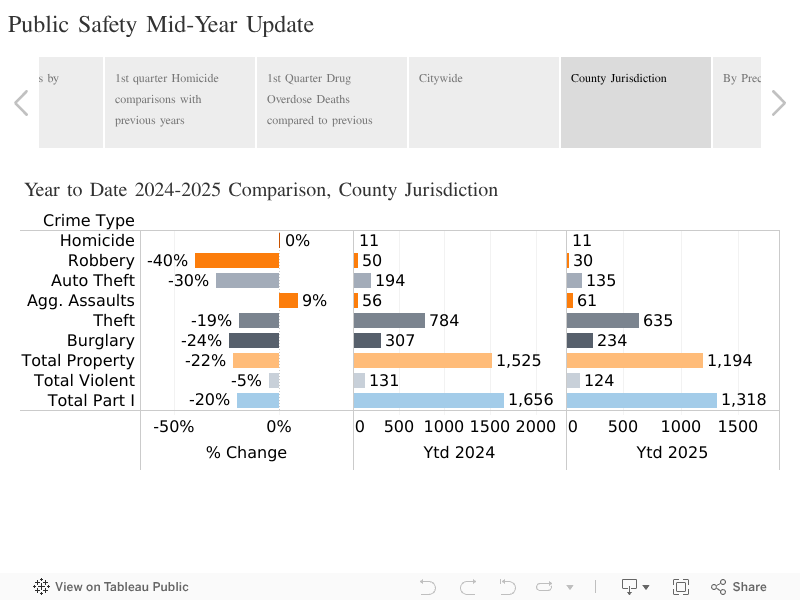
Beyond Birmingham, in the portions of Jefferson County patrolled by the Sheriff’s Office, homicides in the first half of 2025 were even with the total for the first half of 2024.
Aggravated assaults were up, but other Part 1 crimes were down.
Figure 3. Jefferson County Sheriff’s Office Patrol Area
PARCA’s data analysis stems from the Birmingham-Jefferson County Justice Governance Partnership, a collaboration between Birmingham, Jefferson County, the Jefferson County Health Department, the Sheriff’s Office, the District Attorney, and a wide array of other public agencies, nonprofits, and community groups. The BJC-JGP brings stakeholders together around a common pool of community and public safety data. The aim is to increase public safety through effective response and by improving underlying conditions that leave communities more vulnerable to crime.
Context
Homicides began rising in Jefferson County in 2015, which paralleled a national rise in homicides. Then in 2020, the number of murders in Jefferson County and around the country leapt sharply.
Each year from 2020 through the end of 2024, the total number of murders in Jefferson County has been twice that of the total recorded in 2014. Across the country, homicides began dropping in 2022, though in some cities, including Birmingham, the homicides continued to climb. By the end of 2024, homicides nationally were below pre-pandemic levels. Homicides were below the 2019 level in the rest of Jefferson County, excluding Birmingham, in 2024. However, Birmingham’s record total, which included multiple mass shootings in which four or more victims died, kept the county’s overall rate elevated.
The Council on Criminal Justice (CCJ) has been tracking trends in 40 cities across the U.S. and, in a 2024 year-end report published in January, found that homicides had decreased 6% from a 2019 baseline.
Figure 3. 40 U.S. City Homicide Trend
Theories on the National Rise and Fall of Violence
There have been various theories advanced about why murders began increasing in 2015 and continued to rise until recently. The CCJ’s Crime Trends Working Group cited various theories on what led to the rise in homicides. What follows is a summary of the points mentioned. The full text is available at the link above.
- Undermined Police Legitimacy: Beginning with the police-killing of Michael Brown in 2014 in Ferguson, MO, and increasing with the murder of George Floyd by Minneapolis police officer Derek Chauvin, decreased respect for law enforcement led to a surge in murders.
- De-Policing: In the light of the pandemic and protests, law enforcement and the criminal justice system generally decreased interaction and criminal case processing.
- Routine Activity Theory: This theory argues that crime stems from the combination of a motivated offender, a suitable target, and the absence of capable guardians. Covid-19 disrupted normal structures of support and engagement, and, at the same time, decreased protective services, leading to a rise in crime.
- Gun Sales: A spike in gun sales during the pandemic may have had an effect. However, other research suggests the consumers driving the spike in gun sales were largely already gun owners, and thus, the increased number of guns didn’t increase the number of people with guns. In Birmingham, the availability of devices that allow guns to function as if they were automatic weapons may have increased the lethality of shooting incidents.
- Bail Reform and Progressive Prosecution: Some observers blamed criminal justice reforms aimed at reducing long jail stays for people unable to post bail and a perceived pull-back in prosecutions. Covid also led to delays in prosecutions and criminal case backlogs. Other working group members disputed the theory, citing research studies that have found no impact of bail reform on rearrest or overall crime rate. In many jurisdictions, reforms were in place when crime was still falling. Also, after the pandemic spike, violence began falling, even in jurisdictions that maintained the reforms.
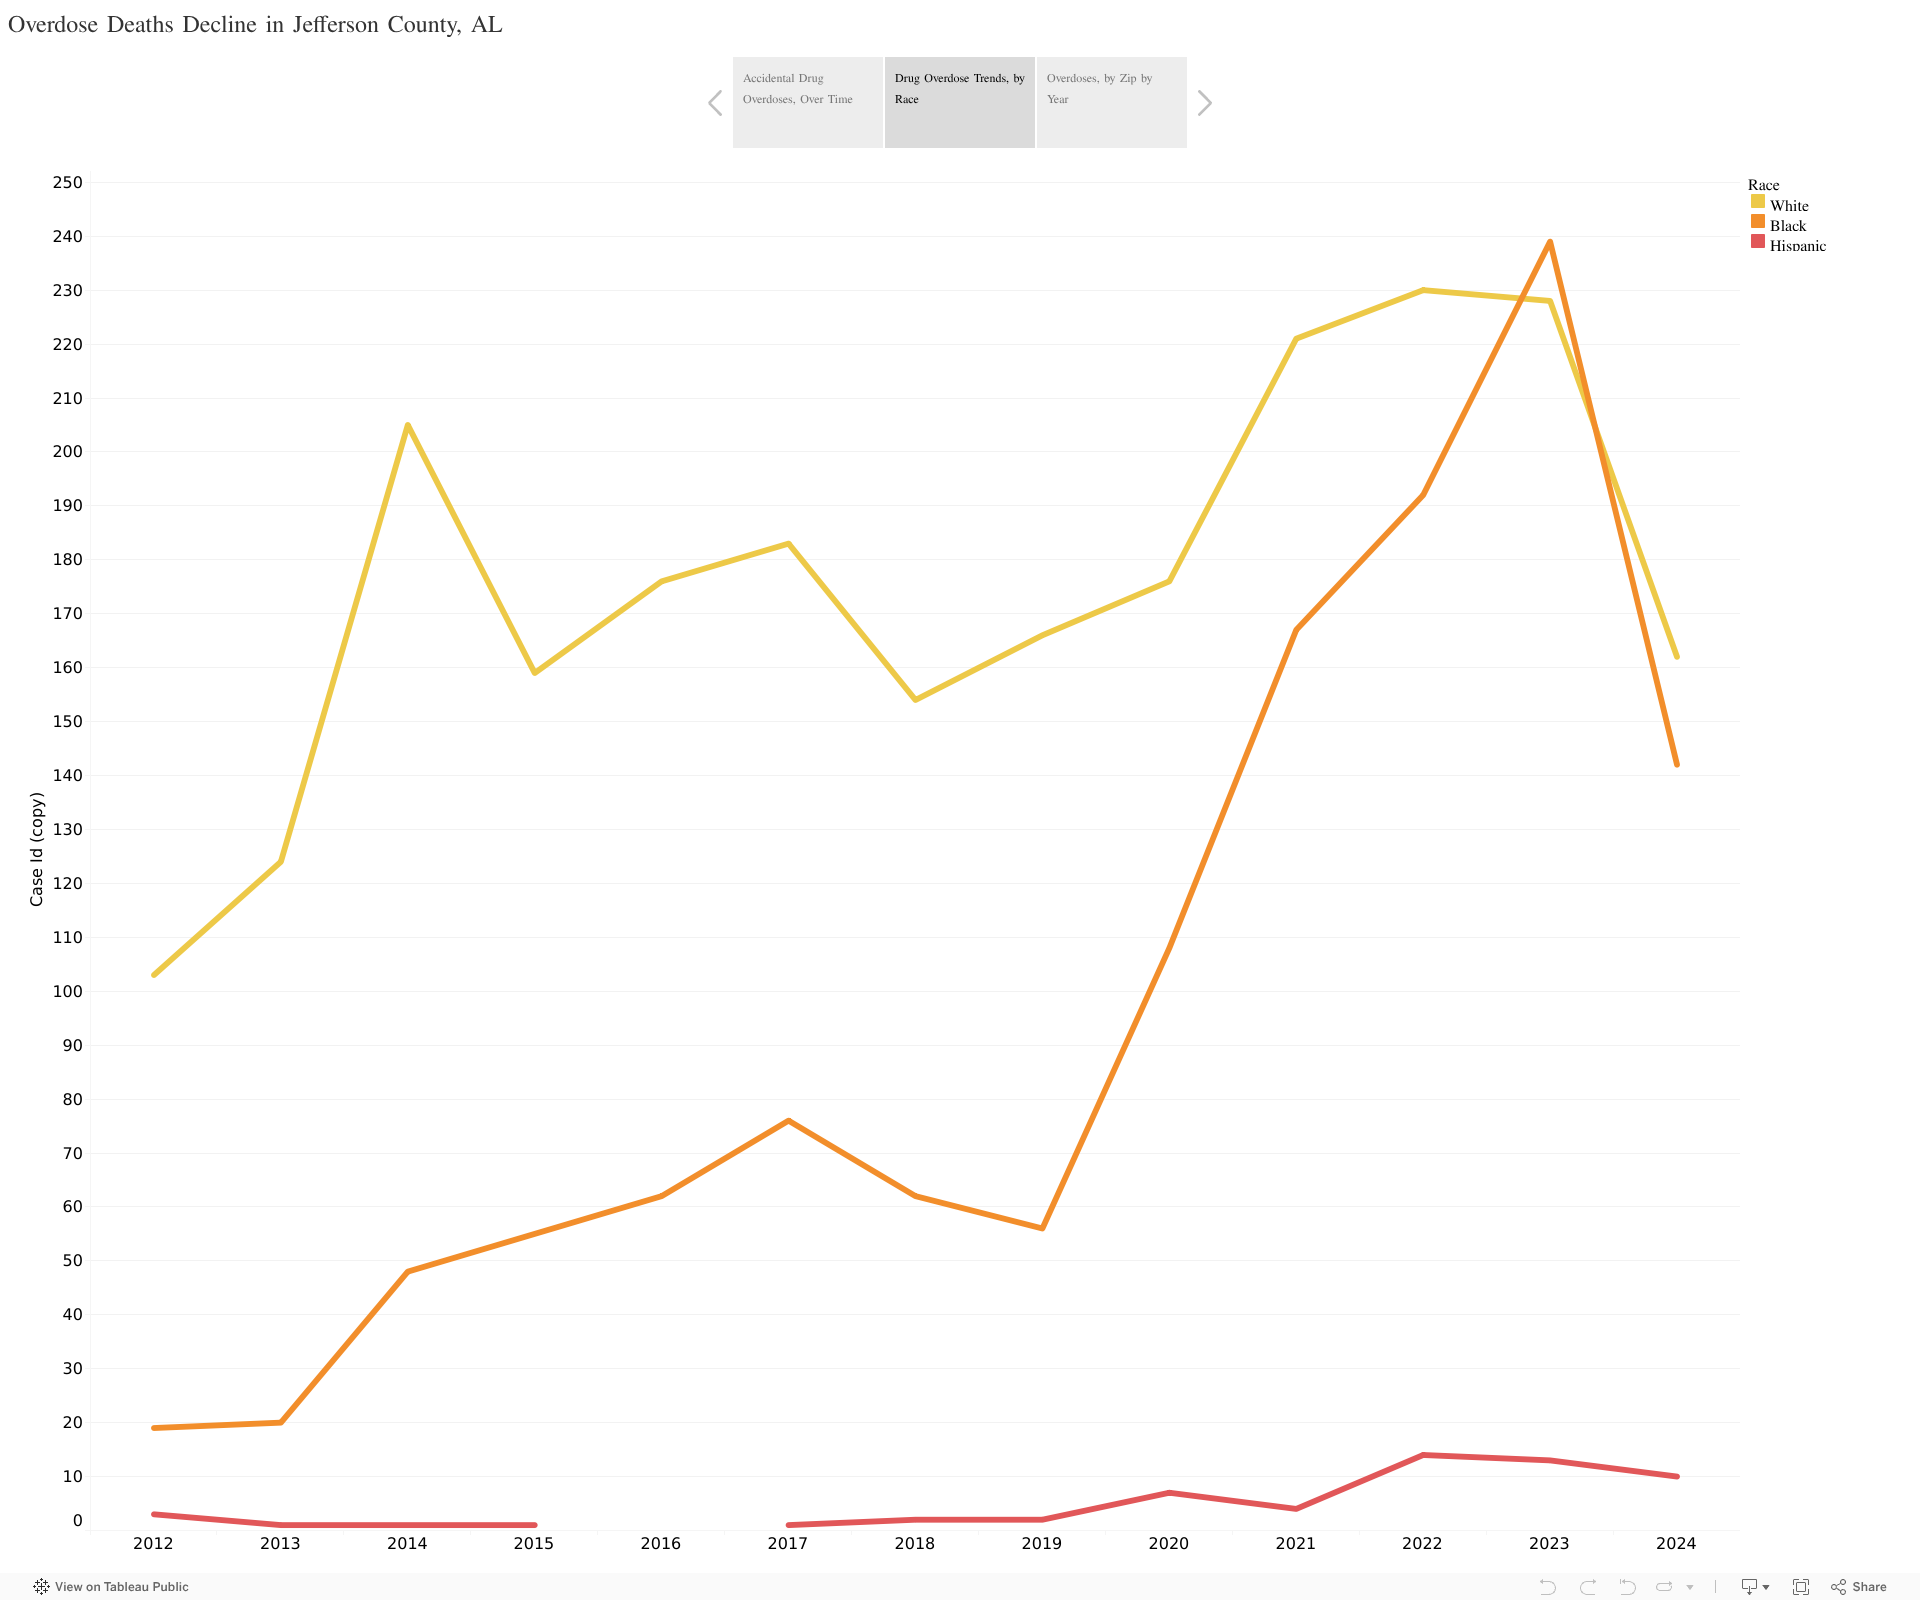
- Drug Market Disruption: The pandemic led to changes in where people obtained drugs and the kind of drugs available, including the rise of fentanyl. These disruptions coincided with the 2020-2021 spike in violence, suggesting a connection.
- Crime Reduction Interventions: A suite of approaches to violence reduction has become widely recognized as working together to reduce violence. Some of those programs were disrupted by the pandemic. In response to the violence spike, cities revived or launched new intervention programs, including both law enforcement strategies and community-based interventions, yielding decreases in violence.
Understanding Patterns and Targeting Interventions
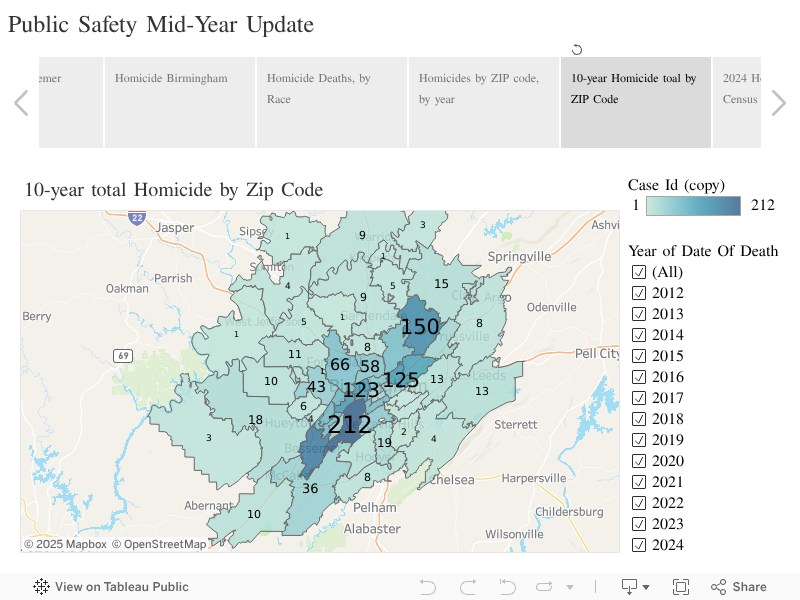
Research shows that violence tends to be concentrated geographically and disproportionately between and within social networks. Using Jefferson County Coroner’s data from 2012 to the present to map where homicide victims have been found reveals a stark pattern. Homicides disproportionately occur in Jones Valley in areas east and west of the central city, stretching down as far as Bessemer.
Figure 4. Jefferson County Homicides by Zip Code 2012-2025
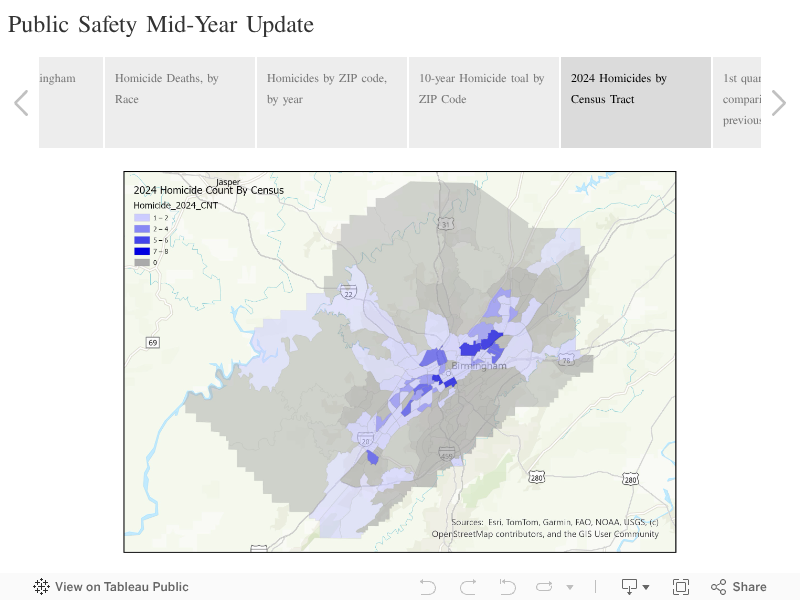
In 2024, homicides were even more concentrated. Figure 5 tallies homicides by Census tract. Tracts are a more compact geographic area than zip codes. Census tracts also tend to group neighborhoods and populations that are economically and demographically similar. In 2024, four Census tracts experienced seven or eight homicides apiece. Seven additional tracts saw five or six homicides. Homicides occurred in 85 of the 189 Census tracts in the county; 43 tracts experienced two or more homicides.
Figure 5. Jefferson County Homicides by Census Tract, 2024
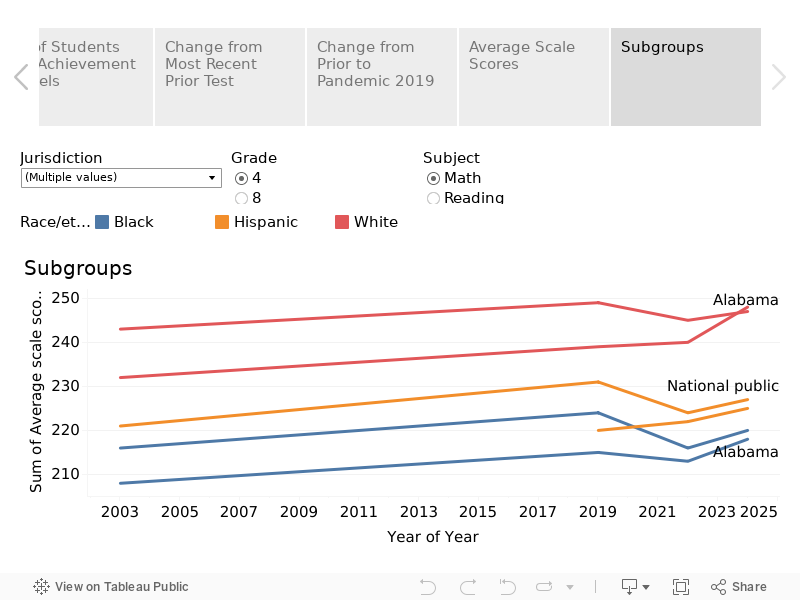
Homicide is impacting the Black community disproportionately. Blacks make up less than half of Jefferson County’s population, but, in 2024, 88% percent of Jefferson County’s homicide victims were Black.

Interventions That May Be Decreasing Homicides
There is no definitive answer to why homicides have dropped so precipitously and whether the trend will continue. However, the combined effects of multiple approaches to violence reduction may be paying off. These include changes to enforcement strategies and public health-oriented approaches to violence reduction.
Research shows that a small number of individuals are responsible for a disproportionate share of community violence. If the charges filed by prosecutors prove true, the arrest of one individual, Damien Laron McDaniel III, would be a factor in decreasing homicides in Birmingham. Initially arrested in October 2024, McDaniel has subsequently been charged with a total of 14 homicides over a 14-month period, including two 2024 mass shootings, both of which saw four people die.
The Birmingham police department and partner agencies have increased their use of focused deterrence, an approach endorsed by the Birmingham Crime Commission, a panel of community leaders and public health and safety officials convened by Mayor Randall Woodfin. In an interview with the Birmingham Times, Police Chief Michael Pickett described the formation of a Special Enforcement Division focused on high-crime areas and networks of individuals involved in violent crimes. The Division, working with federal and local partners, studies data, looks for patterns in time, geography, and among individuals, and works to interrupt those patterns.
The police department has succeeded in increasing homicide clearance rates, the rate at which a murder is followed by an arrest. By mid-year, arrests had been made in 30 of the 37 homicides from 2025.
Pickett said that community and business owners are increasingly cooperating with police by providing information. That increases the department’s ability to make arrests and allows the district attorney’s office to charge and successfully prosecute. The higher clearance rate increases community trust and encourages more communication and confidence that the information provided will be acted upon.
Beyond Enforcement
Cities across the country have increasingly recognized that improving public safety demands sustained investment in programs that interrupt patterns of violence and address the underlying community conditions. Birmingham, in conjunction with partner agencies, has launched a variety of these initiatives in the past two years.
One with a direct connection to violence is a hospital-linked violence intervention program supported by the Jefferson County Health Department and the City of Birmingham, Violence Intervention and Prevention Partners (VIP2). In recent years, public health officials have noted that violence often behaves like a contagious disease. That insight has led to the deployment of public health strategies designed to reduce violence.
A first step is to identify a population that is particularly susceptible to violent injury and intervene with education and support. Researchers have found that people admitted to the hospital with a gunshot wound are at risk of being shot again, returning to the hospital, or dying. Studies find that between 25%-40% of gunshot victims are, within a relatively short time frame, return to the hospital with another gunshot or are killed in a subsequent violent incident.
Each incident costs society. According to a study by Everytown Research & Policy, a gun safety advocacy group, on average, each nonfatal firearm injury costs taxpayers $25,250. Each firearm death costs taxpayers $273,904 in emergency response, health care, law enforcement, and criminal justice proceedings. In addition to the cost to taxpayers nd direct victims, each gunshot victim is connected to additional community members, from children and spouses, who also suffer costs.
VIP2 attempts to interrupt that cycle. Launched in October 2023, VIP2 provides support for patients admitted to UAB Hospital with gunshot wounds. Social workers with UAB’s Division of Trauma and Acute Care Surgery screen patients and refer willing participants to the Offender Alumni Association, which dispatches trained violence intervention specialists to the hospital.
The specialists, all of whom have had personal experience with gun violence, meet with the gunshot victim. The participants are admitted only if they commit to not retaliating against the person or group who shot them. If they do commit to participating, OAA provides an array of support, directly or through partners. Victims often face difficult physical recoveries. They are often financially devastated, facing medical bills and job loss. To avoid further violence, they may need help relocating.
OAA provides access to group therapy and mental health counseling. It also connects victims with education, job training, and job placement, and case-manages individuals in their recovery.
Since the fall of 2023, 175 individuals have participated in VIP2, with 105 currently receiving support. Only four participants have been reinjured. The Health Department and the City are cooperating to provide $1.1 million a year to support VIP2.
In addition, the City’s Office of Public Safety Initiatives is managing investments of federal and local money in violence reduction programs targeting youth, working with Birmingham City Schools, The Housing Authority, and Jefferson County Family Court and Detention Center.
The city, the Community Foundation of Greater Birmingham, and Regions Foundation are also supporting re-entry services for individuals returning to the community after serving prison terms. The goal of the program is to help returning citizens navigate to stability and avoid recidivism.