In late 2017, the Public Affairs Research Council of Alabama (PARCA) surveyed Alabama voters to determine their thoughts about the general direction of the state and the issues that most concern them. PARCA partnered with Samford University to survey policy professionals from across the state including academics, journalists, business and nonprofit leaders, and lobbyists. Their responses provided a list of 17 critical issues facing Alabama. PARCA partnered with USA Polling at the University of South Alabama to ask registered voters about these 17 issues. The voters’ responses generated the Top Ten list of voter priorities. Details about the survey and its methodology can be found in the full Alabama Priorities report.
Alabama Priorities
| 1. K-12 Education |
| 2. Healthcare |
| 3. Government Corruption and Ethics |
| 4. Mental Health and Substance Abuse |
| 5. Poverty and Homelessness |
| 6. Jobs and the Economy |
| 7. Crime and Public Safety |
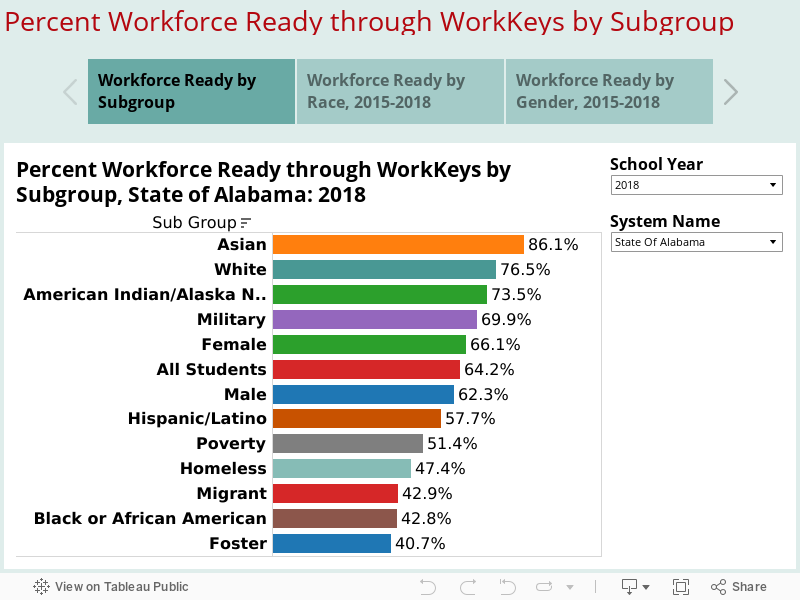
| 8. Job Training and Workforce Development |
| 9. Improving the State's Image |
| 10. Tax Reform |
Key Findings
- Voters broadly agree on the critical issues facing the state.
- Voters are not polarized along traditional political, ideological, racial, or generational lines. There is a significant gap between the priorities of experts and the priorities of voters.
- Policymakers have an opportunity to inform and educate voters on critical and systemic challenges facing the state.
- Policymakers have an opportunity to respond to immediate, often highly personal issues that concern voters.
- Elected officials and candidates have an opportunity to show leadership and to build broad coalitions to address Alabama’s most pressing challenges.
This summer and fall, PARCA will produce summary briefs on each of the top ten priorities chosen by Alabama voters. Each brief will answer four critical questions: what is the issue, why it matters, how Alabama compares, and what options are available to Alabama policymakers.
#1: K-12 Education
What is the issue?
K-12 public education is the highest concern for voters in Alabama. Seventy percent said they were very concerned, and this issue cuts across all political parties as a major concern. Eighty percent of Democrats indicate they are very concerned, followed by 60% of Republicans and 66% of independents. The key concerns cited by voters included funding, teacher preparation, class size, and low student achievement.
Funding
Forty-four percent of voters said that funding was their top priority related to education.
Alabama ranks 39th among the 50 states when it comes to per-pupil spending on K-12 education. According to data from the Alabama Department of Education, there is a wide disparity between spending in Alabama school systems, ranging from over $12,000 per student in Mountain Brook to $7,615 per pupil in Autauga County.
In 2015 Augenblick, Palaich, and Associates (APA) was commissioned by the Alabama Department of Education to study the adequacy and equity of school funding in the state.
To determine adequacy, APA looked to see what successful districts in Alabama spend per student. They also formed fifteen panels of school representatives from across the state tasked with estimating the resources needed to educate any student in Alabama and meet state standards. Chart 1 shows that the expenditures of state and local funds per student across the state in 2013 was considerably less than the estimated expenditure per student needed to provide an adequate good education, as estimated by the two approaches used by the APA study.
These actual and estimated expenditures of state and local funds per pupil are from 2012-13. Actual expenditures per pupil in 2015-2016 were $7,900 per pupil, still below what is recommended.
In addition to concerns about adequate funding, there is concern about the equity in the distribution of state school funds.
Alabama’s funding formula essentially treats all general education students the same, regardless of whether they need extra assistance, which costs money.
Differences in local property wealth enable wealthier districts to spend more on education and potentially create unequal opportunities to learn. A number of analytical studies have shown that Alabama’s school finance system has not met accepted equity standards.
Teacher Preparation
Surveyed voters expressed concern over teacher preparation, with 24% indicating it is their greatest concern related to education.
PARCA has documented the importance of teaching quality in developing student success. Effective teachers can produce gains of 1.5 grade levels, compared to gains of only a half grade among teachers at the bottom of the pool.
In September 2018, the Alabama State Department of Education issued report cards for the state’s teacher training programs, the Overall, new teachers scored on knowledge of teaching methods, but teacher candidates at a number of colleges fared poorly on mastery of the subject matter they planned to teach. In some cases, only 25% passed these subject matter exams on their first try, though most did pass by their third attempt.
Also included were results from a survey of school principals assessing the degree to which first-year teachers in their schools showed promise as effective teachers. The pie chart below shows that the majority (59%) entered the profession as effective teachers, with 41% still emerging and needing support, and a small percent needing more corrective remediation.
These are mostly encouraging results as research shows that new teachers learn and grow and become better with experience. Still, state policies surrounding teacher certification vary, and there is debate on what aspects of teacher training are most important. Knowledge of teaching methods and human development continues to be highly valued, but critics in the field argue that more time needs to be spent actively learning through practice teaching in the field with a mentor observing and providing meaningful feedback. Studies are also showing a strong connection between teacher subject matter knowledge and impact on student learning.
Class Size
Class size was identified as a concern by voters in Alabama, and 10% said it was the issue about which they were most concerned. In Alabama, mandated class sizes are established through a teacher-pupil ratio, which provides for smaller classes in earlier grades. Established ratios in Alabama include Grades K-3: 1-18; Grades 4-6: 1-26; and Grades 7-8: 1-29. When districts have to cut their budgets, teachers are let go and class sizes rise.
Support for reducing class size came from research that found small classes could have a positive influence on student achievement. Other researchers have warned that caution is needed, finding that teachers do not necessarily change their instructional practices when class size is reduced and that some subjects may be taught equally as well in larger classes.
Still, it does appear that very large class-size reductions of 7-10 fewer students per class can have significant long-term effects on student achievement. The academic effects seem to be largest when introduced in the earliest grades, for subjects focused on hands-on group activities, and for students from less advantaged family backgrounds. They may also be largest in classrooms of teachers who are less well prepared and effective in the classroom. This leads critics to point out that concentrating on developing effective teachers is the best approach since effective teachers can help students learn in both large and small classes.
Student Achievement
Student achievement was identified as an important issue and was the top concern of 16% of voters. In reality, each of the concerns identified in this brief are justified as concerns primarily in how they affect student achievement or student learning, the primary goal of schooling in most settings. Ultimately student achievement is influenced by a number of factors. Research has found that the education level and income of a student’s parents are the most influential factors shaping how a student performs in school and their later success. At the same time factors at the school and teacher level can make a difference:
- High-quality expectations for all students
- A rigorous and relevant curriculum
- Extracurricular activities that encourage student personal growth
- High-quality teaching that encourages student investigation, active learning, and methods that appeal to students with different learning styles
- Enriched use of new technology in teaching and learning
- Effective use of small classes
- After school support, tutoring, assistive technology, and more intense individual support as needed
- Effective instructional leadership
- Quality leadership, culture, and resources
Why Does Education Matter?
Education is important to a number of people because it will impact their future and the future of their children. Research shows that education has a positive impact on employment, lowers cost for crime, and improves personal health.
Employment and Economic Development
In 2017 the median wage for college graduates was more than twice that of high school dropouts and more than one and a half times higher than that of high school graduates. The unemployment rate was three times lower than for high school drop-outs and two times lower than for high school graduates. Eeducation supports economic development and helps build communities that draw businesses and strengthens cultural institutions.
Lower Crime
Research has found that schooling significantly reduces the probability of incarceration. According to data from the U.S. Bureau of Justice, 56% of federal inmates, 67% of inmates in state prisons, and 69% of inmates in local jails did not complete high school. Education becomes a strategy for reducing crime, personal tragedies, and the economic costs associated with crime.
Impact on Health
Finally, among many other outcomes, education is positively associated with good health. In the US, adults without a high school diploma can expect to die nine years sooner than college graduates. In today’s knowledge economy, an applicant with more education is more likely to be employed and land a job that provides health-promoting benefits such as health insurance, paid leave, and retirement. Conversely, people with less education are more likely to work in high-risk occupations with fewer benefits. Furthermore, education is positively associated with the likelihood of eating healthy foods and exercising regularly.
How Does Alabama Compare?
Unfortunately, Alabama’s education system has consistently ranked among the lowest in the nation, and low among other southern states. Education Week, a highly recognized national publication, annually publishes a ranking of state educational systems using rigorous methods focused on 1) student chance for success (family income and education, enrollment in pre-K, enrollment in postsecondary education); 2) adequacy and equity of educational funding; and 3) student achievement measured by math and reading performance, high school graduation and results from AP testing. Their ranking continually places Alabama between 43rd and 45th among the states, with a grade of D- or C- overall. Where Alabama ranks best is in “chance for success” (grade of C )[i].
Ed Week gives Alabama’s education funding a D+ overall. On various spending indicators it gets an F. Alabama’s education spending is low when compared to other states and the nation. But when spending is adjusted for cost of living differences, it is comparable to other southern states, though still below national averages. For equity, it gets a B+, which raises a few eyebrows. The state share of all education funding is relatively high in Alabama and in other southern states, as well as the amount generated by Federal funds. This creates equity. It is in the capacity of local districts to raise funding through property taxes that inequities occur. Still, the relationship between per-pupil spending and district wealth in Alabama is comparable to other southern states.
Ed Week’s rankings gave Alabama an F for the current status of student achievement, though the state received a D+ for improvement over time and a B for lower achievement gaps between low- and high-income students. There clearly are large differences in scores on state tests between the wealthiest and poorest districts in the state, and performance appears to be correlated with wealth. At the same time, PARCA’s report on student achievement in 2017 found both high poverty and low poverty students in Alabama scoring low when compared to national averages on the National Assessment of Education Progress (NAEP). NAEP provides standardized tests in math and reading that serve as benchmarks for comparing Alabama to other states. Chart 2 compares the percentage of students in Alabama and the US scoring proficient or above on those tests.
NAEP tests are highly demanding, and students in the highest performing states generally do not score beyond 50-60% proficient or above. On a positive note, though Alabama’s results on NAEP have not substantially changed in recent years, results show significant improvement over the past 12-15 years.
What Can Alabama Do?
Strengthen student-based funding
The Augenblick and Palaich report recommended that Alabama consider adopting a student-based funding model that recognizes differences in student needs. This model would seek to spend funds strategically to help each student reach their potential. Another related approach is to adopt a zero-based method focused on estimating costs for meeting state standards that would account for student differences.
Other proposals for improvement focus on setting a long-term plan for achieving adequacy in funding and increasing local funding as a percent of total funding. One approach is for the state to provide a match for local funds with extra fund devoted in low-wealth communities. Both solutions require more funds devoted to public education. One frustration is that increasing funds for education does not always lead to better schools, teaching, and student achievement. While a fair, base amount of funds is critical, other issues get in the way, such as how districts and schools use their funds and the degree to which high performing teachers are motivated to teach in particular communities or schools. Still, studies have demonstrated that when local funds are strategically targeted at supporting students who have been flagged for needing assistance, a positive impact on learning can occur.
Improve Teacher Effectiveness
Alabama’s report card for teacher training program indicates that new teachers would benefit from greater expertise in subjects they will be teaching. A review of varying approaches to strengthening knowledge of subjects being taught is merited.
Practice in a live classroom setting is essential for new teachers. Alabama already assesses classroom performance in the credentialing process, but attention should also be paid to giving prospective teachers experience in a variety of settings including high-poverty and high-risk schools.
Research has also shown value in pairing prospective teachers with experienced teacher coaches and mentors. Moreover, once teachers enter teaching, it is important that they continue to be supported by access to high-quality, standards-aligned instructional resources and curriculum-based professional learning.
Decisions regarding class size reduction should be made strategically and combined with professional development.
The substantial expenditures required to sustain smaller classes must not only be justified by the impact on student learning by itself but also weighed in regard to other interventions that impact learning.
Research has identified conditions under which small classes and class size reduction is most effective. Rather than mandating across the board reductions or increases in size (in response to budget cuts) districts and schools might benefit from having the freedom to strategically maintain small classes where they are most needed and increasing class size where they are less likely to make a difference.
Furthermore, not all teachers are prepared to take advantage of the benefits of a small classroom. Implementation of small classrooms needs to be accompanied with professional development on how best to maximize learning in a small class.
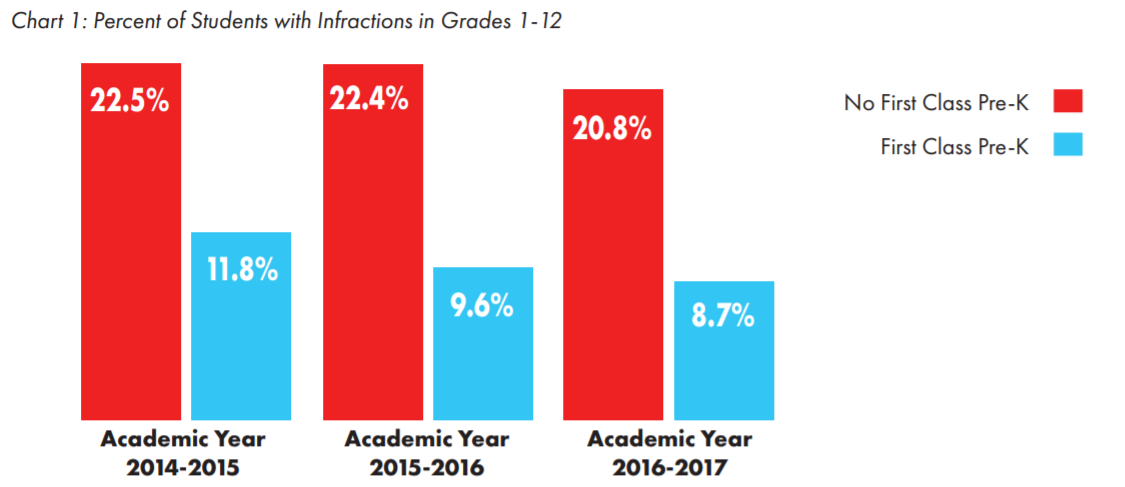
In addition to the Alabama Reading Initiative, expand access to high-quality Pre-K educational support.
The early years of school through the 3rd grade are critical points in brain development and in shaping a child’s educational and life experiences. Learning to read in the early grades, as promoted through the Alabama Reading Initiative – is an essential part of early development.
But even before that, a stimulating and supportive environment during the preschool years provides a foundation for sustained success.
Pre-school services in Alabama are offered through a diverse delivery model that includes public school systems, childcare centers, Head-start centers, university-based labs, and community organizations such as the YWCA.
To improve the quality and availability of Pre-K education, Alabama nationally recognized First Class Pre-K program provides training, materials, and financial support through the Alabama Department of Early Childhood Education (DECE), Office of School Readiness (OSR). Continued investment in the spread of quality Pre-K is warranted as many families and children are still on waiting lists for attending First Class Pre-K programs
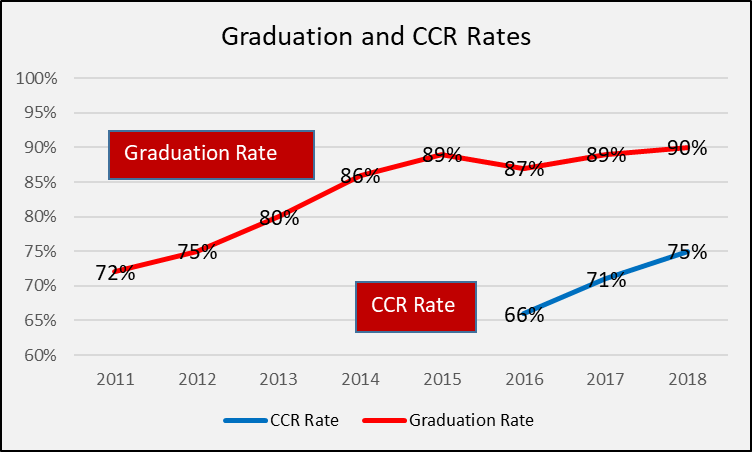
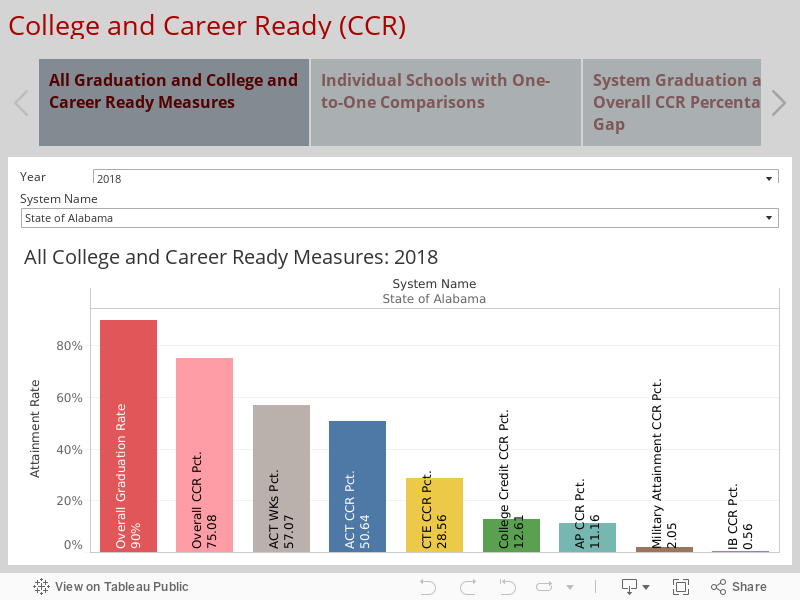
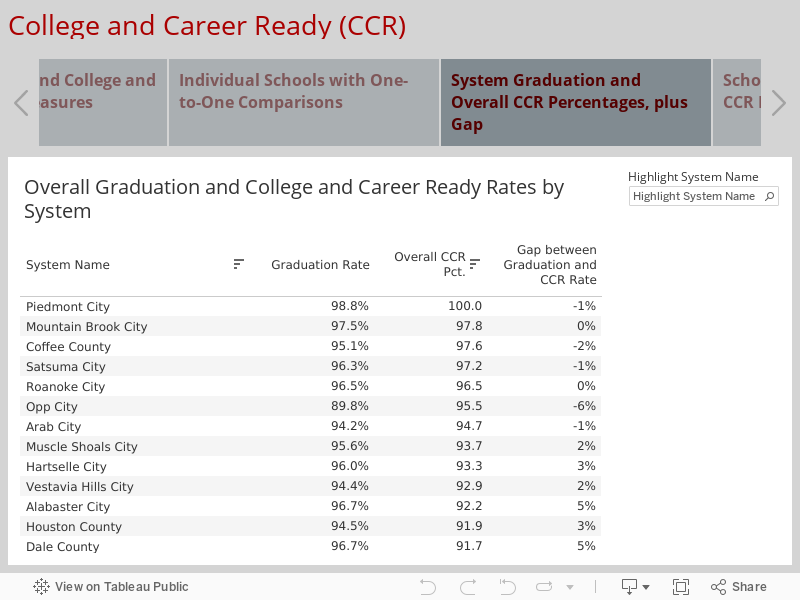
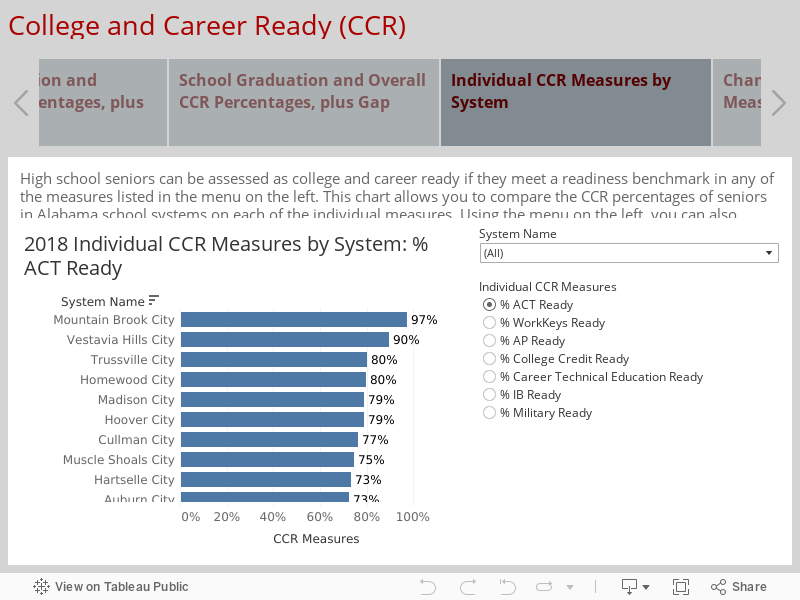
Strengthen the capacity of local school systems to collect, analyze and use performance data aligned with college and career readiness.
Alabama has made progress in setting standards for college and career readiness that can serve as benchmarks goals for helping students learn and grow. Assessment data can be used to measure the impact of school and classroom interventions on student learning. Effective assessments that produce fine-grained data identify students who need assistance. Support can be targeted at helping these students through after-school programs, tutoring, study skills workshops, personal counseling and mentoring, and individual reading support. Currently, a number of districts lack the capacity to effectively engage data in this way and assistance through regional centers, universities, or organizations like PARCA is needed.
Experimenting with School Vouchers for Low-Income Students
School vouchers provide funded scholarships that allow students to attend a private school of the family’s choice, an option otherwise unavailable to low-income families. After reviewing research some analysts have surmised that vouchers are not likely to increase or reduce student learning, but that competition induced by vouchers has led to improved public schools. This needs to be studied further.
The Alabama Accountability Act provides for a form of vouchers through a program which distributes scholarships to low-income students in Kindergarten through 12th grade to use in participating non-public and public schools. Through the scholarships, parents can choose school environments they perceive as being better equipped to help their children succeed as well as develop attributes and values that go beyond academic test scores.
Recent research conducted by the University of Alabama Institute for Social Science Research found that students receiving scholarships performed similarly to public school students on standardized tests. The study did not compare scholarship recipients with students attending the public school they would have attended without the scholarship, but rather compared them with public school students across the state. Continuing attention should be paid to assessing the results on for students benefiting from scholarship and the impact on of the scholarship program on public schools.
Conclusion
Developing an education system that helps all children learn is good for Alabama. Low performance and unequal opportunity to learn in public education are often described as “wicked problems” because they are highly resistant to being resolved. PARCA believes Alabama can do better. With effective Pre-K, the growing belief that all students can learn, and new economic development led by strong leaders – Alabama’s educational goals are within reach – and this gives us hope.
[i] Ed Week (2018). State grades on K-12 Education: Map and rankings. Quality Counts 2018. https://www.edweek.org/ew/collections/quality-counts-2018-state-grades/report-card-map-rankings.html
To read the full PDF brief, including tables and charts, click here.