Alabama’s 2015 graduating class was the first in which all students took the well-known college readiness test, the ACT. New state-level reports on the 2015 results provide a wealth of information that can be useful to parents, students, and educators.
Before we take a closer look at Alabama’s results, it’s important to understand the benefits of having all students take the ACT. It’s also important to understand the consequences of that choice.
Students take the ACT to demonstrate they’re ready for college. Colleges use the results to help determine whether an applicant is admitted and whether he or she qualifies for a scholarship. Before public schools started offering the ACT, some students didn’t take it. For some, the cost was an issue. Some didn’t plan on going to college. Others might have had difficulty arranging to take the test outside of school and outside of school hours.
Now, all students have the opportunity to take the test in a convenient location at no cost to the student. This should increase college-going opportunity. And since the test is taken by high school juniors, students can focus during their senior year on areas of weakness, so that they can go to college better prepared to succeed. The ACT has four subject areas – English, reading, math and science. According to ACT, a student who scores at or above the readiness benchmark in the given subject has a 50 percent chance of making a B or better in a college-level class and a 75 percent chance of making a C or better.
The ACT is designed to test what a student has learned in school. Alabama has adopted another set of tests produced by ACT, the Aspire, to test children in grades 3-8 on what they’ve learned at each grade level. Aspire results are intended to predict roughly a student’s trajectory toward success on the ACT; students who exceed the readiness benchmark on the Aspire are expected to be on track to perform well on the ACT.
Alabama’s decision to give the ACT to all high school juniors makes a lot of sense. However, it significantly changes the pool of students taking the ACT in Alabama. Now, it’s not just the kids who plan to go to college taking the test; it’s everyone.
Alabama’s State Board of Education has set a goal of having 90 percent of Alabama high school students graduate and graduate prepared for college and career. The ACT is just one measure of whether those students are college and career ready. The ACT is designed to predict success at a four-year undergraduate university. Not every high school graduate is headed for a university. Some career-ready students will head straight into the workforce, into technical training, or the military. So, ACT results are not the only measure of career readiness. That being said, it’s a measure the state needs to see improve. Only 16 percent of the 2015 graduates were college-ready in all four subjects.
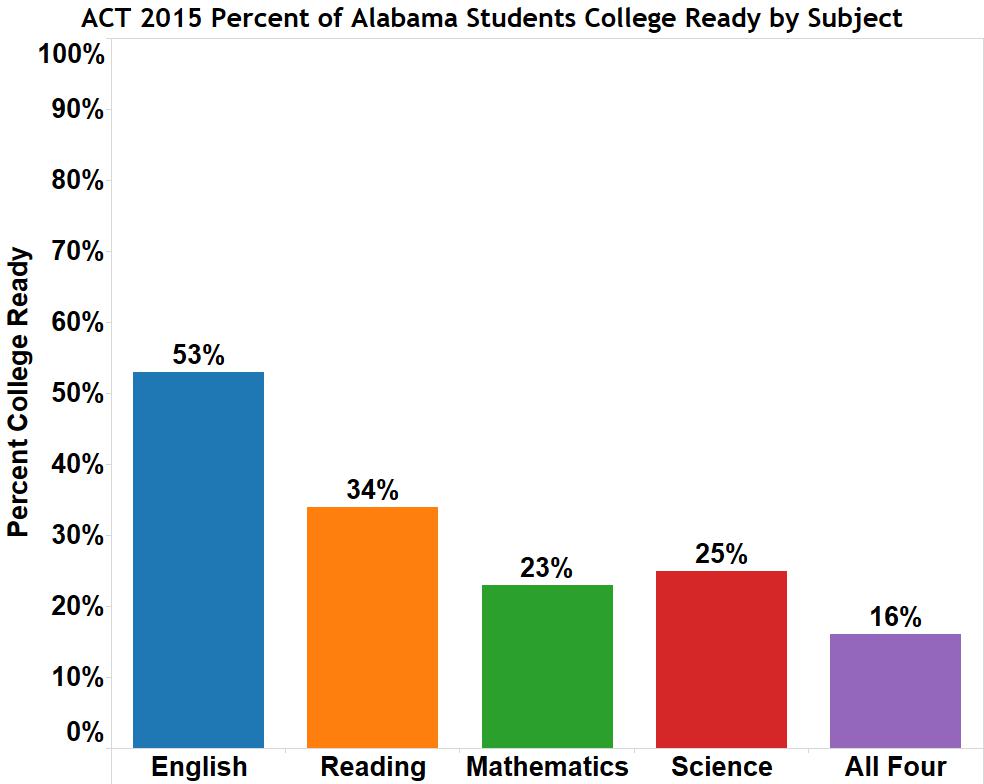
Since the 2015 results are the first in which all Alabama graduates took the ACT, these scores serve as a baseline from which to build. Alabama’s 2015 results shouldn’t be compared with results from previous years when the only students taking the ACT were those planning to go to college. However, the general pattern of results is similar: a higher percentage of Alabama students beat the benchmark in English and reading; while fewer are college ready in math and science.
Another caution on comparisons, comparing Alabama’s 2015 scores to the national average is not completely fair. At the national level, the pool of students taking the ACT is more heavily weighted with students who are college bound.
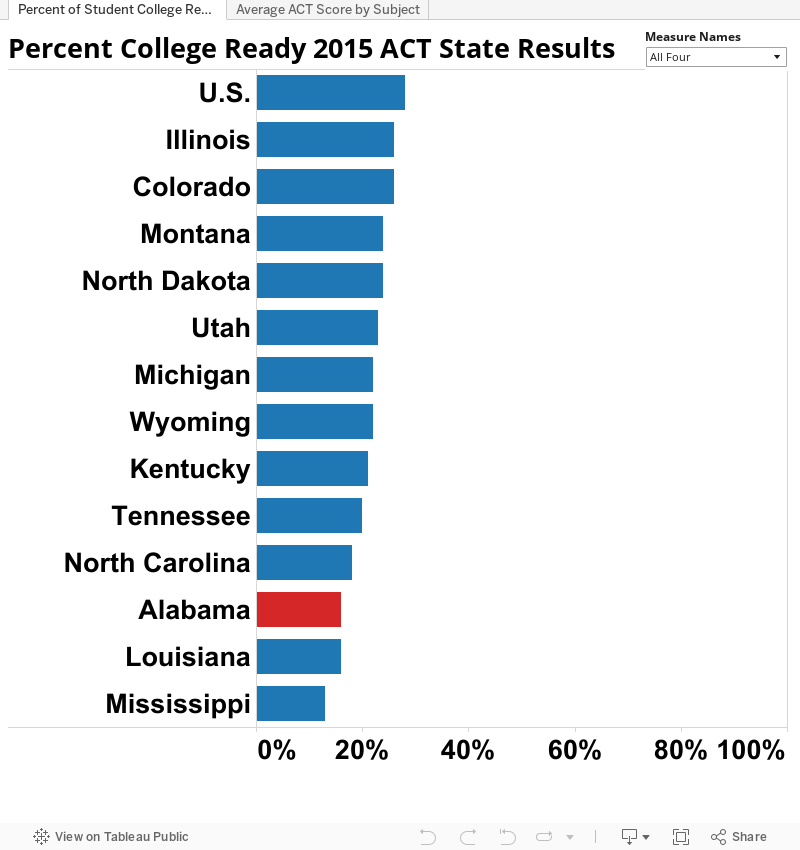
But Alabama’s new scores can be compared with those of 12 other states that give the ACT to all of their students. (For the record, ACT reports that 100 percent of Mississippi graduates took the test. However, according to the Mississippi Department of Education 2015 was the first year that all that state’s juniors took the ACT. That would indicate Mississippi results won’t be 100 percent of students until next year). In the chart below, you can look through the results subject-by-subject. You can sort the results by selecting the bottom axis and choosing the icon for ascending or descending results. There are two tabs on the top of the chart. The first allows you to look at the percentage of students who scored at or above the ACT benchmark for college readiness. The other tab allows you to look at the average composite score for each state in each subject area. You’ll notice some familiar patterns in the results and some surprises. Alabama outperforms Mississippi across the board while Kentucky and Tennessee consistently outperform Alabama. Somewhat surprisingly, considering North Carolina’s historic leadership in public education improvement, that state lags behind Alabama on some measures.
Giving the test to all was a brave step in honest reporting of education measures. Regardless of comparisons and statistical nuance, it is clear Alabama has significant room to grow in producing high school graduates who are ready for success in college. Fortunately, Alabama K-12 education does have a plan in place for improvement. Plan 2020 has strategies and goals that start with Pre-K and continue through to college and career success. Hopefully, as a result of these concerted efforts being made across the educational spectrum, we’ll see Alabama ACT scores rise over time.