How Alabama Compares in the Percentage of the Population Lacking Health Insurance
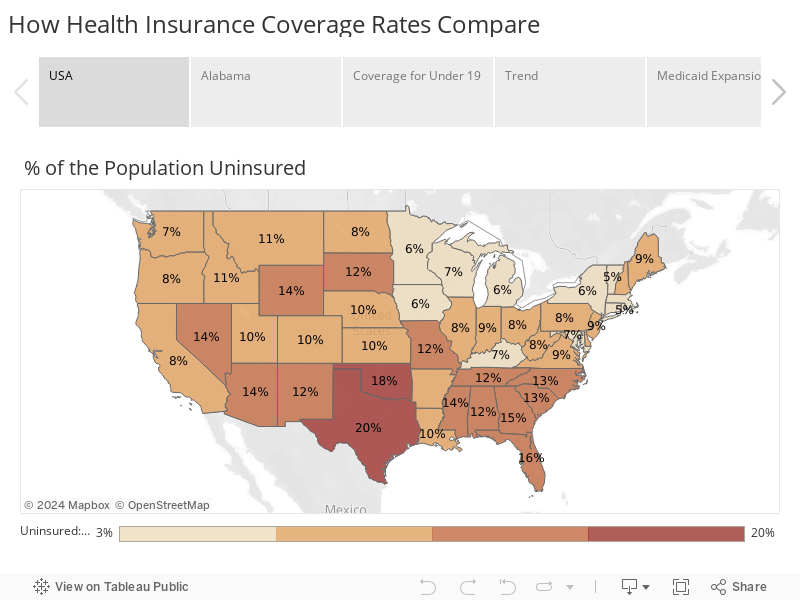
The percentage of Alabamians without health insurance rose between 2019 and 2020, according to the latest estimates from the U.S. Census Bureau. In 2020, 11.8% of the population under 65 was uninsured, compared to 11.6% in 2019.
Nationally, the uninsured rate declined from 10.8% to 10.4%. Alabama ranks 39th among the states in the percentage of its population with health insurance.
Comparison Among States
The latest estimates come from the Census Bureau’s Small Area Health Insurance Estimates (SAHIE). The Bureau has built an interactive tool for exploring the data in depth at the national, state, and county levels.
With the implementation of the Affordable Care Act in 2014, Americans gained access to health care exchanges and subsidies, which increased the percentage of people with health insurance. The law also encouraged states to expand Medicaid eligibility in order to provide health insurance to more low-income individuals. To date, 12 states, including Alabama and several other Southeastern states, chose not to expand Medicaid. Those states tend to have higher percentages of their population uninsured.
Three Southeastern states did expand Medicaid eligibility. Those states have a smaller percentage of the population uninsured than Alabama: Kentucky, 6.9%; Louisiana, 9.6%; and Arkansas, 10.2%.
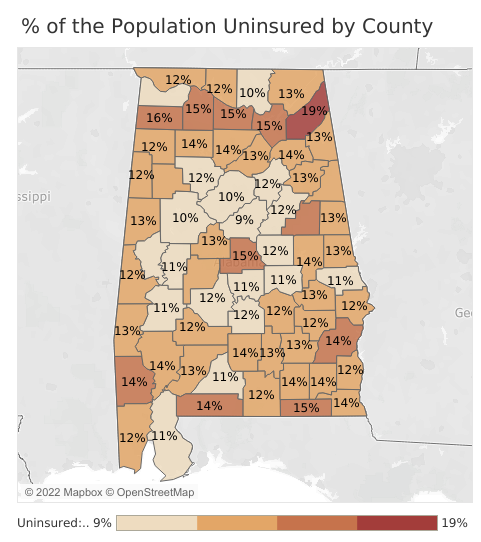
Health Insurance By County
Dekalb County has the highest percentage of the population without insurance, at 19%. Dekalb and other counties across North Alabama have a greater share of residents who are Hispanic compared to other parts of Alabama. Nationally, the health insurance rate is much lower among Hispanics than in other demographic groups. On the other end of the spectrum is Shelby County, which has the lowest percentage without insurance, 9.3%
Coverage For Children: A Bright Spot for Alabama
Alabama ranks in the top 20 when it comes to providing health insurance to children. Only 3.6% of individuals 18 and younger lack health insurance, largely thanks to the ALL Kids, Alabama’s Children’s Health Insurance Program (CHIP). The program is administered by the Alabama Department of Public Health and Blue Cross Blue Shield of Alabama (BCBSAL) to provide medical, mental health, and substance abuse services through their preferred provider organizations (PPO).
Conclusion
Alabama has policy options for decreasing the number of people who lack health insurance. Recent federal legislation has provided additional incentives to expand Medicaid. An analysis by PARCA and the Center for Economic Development and Business Research at Jacksonville State University found that expanding Medicaid coverage to low-income adults in Alabama would actually save the state almost $400 million per year over the next six years. Much of that savings would come through having federally supported Medicaid coverage pay health care costs that are currently paid for by other state programs. Expansion can be handled by expanding coverage under the government program or a through insurance policies subsidized by Medicaid funding but offered by private companies.
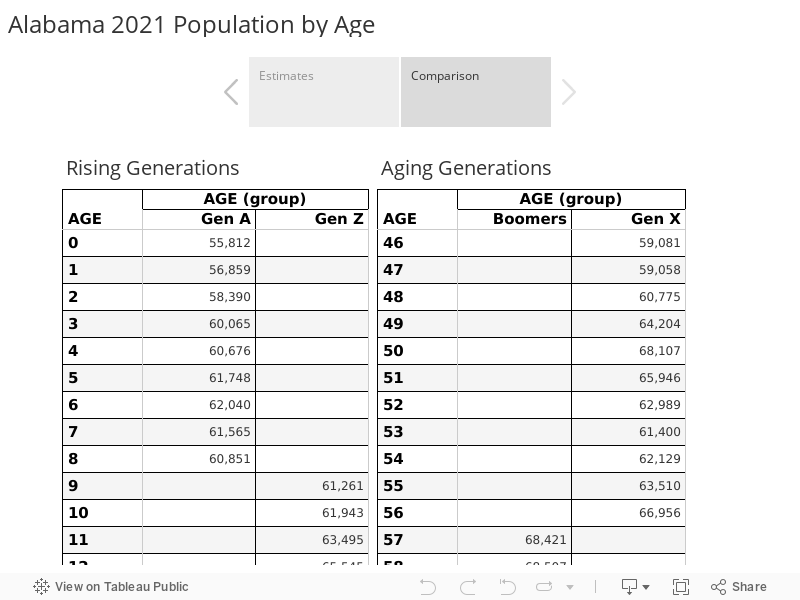
Alabama Population Dynamics and Workforce
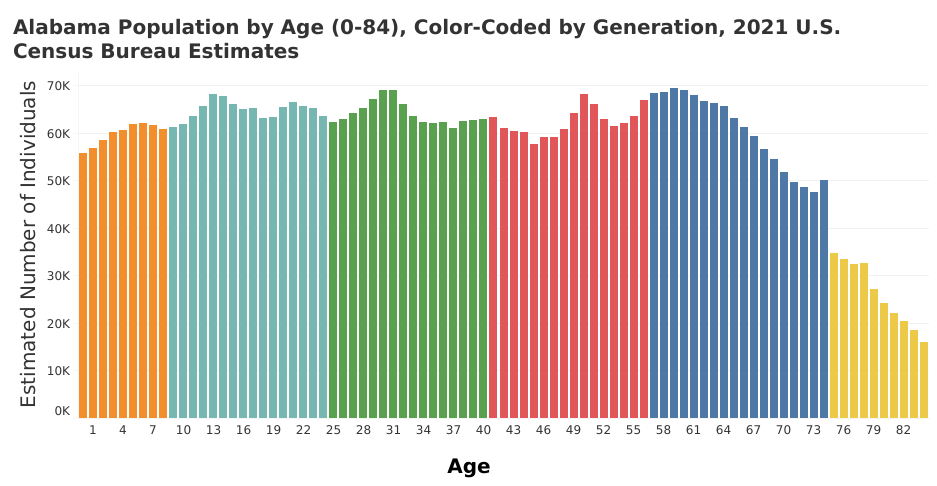
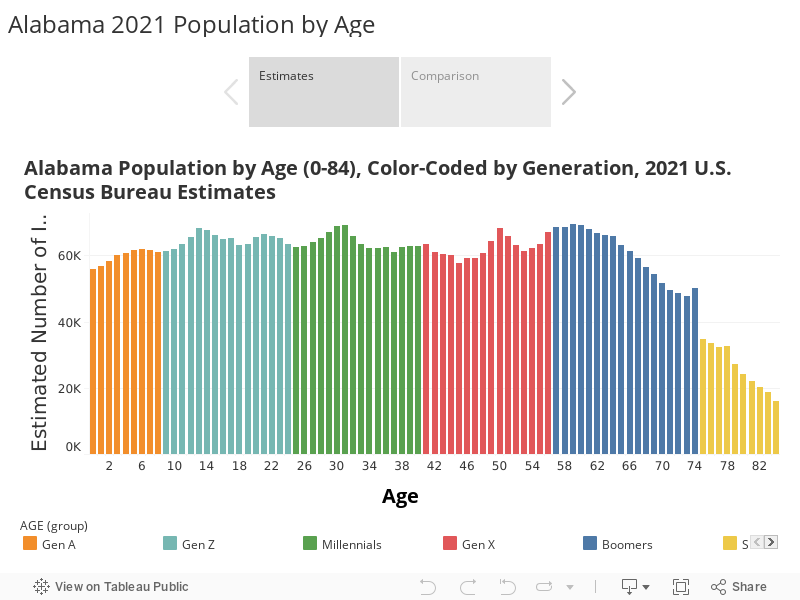
Absent immigration from other states or from abroad, Alabama’s working-age population is on track to shrink in coming years, according to a PARCA analysis of new population estimates from the U.S. Census Bureau.
(Not represented in the graphic are the more than 85,000 Alabamians the Census estimates included in the 85 and older category).
The 2021 Census population estimates by age provide a preview of the number of individuals that will join the workforce and the number that will likely be leaving it. Two factors are conspiring to create downward pressure on the working-age population:
Large numbers of aging Baby Boomers are likely leaving the workforce
The smaller rising generations, Gen Z and Gen A, will provide fewer replacements for those retiring workers.
In 2021, the Census estimates there were 65,730 64-year-olds in Alabama vs. 63,125 18-year-olds, a difference of about 2,600.
In every successive year thereafter, the number of Boomers exceeds the corresponding Generation Z cohort.
The gap widens significantly when today’s 11 and 12 years reach the age of 18. In 2008, with the advent of the Great Recession, birth rates fell. And they haven’t recovered.
Even when the Baby Boom has moved out of the prime working years, the number of potential leavers will outnumber new entrants, based on the current age structure of the Alabama population.
Considering only the current population, over the next 18 years, Alabama’s population between the ages of 18 and 64 will drop by a cumulative total of more than 50,000.
However, current residents only make up part of the story. Population growth is also influenced by migration and birth and death rates. Labor force supply is also affected by migration, by labor force participation, and indirectly by educational and skills attainment.
In terms of the natural population increase, Alabama has already seen two successive years in which deaths exceeded births. In 2021, about 8,500 more people died than were born, according to the estimates. This is due to the larger number of people moving into old age and the elevated death rates associated with the Covid-19 pandemic.
In terms of migration, changing patterns are affecting population and labor supply. From 2010-2016, most of Alabama’s population growth came through international immigration, with the state annually adding about 10,000 new residents who had been born abroad.
Since 2018, international migration has dropped, but domestic migration has increased.
In recent years, Alabama has enjoyed a net positive inflow of residents from other states, about 20,000 new residents a year from that source.
With unemployment low and demand for workers high, Alabama may continue to attract new residents through migration. But at the same time, the state is trying to increase the quality and the quantity of Alabama’s homegrown labor force:
By improving the education and training of the rising generation so that they are equipped for 21st-century jobs
By bringing Alabamians who’ve fallen out of the workforce back in
An array of state initiatives are underway to improve student preparation:
the expansion of First Class Pre-K
the Alabama Literacy Act
the expansion of Advanced Placement classes, high school/college dual enrollment, and the expansion of career technical education.
On the labor force participation front, through the Success Plus Initiative, the Alabama Workforce Council, the Governor’s Office, and an array of state agencies and participating nonprofits are collaborating on strategies to bring more people into the workforce training and education systems. The initiative seeks to address barriers individuals face to participating in the workforce and training. Through cooperation and outreach, the partners hope to reach discouraged workers and provide them pathways to high-demand fields.
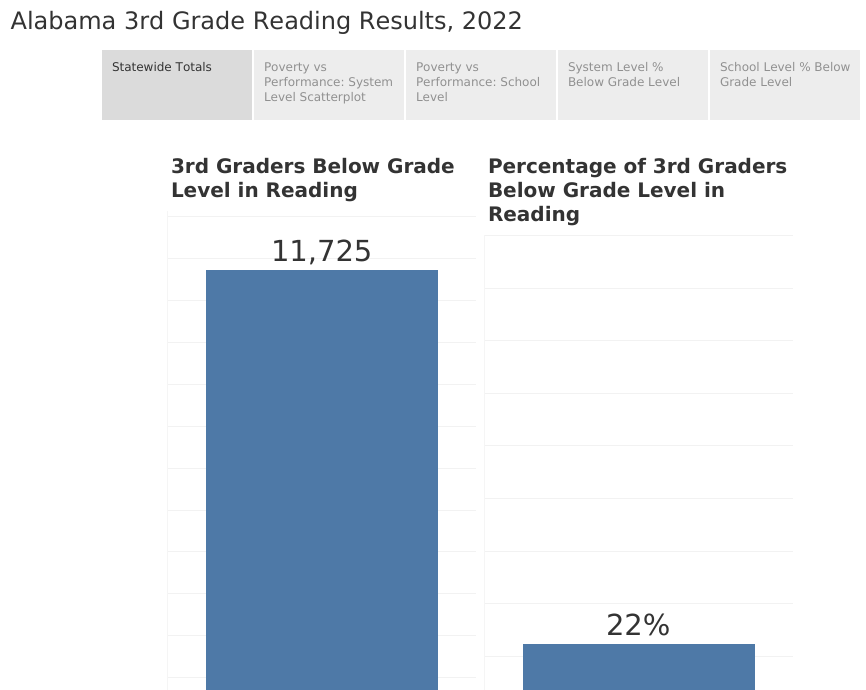
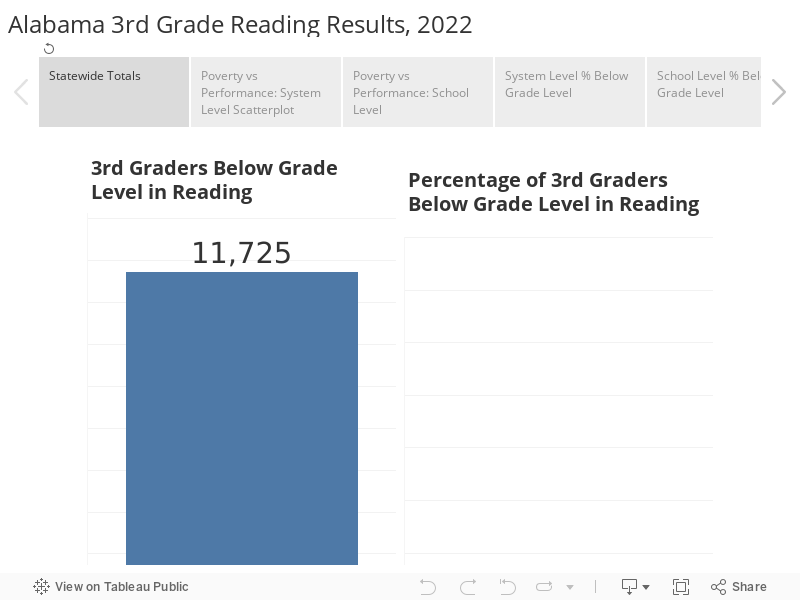
Progress Made But Over 20% of Alabama 3rd Graders Not Reading on Grade Level
Fewer third graders scored below grade level in reading in 2022 compared to the previous year, according to results released by the Alabama Department of Education. Still, 22% or 11,725 students statewide failed to meet that critical educational milestone.
The Alabama Literacy Act, passed in 2019, has sharpened the focus on early grades reading and directed coaching support and additional resources to support reading instruction based on the science of reading. The law now requires all schools to assess all students in reading from kindergarten through third grade. If a K-3 student is identified with a reading deficiency, the law requires the child’s parent or guardian to be notified of the deficiency within 15 days. The school is required to develop and implement an intervention plan for the student within 30 days. Identified students are to receive intensive support from specialists trained in the science of reading during school, before or after school, and over the summer until that student’s deficits are addressed.
“Each K-3 student who exhibits a reading deficiency or the characteristics of dyslexia,” the law reads, “shall be provided an appropriate reading intervention program to address his or her specific deficiencies. Additionally, students shall be evaluated after every grading period and, if a student is determined to have a reading deficiency, the school shall provide the student with additional tutorial support.”
“Each identified student,” the Act continues, “shall receive intensive reading intervention until the student no longer has a deficiency in reading.”
The 2022 results represent a slight improvement over 2021, when 23% of students scored below grade level on the reading portion of the Alabama Comprehensive Assessment Program (ACAP), the statewide standardized test administered to students each spring.
The Literacy Act will eventually require that, to be promoted to fourth grade, students must demonstrate that they can read at grade level (some exceptions apply). That provision of the Act was delayed by the Alabama Legislature in light of the Covid-19 pandemic. The children entering third grade this fall will not face the retention requirement. However, the rest of the law is in force. Schools and systems must identify and provide intervention services to children in grades K-3, including summer learning camps. All parents of second and third graders who scored below grade level on the reading portion of the ACAP should have been notified and should enter school this fall with a plan for remediation in place.
The percentage of students scoring below grade level in reading varied widely across the state. In general, systems with the highest levels of economically disadvantaged children also had the highest percentage of students not reading at grade level. The interactive chart below presents Alabama school systems arrayed on a scatter plot.
The vertical axis represents reading performance, with the best performers high on the chart (a high percentage of students reading at or above grade level and a low percentage of students below grade level).
The systems are arrayed on the horizontal axis moving from left to right, from the highest level of economic disadvantage to the lowest, from left to right. The size of a school system’s circle reflects the number of third graders scoring below grade in reading. The circle’s color corresponds with the level of economic disadvantage in the student body, from dark red representing high levels of poverty to dark green indicating low levels of poverty. In general, systems with rates of higher economic disadvantage had lower performance: a higher percentage of students failing to read at grade level. Systems with a lower rate of economic disadvantage had fewer students failing to meet the threshold.
However, particularly at the school level, it is clear that economic disadvantage is by no means an insurmountable obstacle. The correlation between poverty and performance is not as strong as in other educational data, like the ACT. In these third-grade reading results, schools with the same level of economic disadvantage show very different levels of success. Many high-poverty schools far outscored expectations.
In 2022, in more than 50 schools across the state, 50% or more of students ended third grade without the reading skills needed to succeed. Even at schools with a low percentage of students reading below grade level, the needs of the children with reading struggles must be met with “an appropriate reading intervention program to address his or her specific deficiencies,” as the law requires.
The Alabama act is patterned after similar laws in Florida and Mississippi, both of which saw significant performance gains after instituting their literacy laws. Alabama, which had enjoyed previous success in reading instruction in the 2000s through the Alabama Reading Initiative, has reinvested in reading coaches and professional development based on the science of reading for teachers and principals.
The following charts allow you to make comparisons of systems or schools, using the menus at the top of the chart to select the systems you want to focus on. First, a listing of systems:
Then, the percentage of third graders reading below grade level by school. The bars are shaded to reflect the percentage of students from economically disadvantaged households.
Even though the retention requirement of the Literacy Act has been delayed, the law is in force. But even if there were no law regarding third-grade reading levels, early grades reading should be a top priority.
Parents, teachers, and school and community leaders must respond to the identified need.
The results are better than might be expected, considering the circumstances of the past three years. However, sustained effort will be required across multiple fronts to make competitive progress on educational attainment and labor force participation.
The Alabama Workforce Council and Gov. Kay Ivey launched the Success Plus initiative in 2018 amidst a national push to raise education and skill levels. Increasingly, a credential or degree beyond high school is considered essential to thrive in the modern economy. Higher levels of educational attainment for individuals and for the state are linked to higher pay, lower unemployment, and better health outcomes. Alabama trails other states in educational attainment and associated measures like labor force participation.
Between 2018-2021, Alabama produced 214,725 newly credentialed individuals between the ages of 16-64, according to estimates developed by the Center for Regional Economic Competitiveness, the Washington, D.C.-based nonprofit hired to analyze the state’s performance.
That includes associate’s and bachelor’s degrees earned at colleges, industry-recognized credentials in high schools, occupational licenses, and completed certification programs and apprenticeships in the adult population as well.
Refining the Goal
Like any thoughtful goal-setting exercise, Success Plus has refined its measures and goals. The original focus on the adult population (ages 25-64) has been broadened to include credential earners 16-24, recognizing that age group as the supply line for the future workforce and those most active in credential-earning.
Leaders of the initiative are also opting to focus on the numerical goal of 500,000 individuals rather than achieving a 60% rate of postsecondary credential attainment. A rate is more abstract and harder to measure. Beyond that, reaching the national average rate for educational attainment and labor force participation are important long-term goals but aren’t realistically attainable by 2025.
Refining the Count
To generate the counts and estimates, CREC worked across several information sources. Those estimates have limitations since they are based at least in part on aggregated data:
The data include reports from private for-profit and nonprofit schools and training agencies, some of which operate online distance education. Thus, some of the credentials reported by institutions with an Alabama presence may be earned by someone who lives elsewhere and won’t become part of the Alabama workforce.
The estimates can’t control for the quality of the credential earned.
Out-of-state students at Alabama public colleges earned about 40,000 of the 180,000 certificates and degrees included in the tally. Currently, only a small percentage of those students stay in Alabama.
Fortunately, a more precise count will eventually be available. The Success Plus initiative has spurred Alabama to build a privacy-protected system for tracking education, degree and credential attainment, and entry into the workforce, something most other states have already done.
That system is still developing, but its construction has already encouraged better data collection, standardization, and sharing across state agencies. That’s long been a need to generate timely insights on labor force and education supply and demand.
Success Plus is also building tools to sharpen the focus on quality credentials by building more direct routes through education to employment. The initiative brings together employers, educators, and outside experts to identify jobs that are in demand and the education and training needed to compete for those jobs successfully. As those pathways from education to employment become more clear, students should be able to plot a more efficient course to the career they want. And employers will be able to more efficiently identify individuals with the qualifications needed for positions.
Success Plus has identified those out-of-state students as an opportunity as well. A 2020 study by the Alabama Commission on Higher Education found that only 14% of bachelor’s degree earners who came from out-of-state were employed in Alabama five years after graduating. Alabama natives graduate and leave the state as well. The same study found that 62% of in-state bachelor’s earners remained in the state five years after graduation. Success Plus has energized efforts to retain those graduates as residents and workers.
Building momentum
Halfway to 2025, the number of career technical education credentials earned in high schools has risen, as has high school/college dual enrollment.
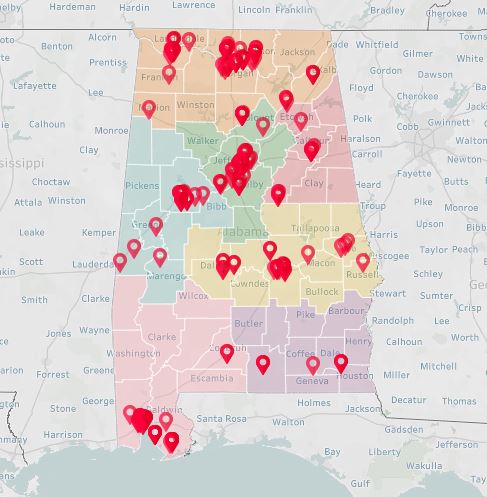
Another notable development spurred on by the Success Plus Initiative was the founding of the Alabama Office of Apprenticeship (AOA). In an apprenticeship, a new employee is paid while training and working for an employer or a profession. Apprenticeships often involve cooperation between an employer, a training provider, and the state, which encourages and helps subsidize paid training programs. Established in Sept. 2019, the AOA currently works with 427 employers, supporting 2,797 apprentices across the state.
Interactive Map of Apprenticeship Programs in Alabama
Needs Attention
The college-going rate for high school graduates has declined for several years and dropped sharply during the pandemic. Part of the reason for the long-term drop is the rise in the high school graduation rate, which had hovered in the 70s but now tops 90%. The numbers suggest that additional students are graduating from high school but lack the academic qualifications for college. It becomes all the more critical for those students to leave high school with a career-related credential or a pathway into training or employment.
Another factor in the drop was the pandemic, which hit two-year colleges particularly hard. Current enrollment suggests a rebound at those schools. The students who delayed starting college during the pandemic represent a target pool of prospects for recruitment to training or education programs.
For those that didn’t finish high school or have left the workforce, there are education and training programs available, but they are underutilized. Nick Moore, who heads the Governor’s Office of Education and Workforce Training, pointed out that Alabama received almost $50 million in Workforce Innovation and Opportunity Act (WIOA) funding in 2020 but only reached 8,000 participants. Less than half of those participants earned a credential through the program, and even fewer ended up in employment related to the training.
If Alabama is going to reach its attainment goals, agency partners will need to recruit more individuals into training that leads to in-demand jobs. Government agencies and nonprofit partners will need to collaborate around participating individuals. Partners can increase success rates by identifying and removing barriers that prevent participants from successfully rejoining the workforce.
Conclusion
Assuming sustained and sincere commitment, Success Plus could mark a turning point for Alabama by:
Bringing together a powerful array of interests and actors around a central goal, one that can only be achieved through action on multiple fronts.
Committing the state to systematically gathering, reporting on, and acting on data to determine what’s working and where there are problems in the education and workforce pipeline.
Prioritizing those who historically have been left behind: special populations that face barriers to educational attainment and participation in the workforce.
PARCA, in partnership with the Business Education Alliance and A+ Education Partnership, has tracked the progress of Success Plus since the initial goal was announced. The most recent report in the series, Forging Alabama’s Future, describes Success Plus and related initiatives and goals set by various partners.
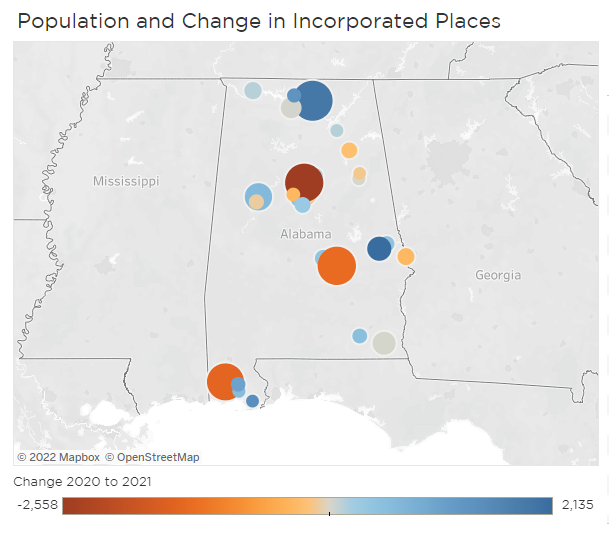
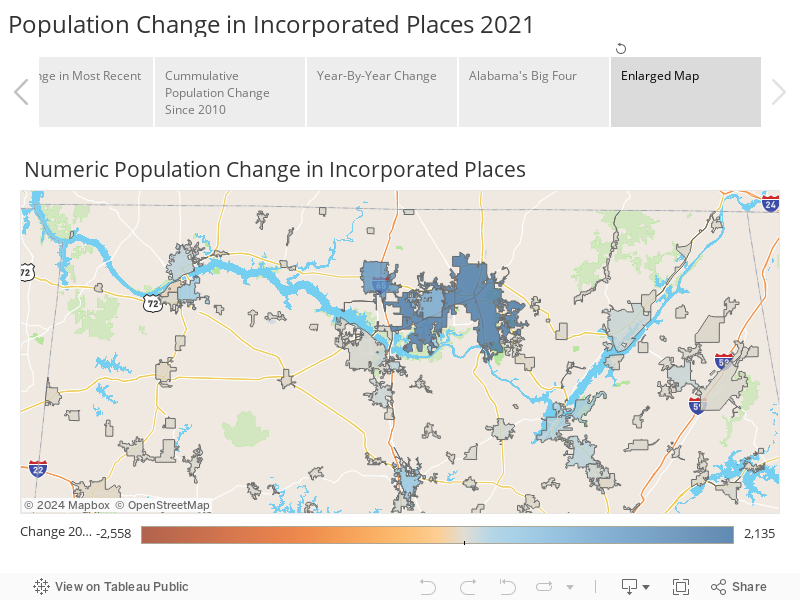
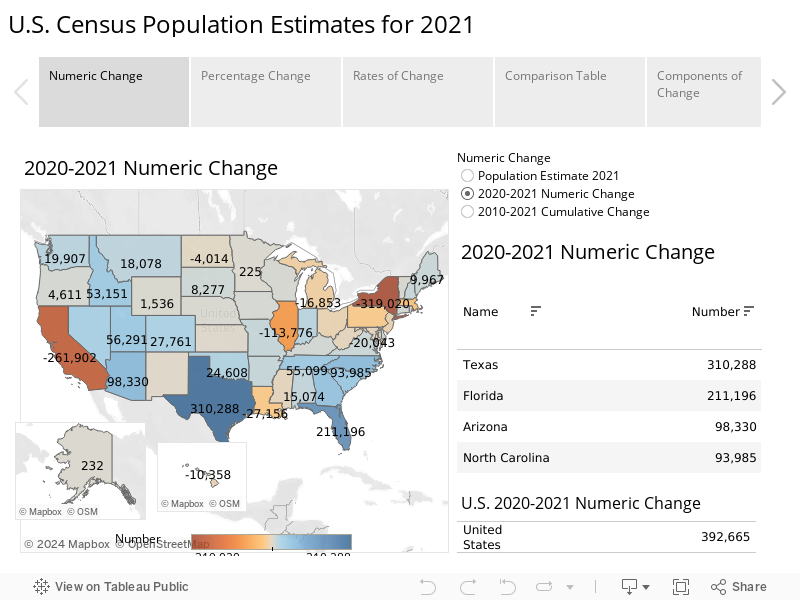
2021 Population Change in Alabama Cities
Each year, PARCA analyzes population estimates issued by the U.S. Census Bureau. Visualizations of the population estimates and change for the state, counties, and metro areas can be found on our data dashboard. The estimates release covers cities and towns and their population changes between July 1, 2020, and July 1, 2021. For additional perspective, see coverage of the estimates by al.com.
During this period, international migration was effectively shut off. The influx of new residents from overseas had been a primary driver of population gain in the larger established cities. Meanwhile, this period also saw elevated mortality rates due to the pandemic. Also, due to the pandemic, cities across the nation saw an outflow of residents as businesses stayed shuttered and workers were asked to work from home.
Birmingham’s population dropped by 2,558, more than any other Alabama city. It was followed by Mobile, which was down 1,459, and Montgomery down 1,341. With an estimated population of 197,575 in 2021, Birmingham is now the state’s third-largest city, behind Montgomery at 198,665, and No. 1 Huntsville, at 216,963.
Huntsville bucked the trend of large city population loss, adding 1,920 residents according to the estimates. Only Auburn added more, 2,135, which was more population gain than any other Alabama city. Since 2010, Auburn’s population has increased 43%, the fastest rate of growth among cities over 20,000. Neighboring Opelika has also grown, adding an estimated 465 in 2021.
Both Auburn and Huntsville have been spreading out through annexation, adding undeveloped land where housing is now being built. At 218 square miles, Huntsville is now far larger than Birmingham at 147 square miles.
Add up the growth totals in Baldwin County, and you’ll see why the coastal county is No. 1 in numeric growth among Alabama counties. The estimates show Foley adding nearly 1,500 residents, Daphne more than 1,000, and Fairhope and Gulf Shores over 500 apiece.
The Birmingham-Hoover metropolitan area is still far larger than the next largest metro, Huntsville, with around 500,000 residents compared to Birmingham-Hoover’s 1.1 million. Over the past two decades, population growth around Birmingham has occurred chiefly in its suburbs.
However, according to the 2021 estimates, some traditional growth engines were idling. Trussville only added 172 new residents, and Hoover saw a net decrease of 98 residents. Homewood, Mountain Brook, and Vestavia Hills saw population declines. A bright spot for Jefferson County was Gardendale which posted a gain of 407. The growth in the Birmingham MSA occurred farther out in Shelby and St. Clair County. Calera added 742 residents; Chelsea, 478; and Helena, 465. Pell City, Moody, and Margaret town in St. Clair County also added residents. Nearby, Tuscaloosa added 658 residents and broke over the 100,000 population mark, coming in at 100,618.
Across a region, the biggest population gains were in north Alabama. In addition to Huntsville’s growth, Athens, in Limestone County, added over 1,300, and the City of Madison almost 1,000. Nearby, The Shoals added 424 residents, with growth in both Florence and Muscle Shoals continuing a positive trend. Across the entire northern tier of the state, almost all the cities and towns showed growth.
Southeast Alabama around Dothan saw modest growth, with Enterprise leading the way by adding over 500 new residents.
Anniston and Gadsden, however, continued a flat to declining population trend.
More broadly, most cities and towns in rural Alabama, from Northwest Alabama, through the Black Belt, and East Central Alabama, lost population.
State Parks Constitutional Amendment on May Primary Ballot
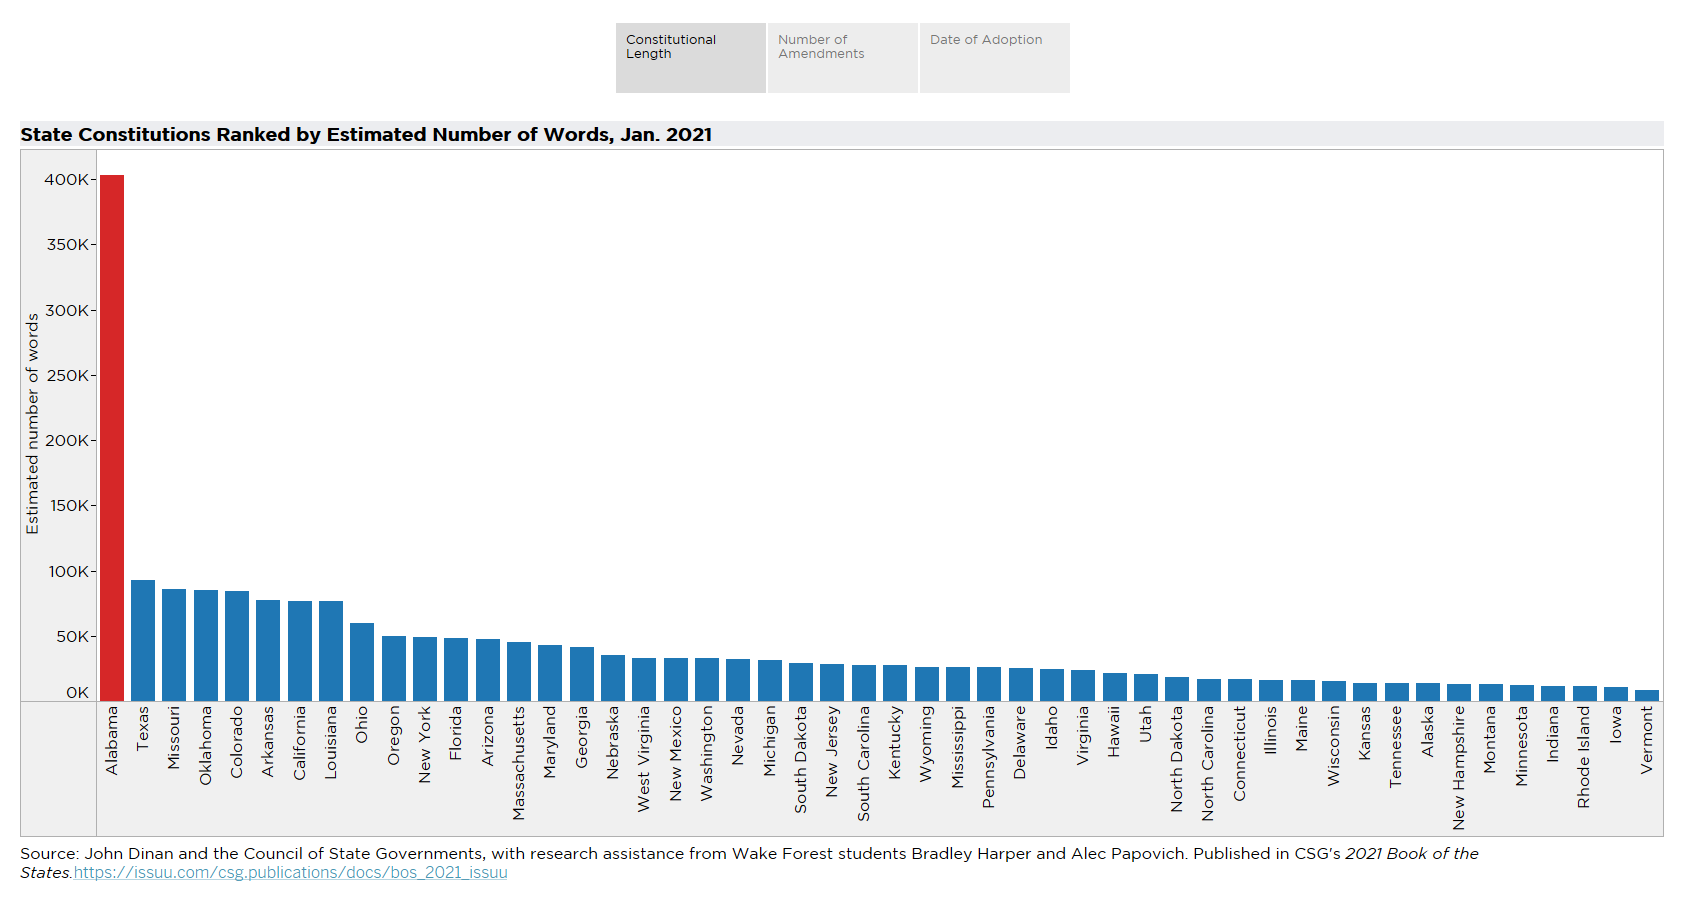
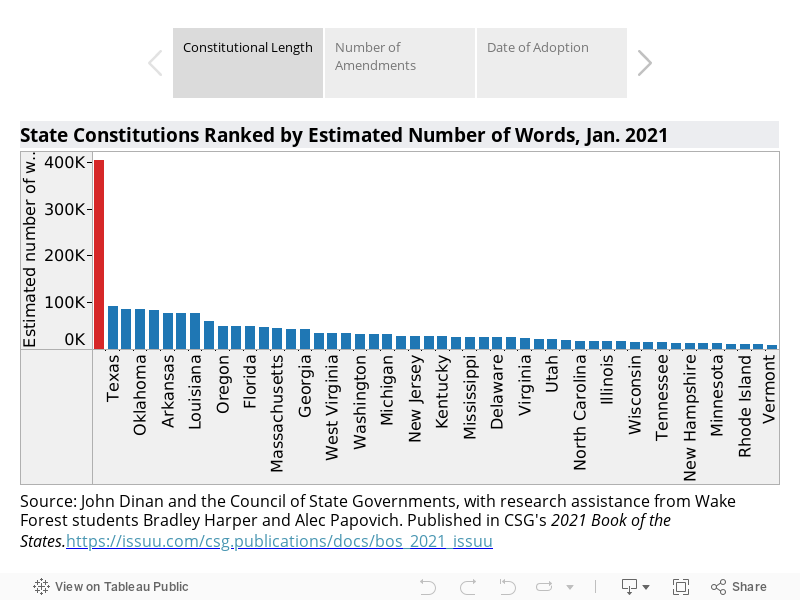
When voters go to the polls on May 24, they will be asked to vote on a single amendment to the Alabama Constitution of 1901, a proposal to borrow $85 million to pay for repairs and upgrades at Alabama’s 21 state parks.
Alabama has what is believed to be the world’s longest constitution at over 400,000 words, with 977 amendments. Oddly, 70% of the state constitution consists of amendments that apply to individual counties or cities. Alabama’s 1901 Constitution severely constrained government and consolidated power in Montgomery. The multitude of amendments is a long-lingering aftereffect of that approach to governing.
Having just one amendment to vote on is unusual. In November’s general election, 29 amendments will be considered, including amendments that would strike unconstitutional provisions and substantially reorganize the document.
Graduation and College and Career Readiness Rates Steady, Gap Persists
With graduation season now upon us, new data allows us to look back at statistics for last May’s public high school graduates, Alabama’s Class of 2021.
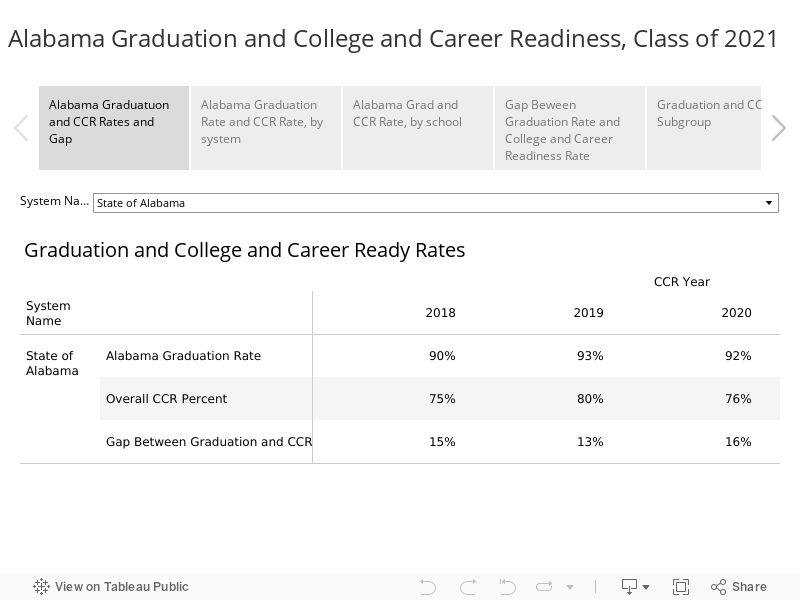
In 2021, 92% of seniors graduated on-time four years after starting in 9th grade, maintaining the high rates Alabama public schools have posted in recent years. However, only 76% of seniors were certified as college and career-ready (CCR), a gap that state leaders are calling on schools to close.
Percentage Change in the College and Career Readiness Measures
The results of 2021 should be considered in the context of the Covid-19 Pandemic. This graduating class saw in-person instruction end in March of their junior year. For their senior year, the 2020-2021 school year, the amount of time students spent in-person at school varied by district. While the graduation rate remains close to its historical high point, the college and career readiness rate remains below the level it reached in 2019. That’s not necessarily a bad thing. Measures of college and career readiness must be honest and meaningful measures. There are seven ways a student can demonstrate college and career readiness.
1. Earn Credit Through a College: a higher percentage of students earned college credit while in high school in 2021: 17%. That’s the highest percentage ever, up from 15% in 2020. These courses, also known as dual enrollment, tend to be taken through a local community college but can also be through a university. The student must successfully complete the course and earn credit to qualify as CCR.
2. Earn a Qualifying Score through Advanced Placement: AP courses are taught in a high school but have the rigor and approach of college courses. In 2021, 12% of students qualified as CCR through AP, which is tied for the highest percentage ever. To count as CCR, a student has to score three or higher (out of 5) on the national end-of-course test, a level at which a college might award college credit.
3. Earn an Industry Recognized Credential through Career Technical Education: 36% of students earned an industry-recognized credential through career technical education in 2021. These credentials result from taking work-oriented courses offered at high schools or K-12 career tech centers. At 36%, the Class of 2021 was only slightly behind the 37% of students recorded for the Class of 2019. After a rapid jump in CCR attainment in recent years, there has been an increased focus on the quality of the industry credentials that count toward career readiness. The credential has to be tied to a student’s course of study. Also, the credential should be valued in a career field that is in demand in the regional job market. This screening for the quality of the credential may hold down growth in numbers in the short term, but it should improve value for the student and the economy.
4. Earn a benchmark score in a subject test on the ACT: The percentage of students scoring at or above the college-ready benchmark on the ACT was down by 5% in 2021, to 45%. A student scoring above the benchmark has a 50% chance of earning a B or above and a 75% chance of making a C or above in that course in college. Covid disruptions may have had some bearing on students’ ability to prepare for and take the ACT, which tests readiness for success in college.
5. Earn a qualifying score on WorkKeys: Over the past two years, there has been a significant drop in the number and percentage of students earning CCR through ACT’s WorkKeys test, a standardized test designed to measure whether students have the math and communication skills expected in workplaces. WorkKeys is no longer required, and, in many systems, students who have already demonstrated college and career readiness by another means opt-out. (More on WorkKeys results below)
A lower percentage of students gained admission to the military or earned college credit through an International Baccalaureate course, options six and seven, in 2021 than in previous years.
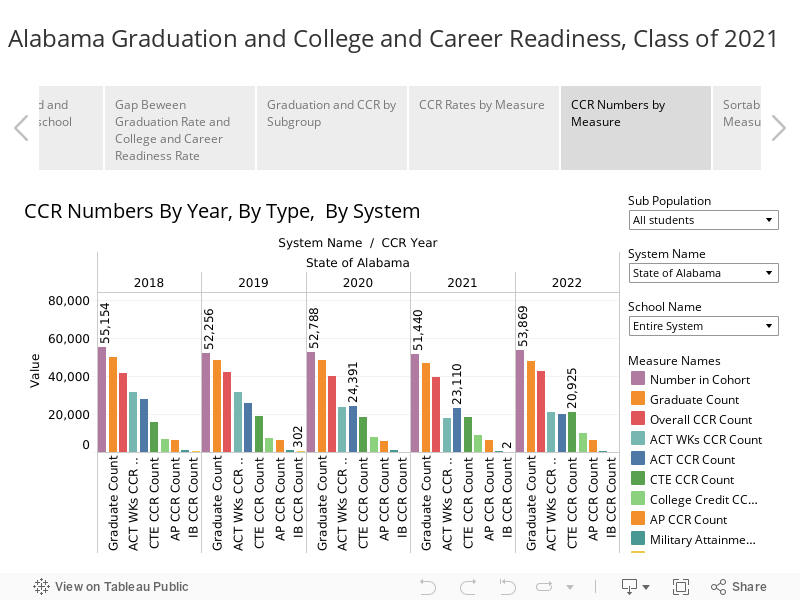
Numerical Change
While the graduation and CCR rates are stable, fewer students are progressing through Alabama public schools. The rising generation, Generation Z, is smaller than the previous generation, The Millenials. Consequently, the number of college and career-ready high school graduates is declining. Despite little or no change in the graduation or CCR rate, 1,336 fewer students graduated from Alabama public schools and 646 fewer students graduated ready for college and career. In light of the ongoing elevated demand for skilled workers, Alabama must focus on graduating every student with the skills needed to succeed in higher education and/or the workplace.
School and System Results
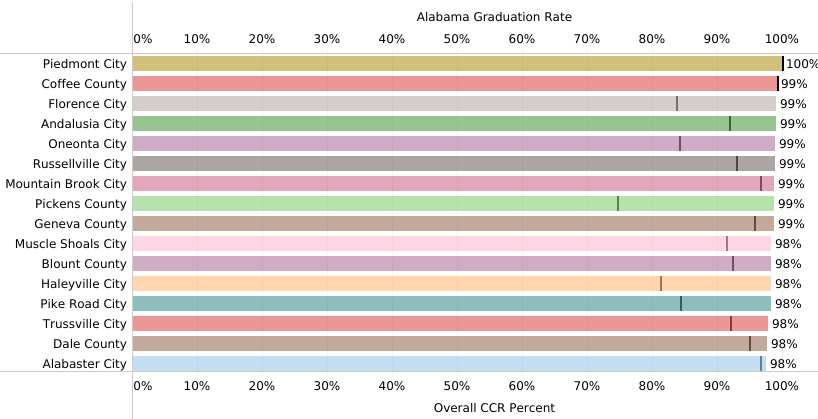
One system, Piedmont, and two dozen high schools reported a 100% on-time graduation rate for the Class of 2021. Eight high schools reported both 100% graduation and 100% CCR rate. In some schools, a higher percentage of seniors demonstrated college and career readiness than graduated.
On the other hand, nine schools had graduation rates below 75%. Thirty high schools had CCR rates below 50%. Twenty-six school systems had a gap greater than 25% between their graduation rate and the college and career readiness rate. In those systems, more than a quarter of students receiving diplomas hadn’t demonstrated their readiness for college or work, despite having met Alabama’s requirements for obtaining a high school diploma.
In the visualizations below, school systems and schools can be sorted by either graduation rate or college and career readiness rate. The solid colored horizontal bar represents the graduation rate; the short vertical bar represents the CCR rate. Through the tabs above the visualization, other data is accessible, including a graph of the gap between the graduation and CCR rate by system.
The same set of sortable data is available by school. In order to protect student privacy, results for small subpopulations of students are not presented.
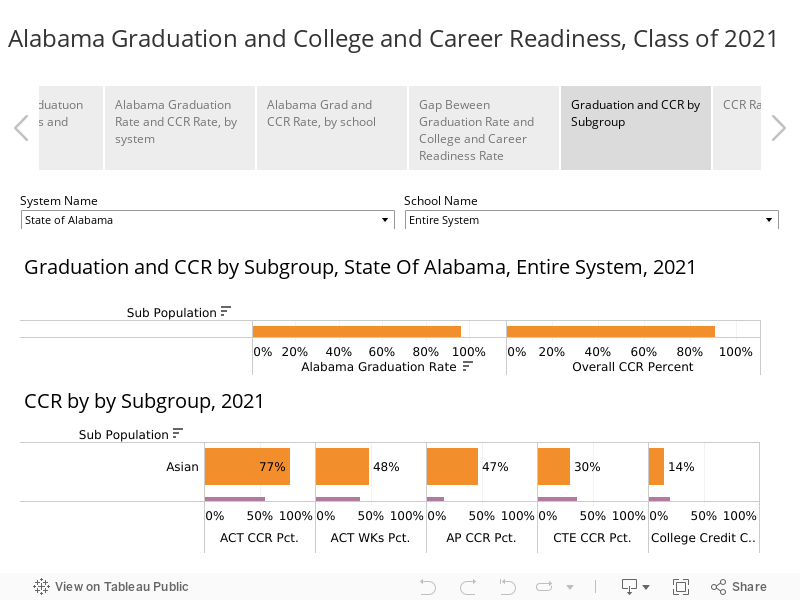
Gaps Between Subgroups
Historically, there have been gaps in the high school graduation rate between students of different races. In recent years, those gaps have been largely eliminated. However, the gaps persist in college and career readiness rates. Black and Hispanic CCR rates trail those of whites and Asians. CCR rates for economically disadvantaged students are well-behind those of non-economically disadvantaged students. Examining the subcomponents of CCR, the gap is widest on the ACT, with only 24% of Blacks and 30% of Hispanics benchmarking in a subject on the ACT, compared to 55% of whites. Asians are much further ahead, with 77% of Asian students earning a benchmark score. By contrast, there is almost no racial gap in college and career readiness rates in career technical education: 35% of Black students earned an industry-recognized credential through CTE compared to 36% of whites and 38% of Hispanics.
WorkKeys
While still valued by many school systems, students, and employers, ACT’s WorkKeys test is no longer a universal comparative tool. After 2018, the Alabama Department of Education stopped requiring the test to be given to all students. That has led to significant drops in the number and percentage of students taking WorkKeys. In 2018, over 50,000 students took the test; in 2021, fewer than 35,000.
WorkKeys tests math, reading, and graphical literacy skills as they are employed in the workplace, in contrast to ACT, which tests for knowledge and skills needed in a college classroom. Businesses who build WorkKeys into their hiring practices know what a WorkKeys score means. They have determined what level of proficiency, as measured by WorkKeys, is needed in particular jobs. Students earn either a platinum, gold, silver, or bronze National Career Readiness Certificate, depending on their test performance. A student scoring Silver or above is considered college and career ready. In a normal job market, employers, particularly industrial employers, use WorkKeys in the applicant screening process.
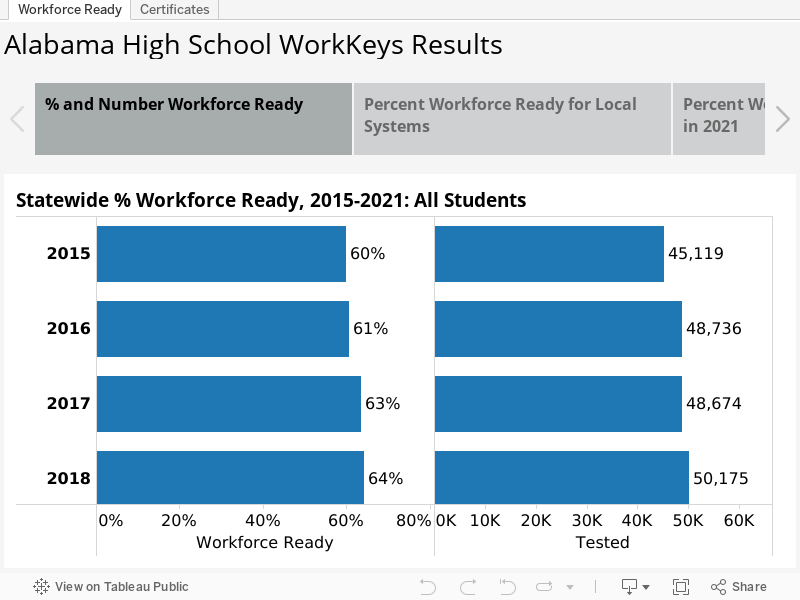
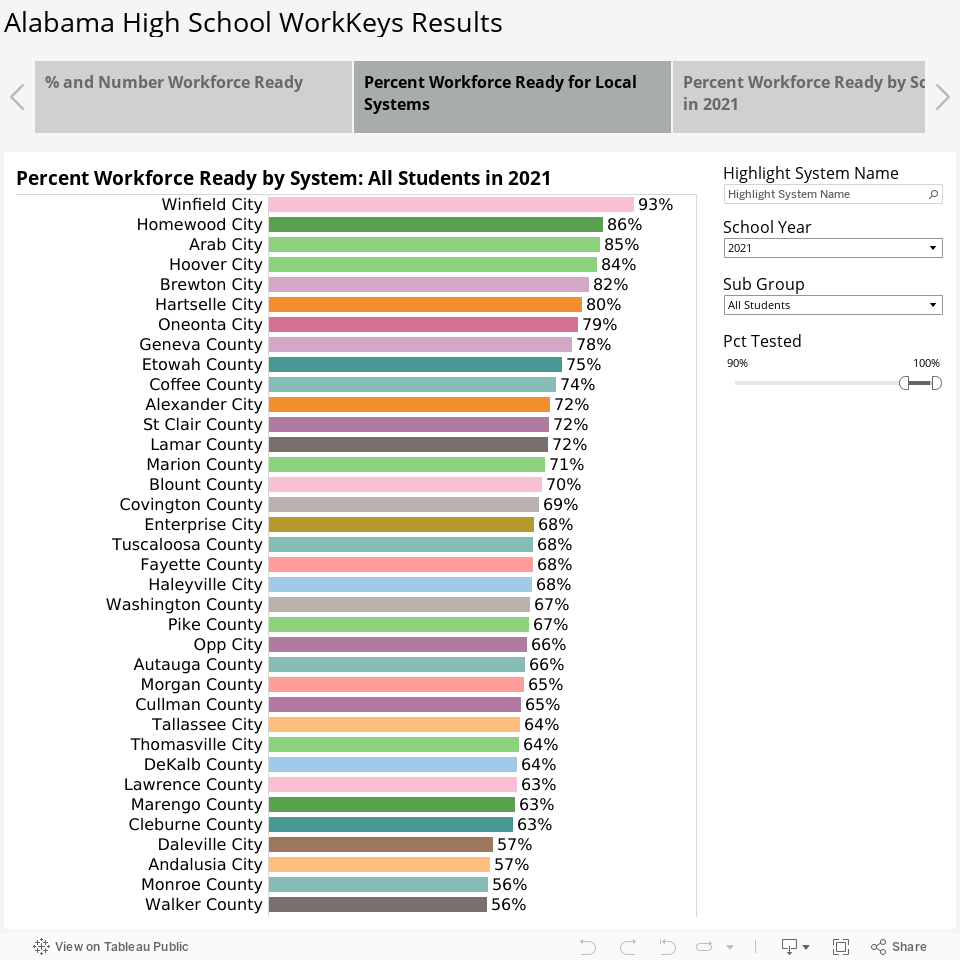
In 2021, 59% of Alabama high school students who took WorkKeys scored Silver or above, indicating they had the foundational math and communication skills needed in most workplaces. That’s down from 66% when all students were required to take the test. Many school systems now make WorkKeys available to students who haven’t qualified as CCR on another measure.
The visualizations that follow present WorkKeys results statewide and in systems where more than 90% of seniors took the test. The percentage of students scoring Workforce ready are those that score Silver or above.
The visualization below presents the results in a more detailed fashion. Each color represents the percentage of tested students scoring at each level: platinum, gold, silver, bronze, and no certificate earned.
PARCA Report Highlights Challenges of Municipal Financial Comparison, Examines City Tax Collections
Our 2022 edition of How Alabama Cities Compare (the tenth edition of PARCA’s study of Alabama city finances) introduces a new methodology, highlights the challenges of comparing municipal finances, and proposes a better way to collect the information in a standardized way that should produce comparable data more quickly. After building consensus and adjusting existing practices, such a system would save cities time and provide the data they need to manage their affairs.
Understanding a city’s revenues and expenditures in comparison to other cities is a fundamental tool for effective management.
By benchmarking against neighbors, a city may discover it is spending more than necessary. Alternatively, city leaders may conclude that a higher level of investment puts the city at a competitive advantage, providing a higher level of service and better quality of life for residents.
Unfortunately, making such comparisons is difficult in Alabama. Unlike other states, cities in Alabama are neither required nor encouraged to use a uniform chart of accounts, a standard system for coding revenues and expenditures.
Nor does Alabama have an effective system for publishing and sharing the kind of comparable data that could be produced with a uniform chart of accounts.
For instance, North Carolina, Georgia, and Florida have a statewide reporting system that makes city and county financial information available online in a downloadable format that allows for detailed comparisons between peer cities or counties.
If Alabama wants to gather this data and equip its cities with a tool for comparison, the U.S. Census Bureau’s Annual Survey of State and Local Finances provides an existing base of information already submitted by city governments.
In terms of tax collections, an analysis of the most recent data from the Census survey finds:
Alabama cities heavily depend on sales tax, with almost 60% of revenue coming from that source.
Of cities with populations more than 20,000, per capita tax collections range from $2,674 in Homewood to $402 in Prichard.
Oxford has the highest per capita sales tax revenue at $1,502 per resident.
Mountain Brook is the only city in Alabama to collect more in property taxes than in sales, with 46% of municipally collected revenue coming from the property tax.
Birmingham leads the cities in occupational and business licenses taxes per capita, with that revenue contributing 42% of city tax revenue.
Meanwhile, on the expenditure side, the survey reveals:
The governments in North Alabama spend more than governments in the rest of the state because they operate public utilities, including municipal electricity providers.
Excluding utilities, Birmingham and Bessemer, both cities that receive an influx of commuters, spend more per capita on the broad range of municipal services. That includes topping the list for per capita spending on police and fire.
Oxford tops the list in per capita spending on parks and recreation. Smaller cities that report the operation of municipal sports, arts, and recreation facilities rank high in this category.
The data offers the potential to track spending on municipal courts, jails, solid waste disposal, and other categories of spending, but currently, cities appear to diverge widely in how they report that information in the survey.
Working with state officials and with assistance from the U.S. Census Bureau, Alabama local governments could develop a more streamlined system for generating and reporting this data. With closer agreement on how to categorize particular revenues and expenditures, the survey could provide clearer, more actionable comparable data. The survey includes questions on debt. Better reporting of this data can provide more transparency to the public. A more robust system could also provide better accountability and oversight, potentially avoiding bankruptcy and scandal.
However, it will take leadership, likely by state officials, to gather consensus and execute a system cities, counties, and other local entities are motivated to participate in.
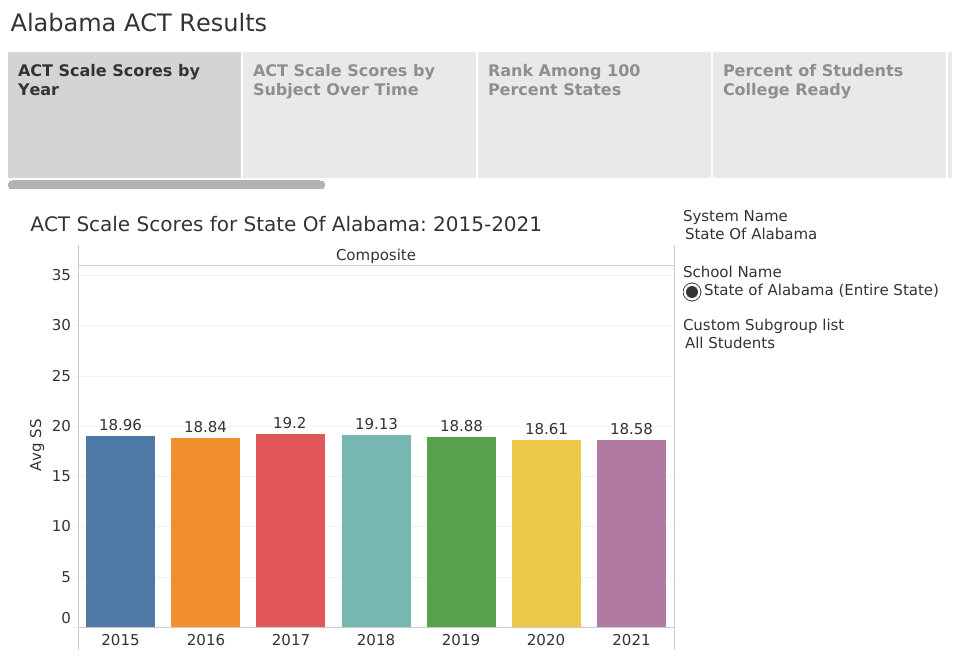
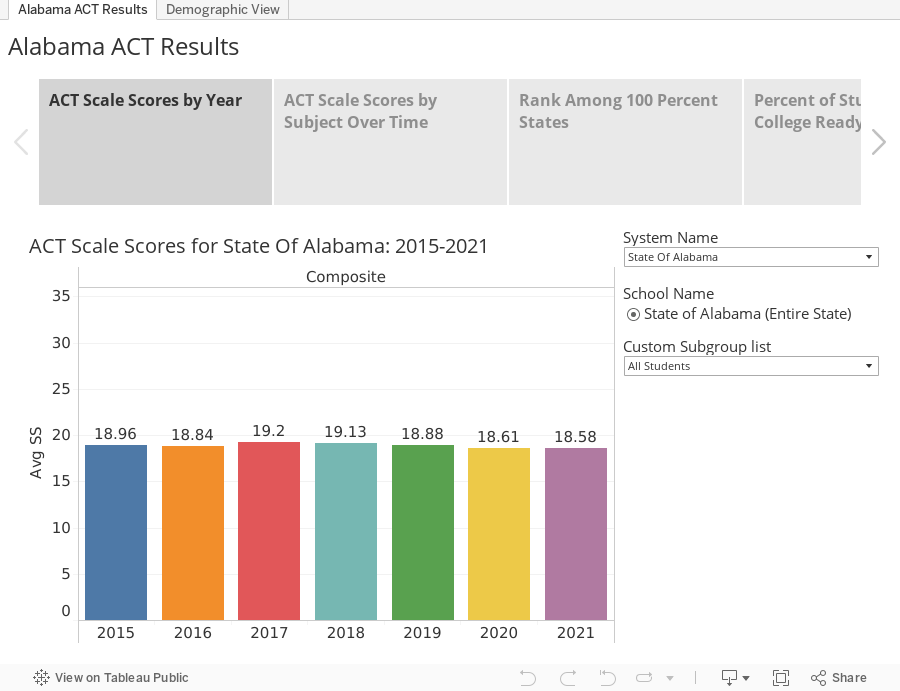
ACT Scores Down Only a Fraction For the Class of 2021, Despite Pandemic
The average ACT score for students graduating from Alabama’s public high schools in 2021 was down only slightly, while the national average score fell more steeply, a fact that could be considered a victory in the light of the challenges faced by students and educators during the pandemic. Still, Alabama’s 2021 ACT results continue a downward drift from their peak in 2017.
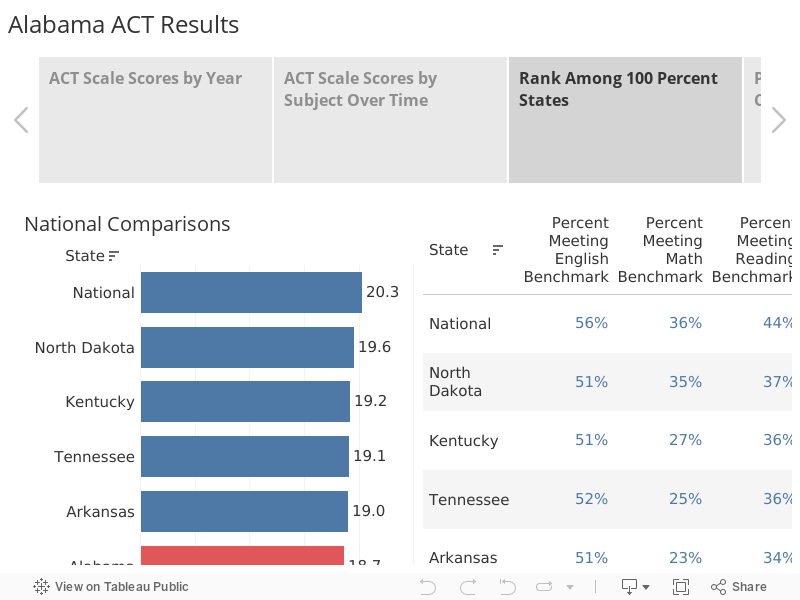
Alabama’s average score, 18.6 on a 36-point scale, shouldn’t be directly compared to the national average score. Alabama tests virtually all its public high school students, while only 35% of students take the ACT nationally. In states where the test is not universally given, only students planning to go to college take the test, which tends to push up the score. The national average score fell from 20.6 in 2020 to 20.3 in 2021. Among states that tested 100% of students, Alabama maintained its relative performance rank, behind Kentucky, Tennessee, and Arkansas but ahead of Mississippi and Louisiana.
Downward pressure on scores was expected. The pandemic led to the cancellation of several administrations of the ACT. Schools across the country operated virtually during the spring of 2020 when the students in the class of 2021 were juniors. Altered forms of schooling persisted into the fall of 2020. In normal circumstances, some students take the test more than once, attempting to boost their scores. That happened less with the Class of 2021. According to ACT, only 32% of students took the ACT more than once compared to 41% of the 2020 cohort. That drop was likely because most universities suspended the requirement of taking the ACT due to the disruptions.
In addition to the fractional drop in the average scale score for Alabama students, the percentage of students scoring college-ready in all subjects declined. In 2021, only 15% of students scored at or above the college-ready benchmark in all four tested subjects, compared to 16.3% in 2020 and 18% in 2017. According to ACT, students who meet a benchmark on the ACT have approximately a 50% chance of earning a B or better and approximately a 75% chance of making a C or better in a corresponding college course. ACT is primarily geared toward measuring readiness at four-year colleges and universities.
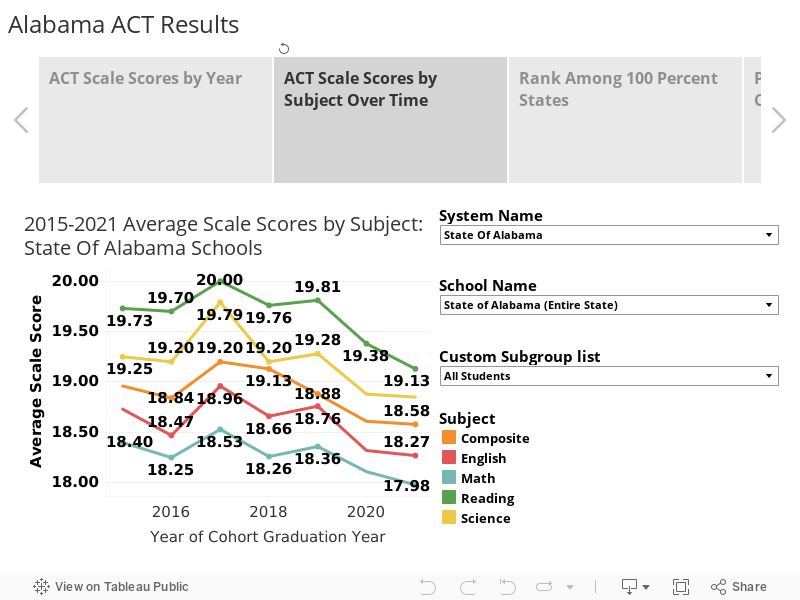
On each of the four subjects that ACT tests — English, math, reading, and science — student scores ticked down a fraction.
Some points of interest arise when delving more deeply into the numbers. Scores for white students declined in every subject while Black students held steady in reading and science. Hispanic students posted an improvement in English and science. Scores rose for both economically distressed and non-economically distressed students, an unexpected result considering that scores overall were down slightly. That may be explained by more students being classified as economically distressed due to the lingering economic consequences of the pandemic. Some students who had typically been in the non-economically distressed category likely shifted into the economically distressed pool, which can push up the scores of the economically distressed pool.
The stubborn score gaps between economic and demographic subpopulations persisted in 2021. Asians outperformed all other subgroups.
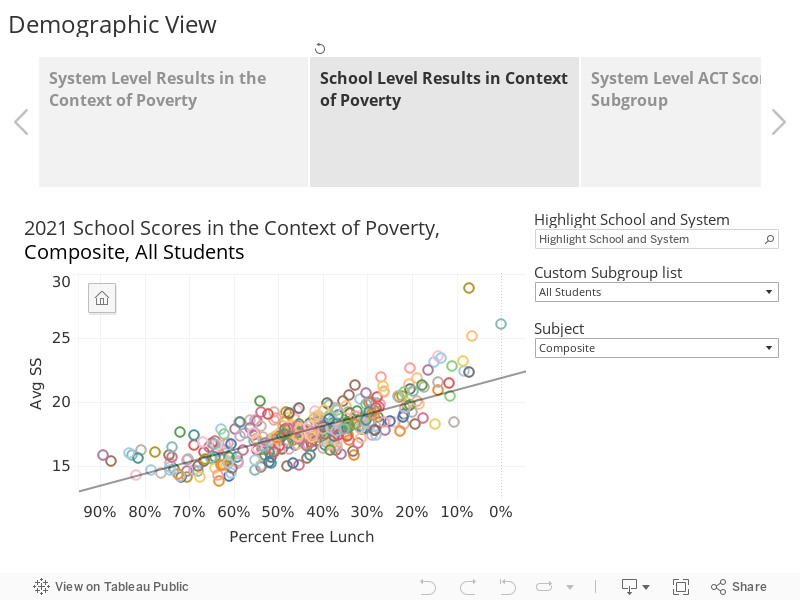
Due to the score gaps between students from different backgrounds, the demographic composition of the student body should be taken into account when evaluating a school or system’s performance. The scatterplot presents score performance in the context of the economic composition of the school system’s students.
Systems with a high percentage of non-poverty students are on the right of the scale, while schools with high poverty percentages are on the left. The higher the average scale score for the system, the higher the system appears on the graph. The line of prediction plots the expected performance level for a system considering the economic composition of the student body. Scores increase as the percentage of non-economically distressed students increase. Systems are grouped along that line of prediction, indicating a correlation between the average scale score in the system and the economic makeup.
Systems above the prediction line have outscored expectations based on economics.
A similar pattern can be seen in the array of individual high schools. However, there is more variation from the average. Taken together, the graphs tell us that the socioeconomic composition of a school influences the average score, but that systems and, to an even greater degree, individual schools do make a difference in student performance.
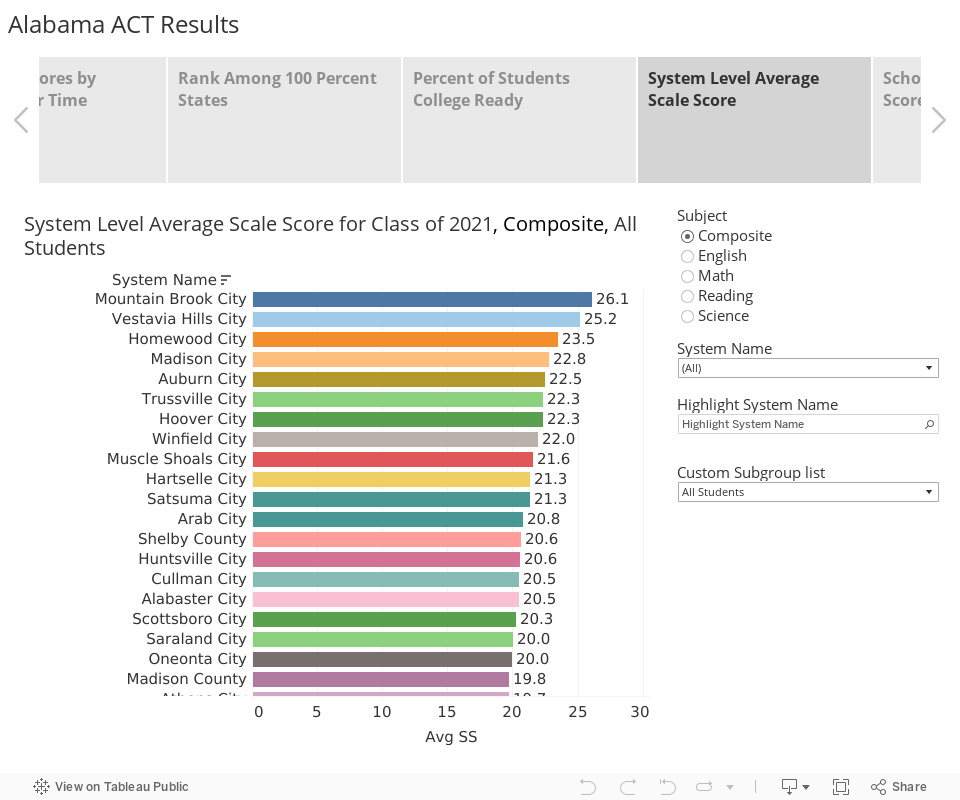
Bearing that in mind, PARCA’s visualizations of the 2021 ACT results allow the viewer to explore how their local schools and systems performed relative to others. Viewers can choose schools and systems that provide appropriate peer comparisons. In addition to comparisons by average scale score, additional views offer results by the percentage of students achieving the benchmarks in each subject. Lower poverty systems serving suburban communities tend to show the best results at the system level.
At the school level, the highest average performance is found not just among those suburban systems but also in magnet high schools in larger systems, like Montgomery County’s Loveless Academic Magnet Program (LAMP) and Huntsville’s New Century Technology High School.
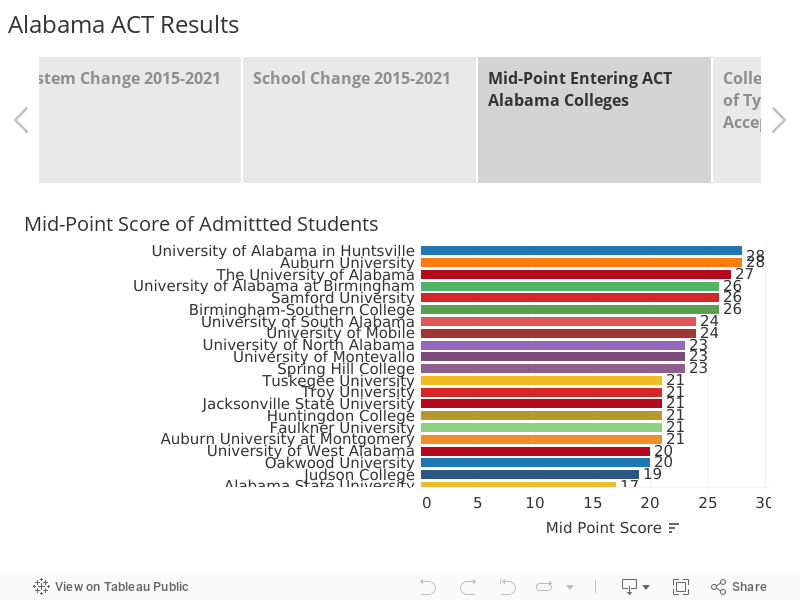
To put ACT scores in perspective, it is helpful to know the typical ACT scores for students entering college. Average scores range widely between colleges and within colleges. In Alabama, the mid-point ACT score for entering students ranges from 28 at the University of Alabama in Huntsville and Auburn University to 17 at Alabama A&M in Huntsville and Alabama State in Montgomery. As part of their mission, these historically-Black universities provide opportunity and access to students who may not have received the same level of college preparation. Many colleges have continued to waive the ACT requirement for admission and are instead relying on high school grades and other factors to assess student readiness. However, ACT scores can still play a role in admissions and in the competition for scholarships.
Deaths outnumber births, but population grows through domestic migration
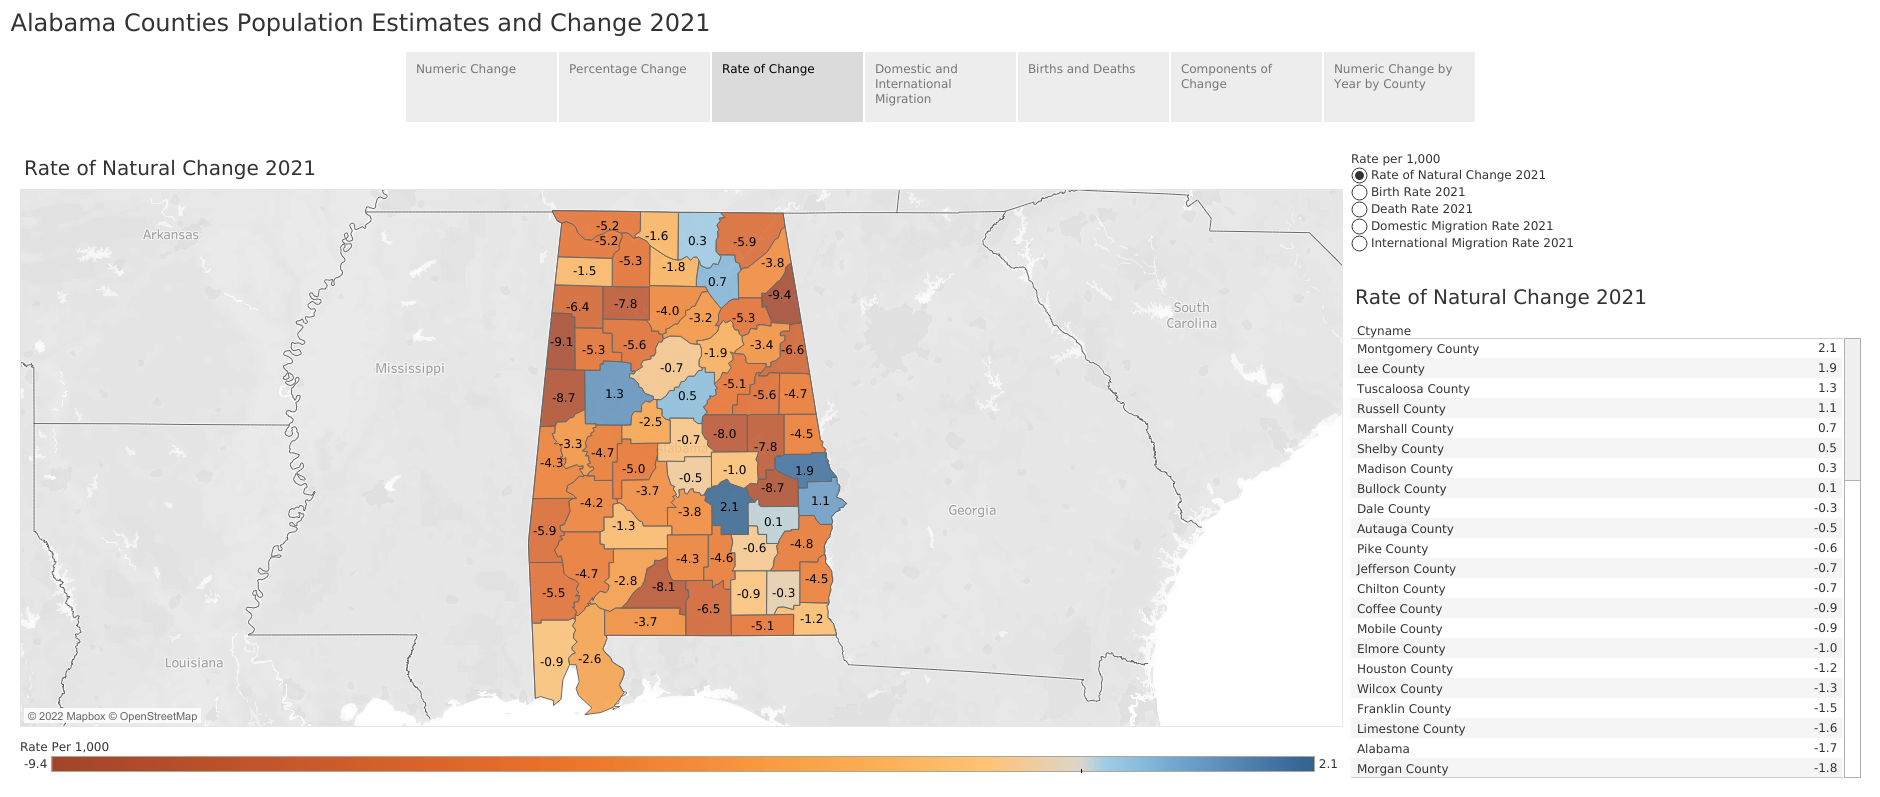
New estimates released by the U.S. Census Bureau show that more than half of Alabama counties lost population between July 1, 2020, and July 1, 2021, losses driven by an aging population, a declining birthrate, and an elevated death rate during the Covid-19 pandemic.
Statewide, the 65,868 deaths outnumbered 56,320 births, leading to a net loss through natural change of 8,548. In the visualization below, counties are shaded by their rate of natural change. Only eight counties, those in blue, saw more births than deaths. Alabama had the 4th highest death rate in the U.S., behind West Virginia, Mississippi, and Maine.
However, stronger growth through domestic migration (individuals moving from other states to Alabama, but excluding movers who are foreign-born) helped the state offset those losses. Estimates issued earlier this year put Alabama’s population at 5,039,877, up by about 15,000 or 0.3%, from 2020. A net total of 22,136 domestic migrants moved to Alabama, offsetting the loss from natural change.
Two counties accounted for about half that growth, with coastal Baldwin adding 6,780 net new residents through migration and Madison County adding 5,335. Madison County’s neighbor, Limestone, added 3,388. Other north Alabama counties like Cullman, Lauderdale, Jackson, Morgan, Marshall, and Dekalb also saw gains from domestic migration. The counties containing the three other large population centers — Jefferson, Mobile, and Montgomery — saw population declines, according to the estimates. Meanwhile, counties linked to those metro core counties — counties like Shelby and St. Clair, Elmore and Lee, and Baldwin — saw growth. Modest growth also occurred in some Wiregrass counties — Coffee, Houston, and Henry.
Zooming out to look at the Southeast, similar patterns are evident. Core counties in Atlanta, Charlotte, Nashville, and Memphis lost population while surrounding metro counties grew. Generally, growth was more widespread in Tennessee, Florida, the Carolinas, and the northern half of Georgia. Overall, Alabama counties bordering Georgia, Tennessee, and Florida are growing. Coastal counties on the Southeast’s East and Gulf coasts have seen growth. Counties along the interstates benefit throughout the region. Still, rural counties and whole swaths of the interior South, including counties in central and western Alabama, continue to lose population, not yet connected to the regional engines of growth.
When it comes to counties grouped into metropolitan statistical areas (MSAs), The Daphne-Fairhope-Foley, Huntsville, and Auburn-Opelika MSAs continue to show strong population growth. Among the 358 U.S. metros, they rank No. 16, 40, 50, respectively, in terms of percentage population change.
On the other hand, metro Birmingham is still not seeing the pace of growth of other Southeastern metros. Gains in Shelby, St. Clair, Bibb, and Blount counties weren’t enough to overcome Jefferson County’s estimated population loss of 5,521. Over the past decade, Jefferson County’s natural increase plus population gains from international immigration offset a steady stream of domestic outmigration. But in 2021, deaths outnumbered births by 438, and international migration accounted for a gain of only 153 people. Meanwhile, the estimates show a net loss of 5,238 domestic residents moving out of Jefferson. That produced a net population loss for the MSA in 2021. The Birmingham-Hoover metropolitan statistical area ranked 258 out of 358 U.S. metros in percentage change.
Montgomery ranked No. 248, with a slight population gain, and the Mobile MSA ranked No. 305, with a population loss of 1,326. After strong growth over the past decade, Tuscaloosa County and its metro area lost population in 2021, according to the estimate. Its growth rank ranked it No. 284 among U.S. metros.
The Auburn-Opelika MSA added 2,617 residents, according to the estimates, a growth rate of 1.5%. Dothan, Decatur, and the Florence-Muscle Shoals MSAs also showed positive growth. The Anniston and Gadsden MSAs continued to post slight declines.
Using the menus and tabs in the visualizations above, you can explore birth and death rates, numerical and percentage change of counties and MSAs in Alabama and across the U.S. The state population estimates and components of change released earlier this year are below.
And the final visualization looks back to the results of the 2020 Census and compares population counts from April 2020 and April 2010.