PARCA’s new report, titled E-Commerce and Taxation: Questions of Efficiency and Equal Treatment, questions whether changes are needed to the state’s Simplified Sellers Use Tax (SSUT).
Executive Summary
Alabama’s tax on online goods sold by out-of-state sellers, the Simplified Sellers Use Tax (SSUT), has been a boost to state budgets but a mixed blessing for local governments and schools. As online commerce continues to grow, the assessment and distribution of the tax is increasingly important and potentially problematic.
At the state level, the SSUT is the equivalent of the state sales tax, a 4% levy on online sales, the same rate that is applied to sales in Alabama stores. In terms of state taxes, the SSUT creates a level playing field between online vendors and brick-and-mortar stores. But at the local level, the tax creates winners and losers.
- Online retailers benefit from a simple system, paying a total of 8% on all purchases made by Alabamians. The proceeds are divided in half between the state and local governments.
- Brick-and-mortar stores are put at a competitive price disadvantage. The weighted average sales tax is 9.25%[1] across the state, and thus, most in-person sales are subject to higher taxes than online purchases.
- Communities with less commercial activity and lower wealth benefit from the distribution formula of the SSUT because the proceeds are distributed on the basis of population, not where the purchase occurs.
- Big cities and counties, which tend to have higher sales volume and local sales tax rates higher than 4%, receive less from online purchases made by their residents than if those same purchases were made in person.
- In 2021, 120 school systems received revenue from county sales tax (totaling $665 million), and 40 school systems received revenue from city sales taxes (totaling $176 million). Some systems receive both city and county sales taxes. In total, 131 school systems received sales taxes from a county, a city, or both.
Considering the divergent interests involved, no one policy solution satisfies all parties. Options include:
- Raise SSUT’s rate to match the prevailing local sales tax rate.
- Join the 24 other states participating in the streamlined sales tax, which would allow a unified system for applying and remitting sales taxes for online and in-person sales. The local tax rates could be applied, but only one entity would collect state and local taxes, eliminating local oversight.
- Build our own system for online retailers to look up and submit sales taxes based on where the purchase is made.
Since state and local coffers are full at the moment, immediate action on the SSUT is not expected. However, the issue will become more central with the continued shift toward online sales.
[1] Janelle Fritts, “State and Local Sales Tax Rates,” Tax Foundation (blog), accessed March 22, 2023, https://taxfoundation.org/publications/state-and-local-sales-tax-rates/.
Introduction
The SSUT is Alabama’s tax on goods sold by online, out-of-state sellers. Since its adoption in 2015, more and more consumers have chosen online shopping carts over their metal counterparts.
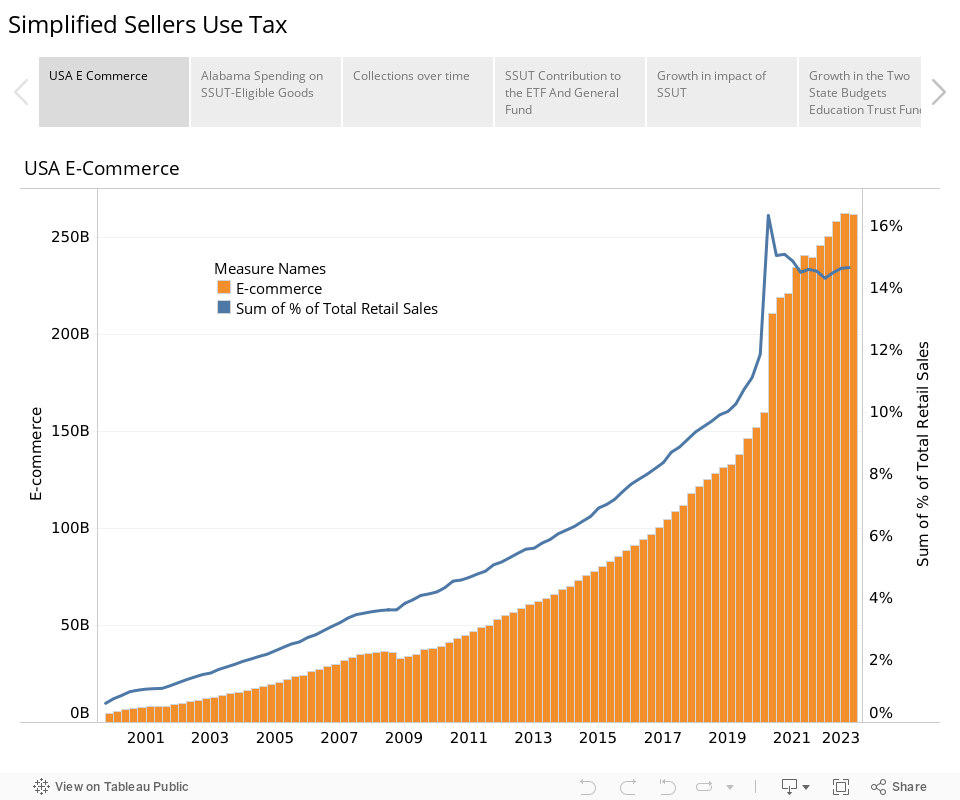
According to the US Census Bureau’s Retail E-Commerce Sales Report, online sales accounted for less than 1% of sales in the fourth quarter of 1999 compared to 15% of all retail sales—more than $260 billion—in the fourth quarter of 2022.
Figure 1. Total E-Commerce by Quarter and E-Commerce at a % of Overall Retail Sales, U.S. Census
The changes in the way we buy also affect the way we pay for state and local government. Shifts between traditional and online sales alter the flow of revenue with important consequences for the General Fund and Education Trust Fund, counties and municipalities, and schools across Alabama.
Although the SSUT was initially celebrated for capturing an elusive revenue stream, its distribution formula has led to debates about fairness. The SSUT’s rate is lower than the rate for in-person purchases in most large cities, creating an advantage for online retailers at the expense of brick-and-mortar stores. The growing volume of commerce the tax applies to has sparked fears that the traditional sales tax will diminish in favor of the online alternative. That, in turn, would diminish the revenue that cities and schools depend on.
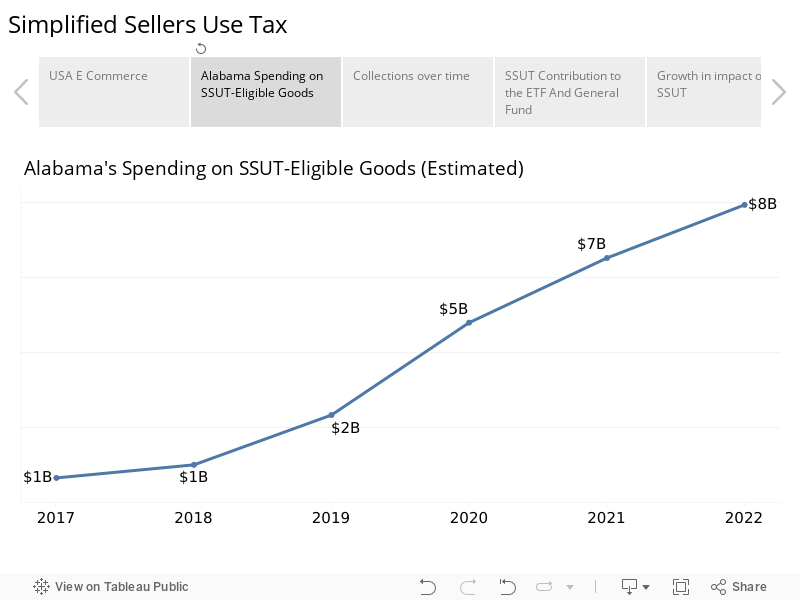
Figure 2. Estimated Growth in E-Commerce Activity, based on collections of the Simplified Sellers Use Tax
This report aims to explain the SSUT’s origin, describe how it works, analyze its implications, and discuss alternative policies so that Alabamians are equipped for the conversation on the SSUT.
The Origin of the Simplified Sellers Use Tax
Traditionally, states were limited to applying sales tax only to transactions within their borders. That norm was challenged in the 1990s by Quill Company, which sold office equipment and stationery over the phone and through mail-order catalogs. A Delaware corporation, Quill shipped goods all over the country. Those sales went untaxed until the North Dakota State Tax Commissioner tried to force the company to collect and pay taxes on their sales in that state.
Supreme Court Decision Blocks Taxation on Certain Interstate Sales
The Supreme Court ruled in Quill’s favor and struck down the North Dakota tax. From 1992 to 2018, a company without a “physical nexus” (an existing retail outlet) in a state would not be subject to any taxation from that state. The decision, which revolved around mail-order catalogs, helped make way for the unforeseen boom in online retail sales.
In 2000, e-commerce retail sales made up less than 1% ($6 billion) of total sales in the U.S. By 2010, that percentage had climbed to nearly 5%, representing $45 billion in sales. That commerce went largely untaxed. Alabamians were expected to report their online spending when they filed their tax returns and to pay taxes on those items purchased. That is known as a consumer use tax, a companion to the sales tax, but it applies to purchases made in another state. The use tax is generally paid by the buyer rather than the seller.
But relying on consumers to self-report online purchases and pay taxes through the income tax system was ineffective. As states recognized they were missing out on an increasing share of revenue, they began to develop policies to capture it and lobbied for a national solution to the problem.
SSUT Initially Established as an Optional System for Online Sellers
Initially, states created voluntary tax schemes, like Alabama’s SSUT, for sellers to collect and remit online sales taxes. By 2018, 45 states had 45 policies with different qualifications, thresholds, and expectations for compliance. Alabama’s was called the Simplified Sellers Use Tax: “simple” because of its statewide flat rate of 8%, “sellers” because it put the burden of remitting on the out-of-state vendors.
Established by Act 2015-448, Alabama’s SSUT went into effect in January 2016. Its simple state-level rate of 8% made it easy for online vendors to collect a flat rate on sales statewide and submit the proceeds to the state rather than collecting and remitting sales taxes to each municipality and county where they sold items.
Meanwhile, pressure continued to build to allow states to tax online sales, particularly as it became increasingly clear that online retailers were benefiting from an advantage over brick-and-mortar stores located in local communities.
Supreme Court Reversal Allows States to Tax Online Sales
In 2018, the U.S. Supreme Court reversed the Quill decision, and in South Dakota v. Wayfair upheld a South Dakota law that required online sellers to collect and remit taxes on their sales in the state. The Wayfair decision led states, including Alabama, to amend and mandate their respective tax policies. The ruling stipulated, though, that state tax schemes should not put an undue burden on sellers.
Alabama’s SSUT Laws and Amendments
Since its establishment as a voluntary tax, the SSUT has been revised multiple times to conform to the changing environment. Highlights include:
Act 2015-448
Established SSUT. Allowed vendors with no physical nexus in the state to collect and remit an 8% tax on all online purchases destined from Alabama. The amount and its distribution proportions aim to mimic sales tax: a 4% tax levied by the state and 4% meant to represent local sales taxes.
Act 2016-110
A business in the program may remain unless they establish a storefront or an affiliate business has a physical nexus.
Act 2018-539
Mandates marketplace facilitators with revenue of more than $250,000 to collect and remit. Additionally, a 2% discount (of the tax collected, not a reduction of the 8% SSUT rate) will be allowed on the first $400,000 remitted if remitted in a timely manner.
Updated the distribution formula to its current formation:
- State of Alabama takes half (4 cents on every SSUT-eligible dollar spent)
- General Fund = 75% of the state share
- Education Trust Fund = 25% of the state share
- Local Governments receive the other half of the revenue (4 cents on every SSUT-eligible dollar spent)
- 40% to counties
- Individual county share based on the county’s share of the state population
- 60% to municipalities
- Individual city share based on the city’s share of the total municipal population
Act 2019-382
Updates the amnesty and class action provisions for eligible sellers.
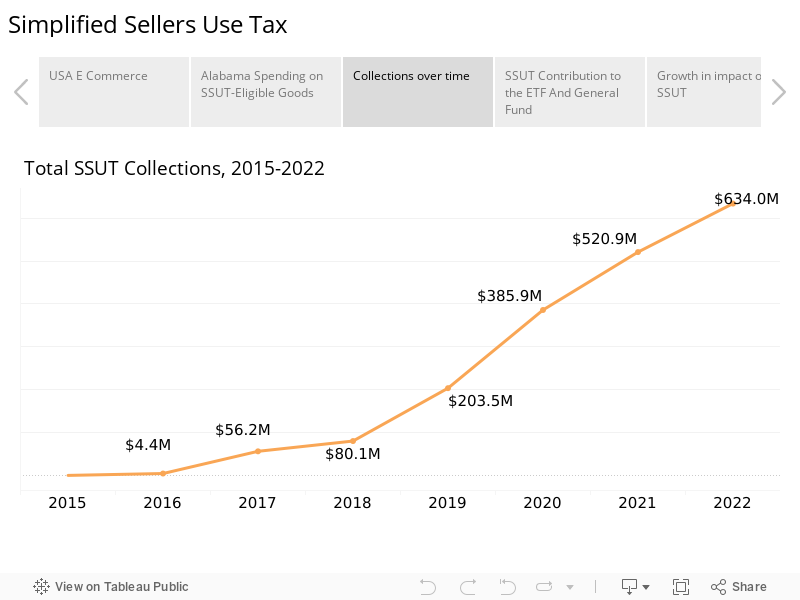
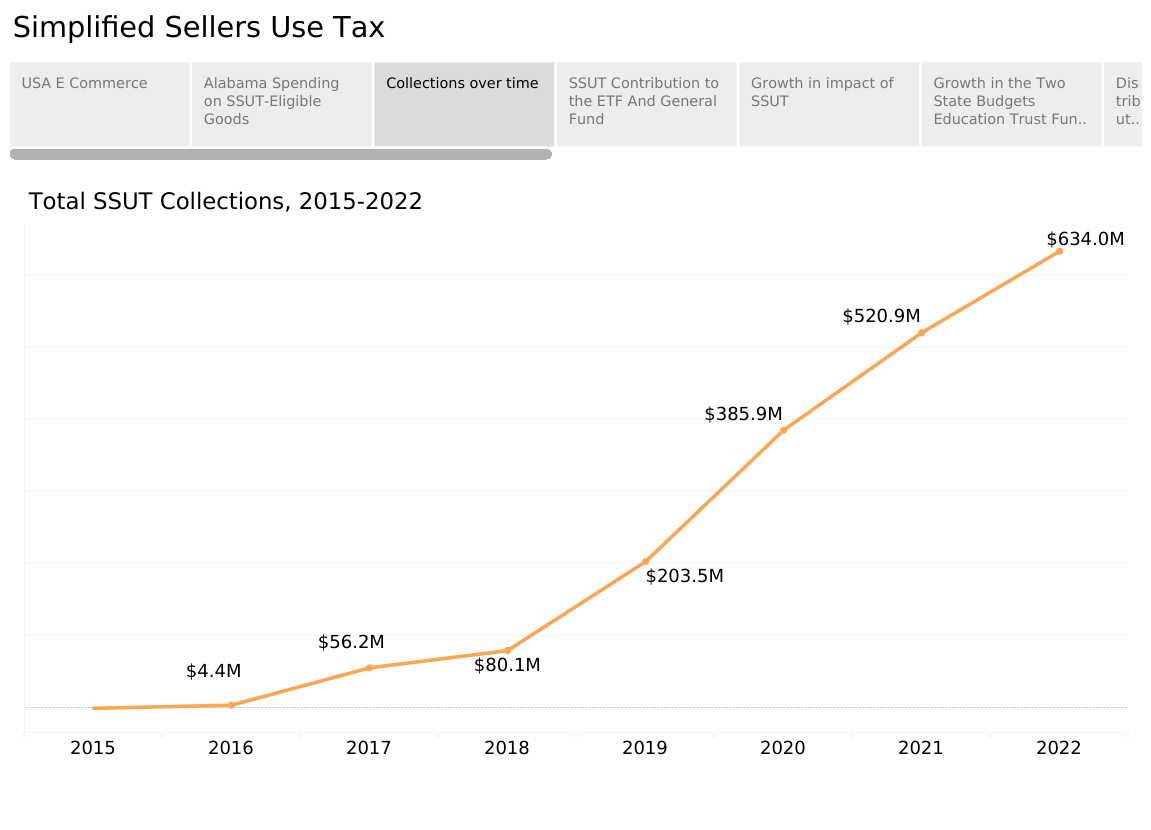
Figure 3. Growth in total collections of the Simplified Sellers Use Tax
How Has the SSUT Worked for State Government?
Alabama has an unusual approach when it comes to taxes and spending, an approach that has led to perpetual problems with budgeting. In most states, a mixture of taxes is levied, collected, and deposited into a General Fund. Then a budget reflecting the state’s priorities is created, and the funds flow out accordingly.
In Alabama, the bulk of taxes are earmarked by law, collected, and spent for a specific purpose. The largest sources of state revenue, the income tax and the state sales tax, are earmarked for education.
That has been good for education in good economic times because those taxes grow with the economy. In bad economic times, that has been a problem because revenues contract and cuts have to be made. For the rest of the government, earmarking creates a problem. There is not enough money to pay for needs, and what revenue there is does not grow enough to keep up with inflation.
In recent years, the Legislature took steps on both the budgeting and the revenue side to improve the situation. On the budget side, they set up a system that keeps from overspending during periods of growth.
On the revenue side, the SSUT was one of a handful of enhancements that injected much-needed growth into the General Fund.
Historically, the General Fund, which pays for non-education functions of state government, has been slow growing. The addition of the SSUT has helped change that equation, adding a rapidly growing revenue source to the General Fund.
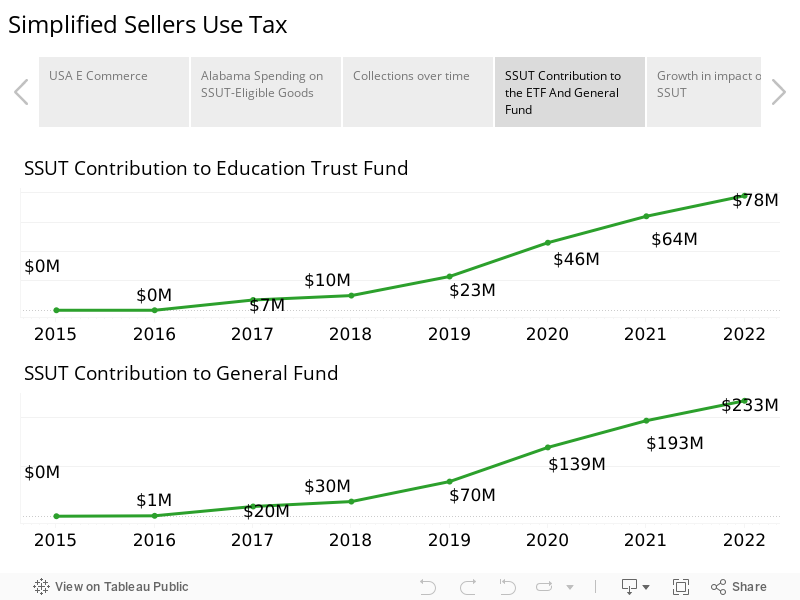
The General Fund receives 75% of the state share of the SSUT ($233 million in 2022), providing 8% of the fund’s total. The remaining 25% of the state share of the SSUT flows into the Education Trust Fund.
Figure 4. The SSUT’s Contribution to the Education Trust Fund and General Fund, 2015-2022
SSUT collections as a percentage of the funds have grown as well. In addition to the SSUT growth, the General Fund has benefited from adjustments to and growth in the traditional sales and use taxes.
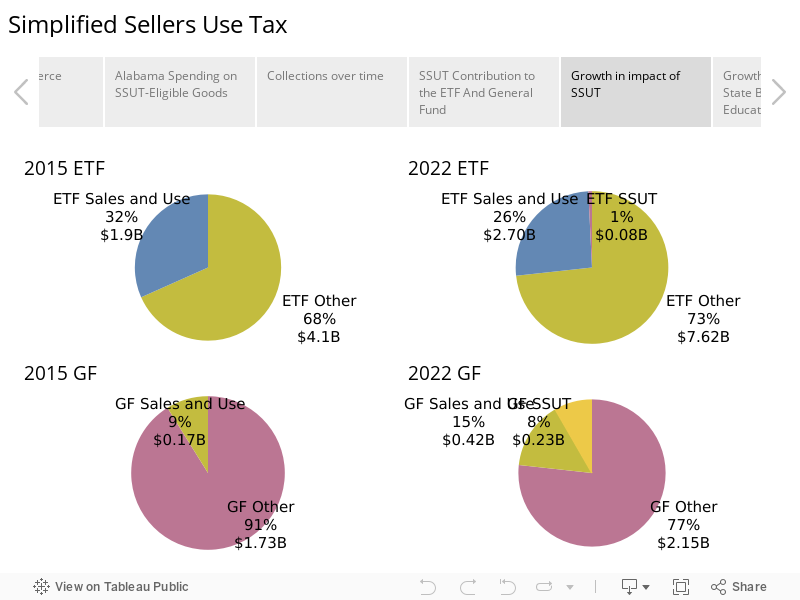
In 2015, the General Fund (GF) received a total of $1.9 billion, and the Education Trust Fund (ETF) received a total of $6 billion. At the time, the SSUT contributed nothing to either. Meanwhile, sales and use taxes made up 9% ($168 million) of the GF and 32% ($1.9 billion) of the ETF.
In 2022, the GF received $2.8 billion, and the ETF received $10.4 billion. The SSUT contributed 8% ($233 million) and 1% ($78 million) of the GF and ETF, respectively. Meanwhile, traditional sales and use taxes made up 15% ($418 million) of the GF and 26% ($2.7 billion) of the ETF.
Figure 5. Change in Contribution of the SSUT and Sales and Use Tax to the Education Trust Fund and General Fund
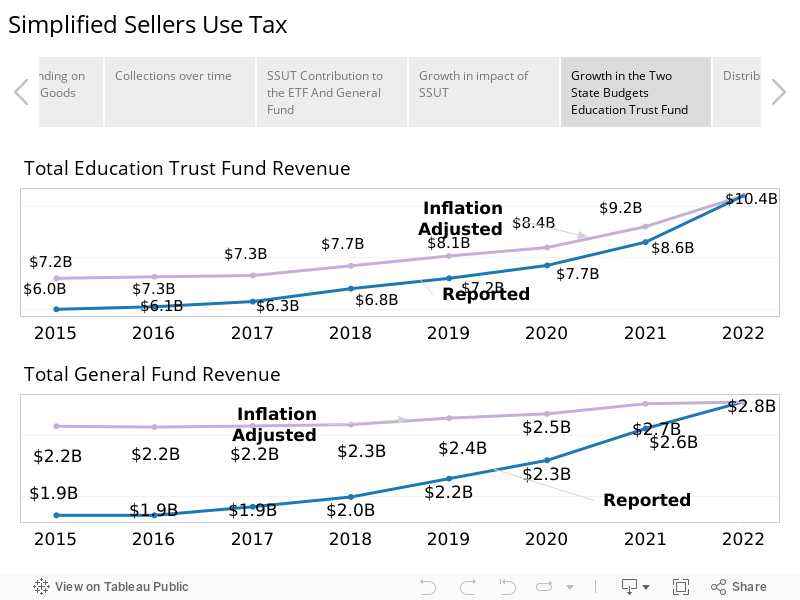
While the SSUT arguably shifts revenue from the Education Trust Fund that would have been collected as sales tax, the rise of online sales has occurred at a time when the traditional sales tax and income tax have grown rapidly.
Thus, despite the change in flow, the ETF has seen healthy growth as well. Sales tax collections rose more than 40% from 2015 to 2022, but other revenue—principally the income tax—rose even more. Revenue from income taxes nearly doubled, from $3.9 billion to $7.4 billion in 2022.
Figure 6. Overall Growth in Alabama Education Trust Fund and General Fund, 2012-2022
How Has the SSUT Worked for Local Governments?
At the state level, the SSUT closely parallels the state’s general sales tax, except in its division of proceeds between the General Fund and the Education Trust Fund. At the local level, though, the revenue produced by SSUT and distributed to local governments does not match local sales tax rates or activity level.
Whether or not the SSUT should closely resemble local sales tax is a policy decision. Presumably, online sales compete with local brick-and-mortar sales. Those local brick-and-mortar stores must collect a higher sales tax rate than online retailers. Brick-and-mortar stores also pay property taxes and employ more local residents than are supported by delivery services linked to online retailers.
At the same time, sales tax collections tend to be concentrated in larger communities. Those larger communities benefit from not only the sales taxes paid by residents but also from sales taxes paid by people from other towns and unincorporated areas who drive in to shop.
With the rise of online sales, should the taxes paid on goods purchased on the Internet and delivered to doorsteps reflect the existing shopping patterns? Or should the proceeds of online sales taxes be equally distributed according to where people live?
Currently, the SSUT reflects a simplified collection and distribution system with a flat rate and a distribution by population. Cities, counties, and school systems that benefit from taxes generated under the local sales tax system see the online option as a competitive threat, with a competitive advantage created by the SSUT.
At the same time, cities and counties without a strong commercial base may be benefiting from an online delivery system that decreases their residents’ need to travel to commercial centers while generating taxes that would otherwise have flowed to commercial centers.
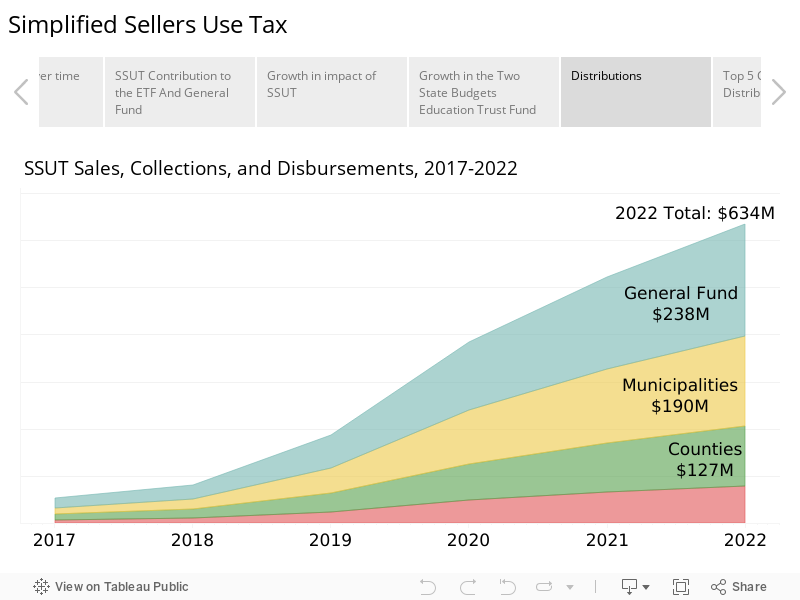
Figure 7. Distribution of the Simplified Sellers Use Tax, as divided between state and local governments, 2022
Counties
Counties are now receiving 20% of total SSUT collections.
For those counties with little income from sales tax, the money from the SSUT represents new revenue. But counties that generate significant sales tax revenue might be missing out on revenue due to purchases moving online. That is because the tax rate for the SSUT is lower than the sales tax in most large jurisdictions. Additionally, the revenue from online transactions is being dispersed across the state on a per capita basis with no adjustment for where the order and delivery are occurring.
The loss of revenue to a particular county can be estimated by first taking a county’s sales tax collections and estimating that county’s proportion of Alabama’s total sales tax collections.[1]
That proportion applied to an estimate for total online sales can be used to estimate that county’s portion of all SSUT-eligible spending. Finally, the county’s sales tax rate is applied to find the revenue the county would have received if the county’s tax rate was applied to online sales.
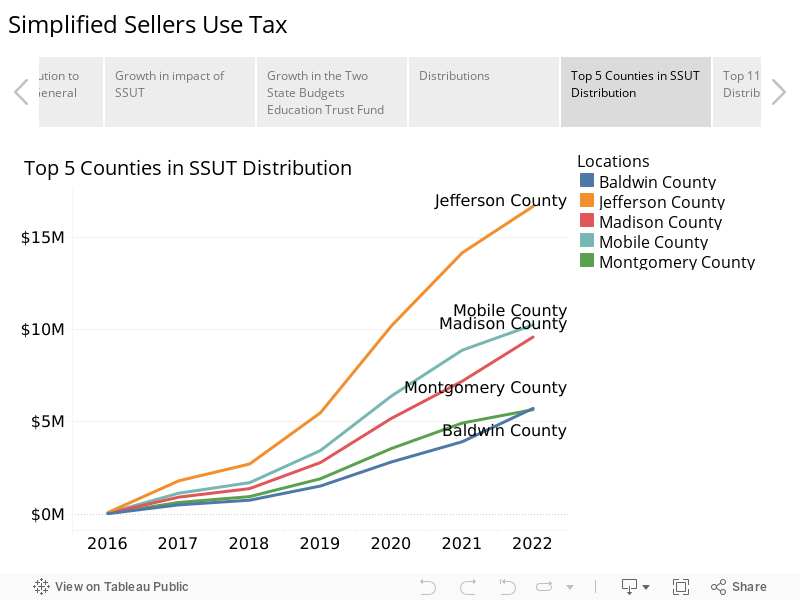
In fiscal year 2021 (FY 2021), Jefferson County received $14.2 million from the state from SSUT collections. That year, $6.4 billion was spent statewide on SSUT-eligible goods. According to PARCA calculations, in 2021, Jefferson County accounted for about 17% of the state’s total in-state sales tax collections. If Jefferson County accounted for 17% of SSUT-eligible spending as well, Jefferson County would have had more than $1 billion in taxable online sales. If Jefferson County’s countywide sales tax was applied to that total, the county would have collected $28 million in revenue from that online commerce.[2]
In FY 2021, Greene Country received $195,000 in remitted SSUT collections. Using the same approach applied to Jefferson, PARCA estimates that Greene County would have collected only $66,000 if it applied the county’s 3% rate to its estimated level of SSUT-eligible sales.
Another way to compare SSUT distributions and local sales tax is to take income into consideration. The current per capita distribution assumes that every person in every county spends similarly online. Since higher income is correlated with higher levels of spending, an income-weighted distribution might more closely approximate actual local spending patterns.
For instance, in FY 2021, Madison County received $7.2 million in SSUT remittance. If SSUT was distributed by income and population, PARCA estimates the county would have received $10 million in disbursements.
Figure 8. Top 5 Counties in SSUT Distributions
Cities
Questions about the SSUT’s distribution formula are most pressing for municipalities where brick-and-mortar stores tend to be concentrated. Higher sales tax rates and dependence on sales tax revenue make the issue especially contentious.
Since 2018, all municipalities have enjoyed this new revenue from online sales, with the amount received based on city population. However, municipalities with large populations and high sales tax contend they are losing out on revenue they would have received if the purchases had been subject to a local sales tax instead.
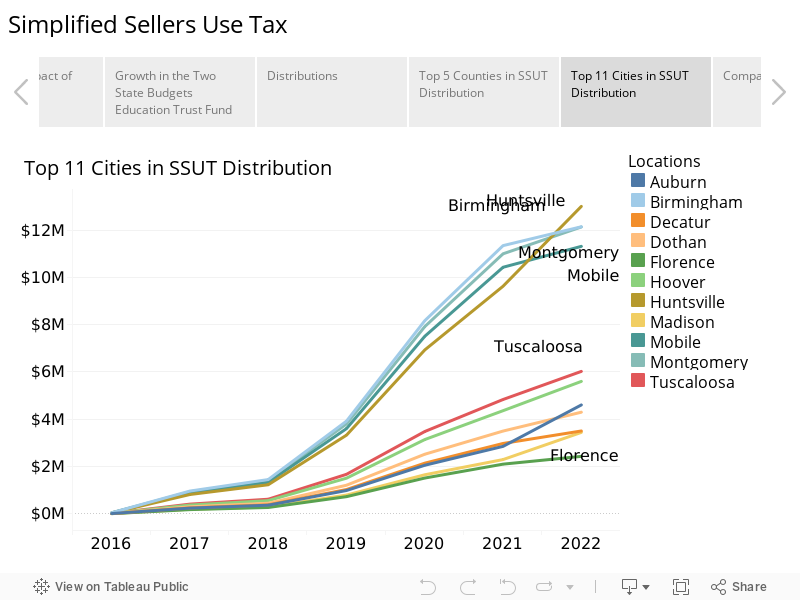
In FY 2021, Tuscaloosa received $4.8 million from the estimated $6.4 billion in SSUT-eligible statewide spending. PARCA estimates Tuscaloosa’s 3% tax on its portion of statewide sales would have yielded upward of $6.6 million.
In FY 2021, Hueytown received $860,000 from SSUT disbursements. That year, it accounted for roughly 0.33% of the state’s sales. If Hueytown had received their 4% tax on that proportion of the SSUT sales, it is estimated they would have received a slightly lower amount: $856,778.
Hueytown represents a middle ground of municipalities that receive similar collections in both methods. The smaller the sales tax collections, the greater the difference between what they would have collected and what they received.
Many municipalities have less sales tax revenue than Hueytown, and many are probably receiving twice what they would have collected from sales tax.
While this distribution method might seem inequitable, it is worth considering the flaws of traditional sales tax.
Sales taxes are paid at the point of sale. This means that the Alabamians flocking to cities with high sales tax for retail are not only paying above their dwelling municipality’s sales tax, but they are also paying into the budgets of a different municipality altogether.
Figure 9. Top 11 Cities for SSUT Distributions
School
The SSUT and its distribution system also have an impact on school budgets. School systems receive sales tax money, collected and distributed according to local law or flowing through the county or municipal government. Presumably, as sales shift online, that revenue is diminished. The taxes from those online transactions, collected through the SSUT, are distributed to cities and counties. Unlike sales taxes, local governments are not obligated to pass along a portion to the schools.
In 2021, 120 school systems received revenue from county sales tax (totaling $665 million), and 40 school systems received revenue from city sales taxes (totaling $176 million). Some systems receive both city and county sales taxes. In total, 131 school systems received sales taxes from a county, a city, or both.
Some cities treat the SSUT as if it were sales tax and distribute it to the schools in the same proportion as the traditional sales tax. Some school systems have negotiated agreements to receive a portion of the SSUT. Many have not.
The Alabama Department of Education asks school systems to report local sources of revenue. This reporting may not completely capture whether or not SSUT funding is flowing to the systems, but far fewer systems report receiving SSUT funding than report receiving traditional sales taxes. As of December 2022, only eight school systems reported receiving funding from their county’s SSUT revenue, and only seven school systems reported receiving funding from their city’s SSUT revenue, according to Alabama Department of Education records.
SSUT’s Unintended Consequences in the Marketplace
SSUT decisions also impact brick-and-mortar businesses. The SSUT’s low rate of 8% allows out-of-state vendors to charge lower prices than their in-state competitors.
Brick-and-mortar businesses employ more people and contribute to the local economy in various ways, including through the payment of rent or property tax. And yet they are compelled to collect a higher combined sale and local sales tax rate than an online seller.
Small businesses in Alabama are obligated to collect and remit sales taxes, whatever their sales volume. Out-of-state online businesses that sell less than $250,000 to Alabama customers are not obligated to participate in SSUT.
There are also situations in which local businesses could find an advantage in selling through a third-party, online marketplace facilitator and thus avoid paying local taxes. The online transaction could be facilitated through an online marketplace, assessed the 8%. The customer can then pick up the item at the store or have it delivered to the home, circumventing local sales taxes.
Alternatively, some Alabama residents are, at least in theory, overpaying sales taxes on online transactions—Alabama residents who live in jurisdictions where the sales tax is lower than the 8% SSUT.
The Alabama Department of Revenue does have a process in place to reimburse residents living in these jurisdictions. The process involves filing a claim with documentation of purchases. The Department does not report how much has been claimed through that process.
Still, even if a rural resident pays the SSUT on a transaction, it is not necessarily true that they are suffering an injustice. If that rural individual were to instead purchase the same item in a physical store, that store would likely be located in a jurisdiction that collects 8 cents or more in local taxes, since most retail stores are located in cities with sales taxes.
If Alabama wanted the SSUT to match the local sales tax, it would need to make sure a replacement system doesn’t impose an “undue burden on interstate commerce.” The opinion of the court gave little detail about what is burdensome, but it expressed that what South Dakota had set up “appear(s) designed to prevent…undue burdens upon interstate commerce” and that it would be up to Congress to decide. Despite this, there are cases going on in Louisiana and Colorado that might force the courts to give more guidance.
It is currently unknown what constitutes an undue burden, but it gets even harder to anticipate what that will look like as new technology emerges. In the Quill era, finding local rates in different states and remitting the correct amount was a huge burden. Nowadays, it has been made much simpler by the creation of easy-to-use databases and automated processes.
Currently, Alabama’s SSUT is less burdensome than most other policies. This means that our policy will not likely conflict with a future ruling. The implication for Alabama is that we could probably afford a more complex and demanding policy that might fix some of the problems discussed in this report.
Policy Alternatives
Alabama Simplified Sellers Use Tax has plenty of fans, and, for the time being, it will likely remain as it is.
It is simple—one uniform rate statewide, collected by one entity, the State of Alabama. This simplicity decreases the cost of compliance for businesses and the cost of collection for the state. It also encourages participation in the system, which otherwise could be difficult to enforce.
For smaller jurisdictions that lack commercial activity, it has created a revenue stream where none existed. For counties, always cash-strapped and lacking independent authority to levy a tax, the SSUT has been a boon.
But if the concerns of brick-and-mortar retailers and larger cities and counties are to be addressed, there are policy options.
Option 1: Level the playing field between online sellers and brick-and-mortar stores
The current SSUT rate of 8% online purchases is lower than the state average sales tax of 9.24%.[3]
That gives online vendors an advantage over brick-and-mortar stores. The difference is even more significant in some of the larger municipalities, with sales tax rates on in-person purchases reaching 10% in Birmingham, Montgomery, Mobile, and Tuscaloosa.
Table 1. Sales tax rates for top 10 cities, sorted by combined sales tax rate
Argument for: This option would maintain the simplicity of the SSUT for online sellers while leveling the playing field. This approach is the simplest to achieve politically and would benefit all the recipients of the SSUT. It would lower the incentive for companies to remain out-of-state or migrate transactions to an online third party.
Argument against: Raising the rate does not address objections to the current distribution system, which does not align with the level of commercial activity or wealth in a community. As currently structured, the SSUT is more of a statewide revenue-sharing mechanism than a local tax. Additionally, for residents of low-tax jurisdictions, the tax on online goods would be much higher than in their home jurisdictions. Raising the rate also does not address the plight of school systems losing out on local sales tax.
Option 2: Equalize other terms between online and in-person sales
Currently, a remote business that generates less than $250,000 in revenue annually does not have to collect and remit SSUT. Notably, this threshold is more than double the typical threshold of $100,000 in force in other states. More importantly, there is no similar threshold for brick-and-mortar stores subject to normal sales tax. This gives small online retailers a considerable advantage over their local competitors.
Argument for: An adjusted threshold would bring Alabama more in line with the majority of states in terms of capturing sales taxes from online transactions, and changes could level the playing field with Alabama-based sellers. The amount of SSUT collections would increase, and all the recipients of it would benefit.
Argument against: The adjustments would impose a burden on smaller Internet-based companies in terms of compliance. It would not address the disbursement method for those who want it changed. It doesn’t help local schools that lose out on local sales tax.
Option 3: Apply to all purchases, online or in-person, the appropriate state and local taxes for the jurisdiction
Alabama could require online sellers to calculate and pay the sales tax based on where the order is being delivered. That would require that Alabama provide a system for cataloging, geocoding, and communicating the appropriate rates. And it would likely require localities to give up control of the tax collection and administration process.
Perhaps, the easiest route would be to join the 24 states, including Georgia, North Carolina, Kentucky, and Tennessee, in adopting the Streamlined Sales Tax, a multistate cooperative system for simplifying the assessment and payment of sales taxes. The participating states agree to a set of common rules and definitions and provide up-to-date information on sales tax rates and the precise geographic areas where those rates apply.
The simplification effort was launched after the original Quill decision, which prohibited taxation across state lines because of the overwhelming complexity of determining local sales tax rates and rules in the multitudes of jurisdictions across the country. Since then, cooperating states have been supported by businesses interested in simplifying compliance and payment. Like the SSUT, the Streamlined Sales Tax initially offered a simplified and voluntary way to pay taxes on online sales.
The drive to simplify and the evolution of technology helped pave the way for the Wayfair decision, which allowed states to require online vendors to collect sales tax. In the Wayfair case, the Supreme Court reversed Quill, recognizing that South Dakota, a participant in the Streamlined Sales Tax effort, had created a system in which Wayfair was no longer facing an “undue burden” complying with the taxes state and local governments levied.
Remote companies who want to sell to participating states must register with the Streamlined Sales Tax Governing Board Companies and then can use the database (provided by the state to the Streamlined Sales Tax Governing Board) of locations and tax rates. The collections are sent directly to a single state entity and then distributed to the areas from which they were collected.
Alabama has traditionally been resistant to having one entity, presumably the State Department of Revenue, administer taxes on behalf of all local governments. In fact, Alabama, Alaska, Arizona, Colorado, and Louisiana are the only states that allow complete home rule over sales taxes.[4]
That resistance to state collection and distribution is one of the reasons why Alabama has not joined the Streamlined Sales Tax organization. If Alabama joined, municipalities could still set their own sales tax rates, but they would lose control of aspects of tax administration. A centralized system for filing and payment of sales taxes would be required. Cities require returns submitted to individual jurisdictions or audit businesses they suspect are not paying their fair share. Certain definitions and schedules would need to be uniform.
Alabama’s SSUT avoids the complexities that would have resulted if Alabama allowed municipalities to tax online sales. Louisiana and Colorado both have notoriously complex home rule local sales tax systems. Both states are facing lawsuits from companies that claim the complex system is too hard to comply with and places an undue burden on remote sellers. If Alabama were to adopt a system in which local sales tax rates were assessed on online transactions, the state would be wise to adopt a unified and simplified system for administering it.
Argument for: Bringing local sales tax rates and online sales tax rates into conformity would create a level playing field and would allow local communities to set rates and benefit from the economic activity within their borders. Local transactions would support local priorities.
Argument against: Alabama would need to have a sole entity collect sales taxes and oversee sales tax auditing. Local governments would lose some aspects of control. Alabama would need to create and maintain a centralized database of all the sales tax rates and their respective boundaries. Compliance would be more complex for online sellers. The equalized distribution of tax resources produced by the SSUT would be eliminated and replaced with a system that perpetuates the concentration of wealth and economic activity.
Conclusion
The Simplified Sellers Use Tax was a good step in a direction many states still have not attempted. Its simplicity and low-rate prioritized compliance did not require much coordination. It enticed online sellers to participate, providing advantages at a time when collection and payment of online taxes were voluntary.
Since the SSUT was adopted, remittance is now mandated. The amount of money spent online has exploded, and with it, the consequences of the SSUT’s setup.
Currently, many brick-and-mortar stores must charge higher prices to cover higher tax rates. Large municipalities and counties miss out on critical sales tax revenue, and schools lose out on local sales tax revenue. Meanwhile, smaller counties and municipalities are receiving a substantial amount of money from SSUT distributions. The effects of this policy are somewhat hidden behind our recent windfall of federal money and general economic surge, but they will become more pronounced when we are strapped for cash.
Whether a change to the Simplified Sellers Use Tax comes this session or in the next few years, it will likely come. It could come as a small rate change, an adjustment of distribution, or perhaps a major overhaul of sales tax as we know it. Even after such a step, the Wayfair decision set in motion a technological and political conundrum that will not soon be solved. Ongoing litigation will more clearly establish what constitutes an undue burden in the collection of Internet sales taxes. This will change how much governments can ask of businesses, but evolving technology will also make that mark a continually moving target.
[1] A certain portion of the sales tax is not attributable to a particular county. That pool of sales tax revenue is not considered in this calculation.
[2] Jefferson County’s traditional countywide sales taxes flow not just to the county commission but to multiple agencies as designated by law. As in other counties, the SSUT distributions in Jefferson are sent to the county commission.
[3] Fritts, “State and Local Sales Tax Rates,” accessed March 22, 2023, https://taxfoundation.org/publications/state-and-local-sales-tax-rates/.
[4] Gail Cole, “Economic Nexus, Home Rule, and Sales Tax: What Businesses Need to Know,” Avalara, Inc., accessed April 11, 2023, https://www.avalara.com/blog/en/north-america/2022/07/economic-nexus-home-rule-sales-tax-what-businesses-need-to-know.html.