PARCA continues to explore the results of the state’s new standardized test, the Aspire, and is developing new ways of looking at the data.
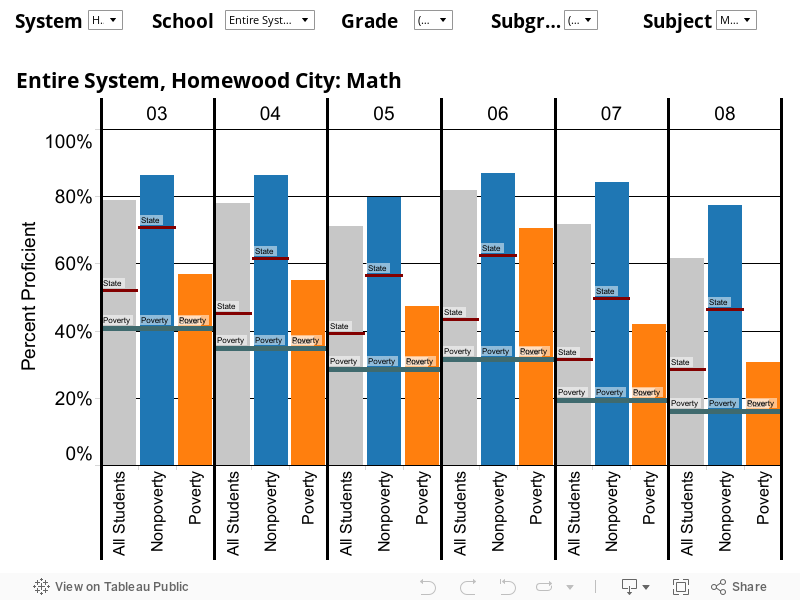
Aspire was developed by the same testing company that offers the college readiness benchmark test, the ACT. From grades 3-8, Aspire measures student progress at each grade level toward an eventual goal of graduating from high school ready for college-level work. In the graphics below, we will look at the average percentage of students scoring “proficient” on the Aspire. A student scoring at or above proficient is considered “on track” in the journey to success in college.
Below are three new glimpses of Aspire results from 2014.
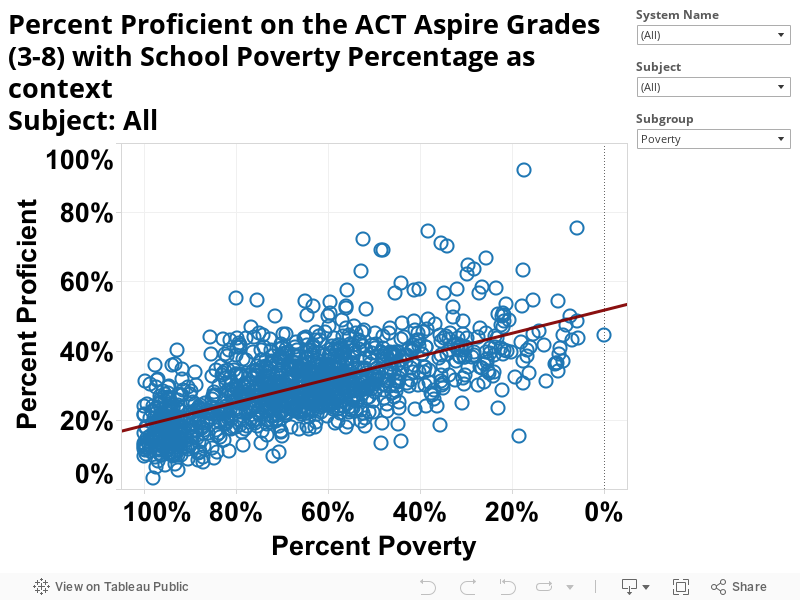
In each of the graphs, the circles represent school systems. A system’s horizontal position is determined by the percentage of students in that system qualifying for a federally-funded free or reduced lunch, a marker of poverty. Systems are arranged from 100% poverty, on the left, down to 0% poverty, on the right.
A system’s vertical position represents the percentage of test scores at or above proficient. The higher the circle the greater the percentage of students scoring proficient.
These three graphs within the chart below represent blended results for math and reading from grades 3 through 8. The first looks at the results for “all students” in a system. Then, using the menu at the top, you can also view the results for students from nonpoverty and poverty backgrounds. The red line through the middle represents the relationship between proficiency and poverty. In effect, this line shows the typical proficiency level for a school system, given the level of poverty among its students.

What do you see in the results? The first observation is the most obvious. When results from all students are considered, systems that have higher rates of poverty have a lower percentage of students reaching proficiency. This is not a new finding. Students coming from a background of poverty tend not to do as well on these test as students from nonpoverty households. This is consistent with results produced in Alabama and nationwide for many years. Closing this achievement gap is one of the great challenges of public education.
At the same time though, these graphs also indicate that schools and school systems make a difference. Those systems that are above the average line are outperforming expectations. There are lessons to be learned from those systems. It is also obvious from the wide span of performance among poverty students, that poverty status does not dictate results. In some systems, children from poverty backgrounds are succeeding at much higher rates than in others. It will take further study to isolate the secrets to success.
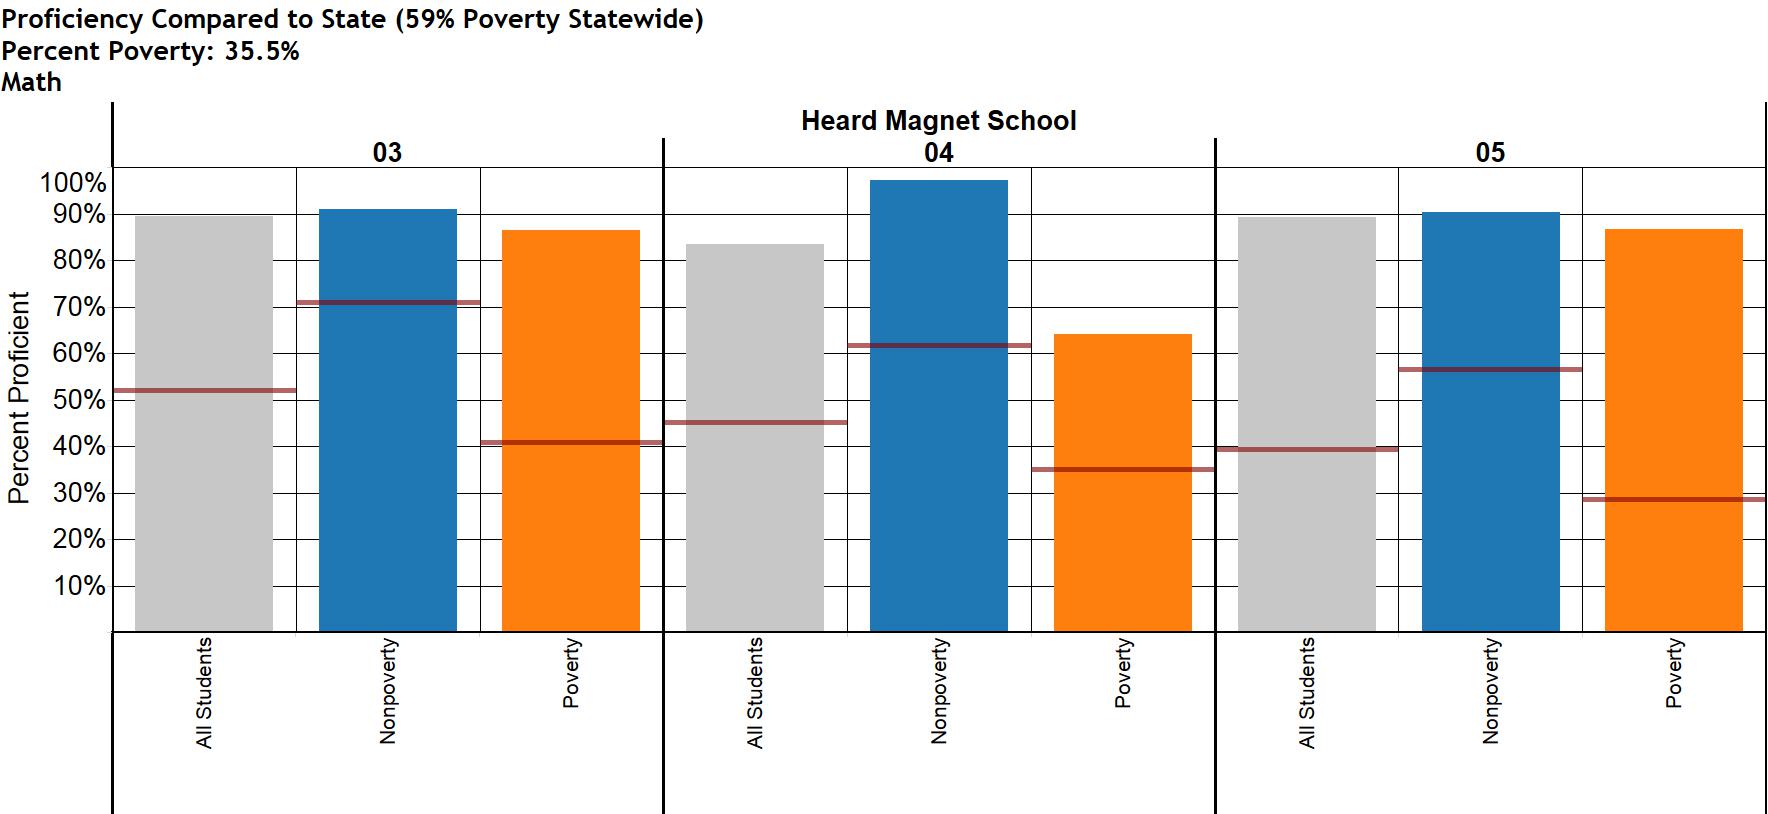
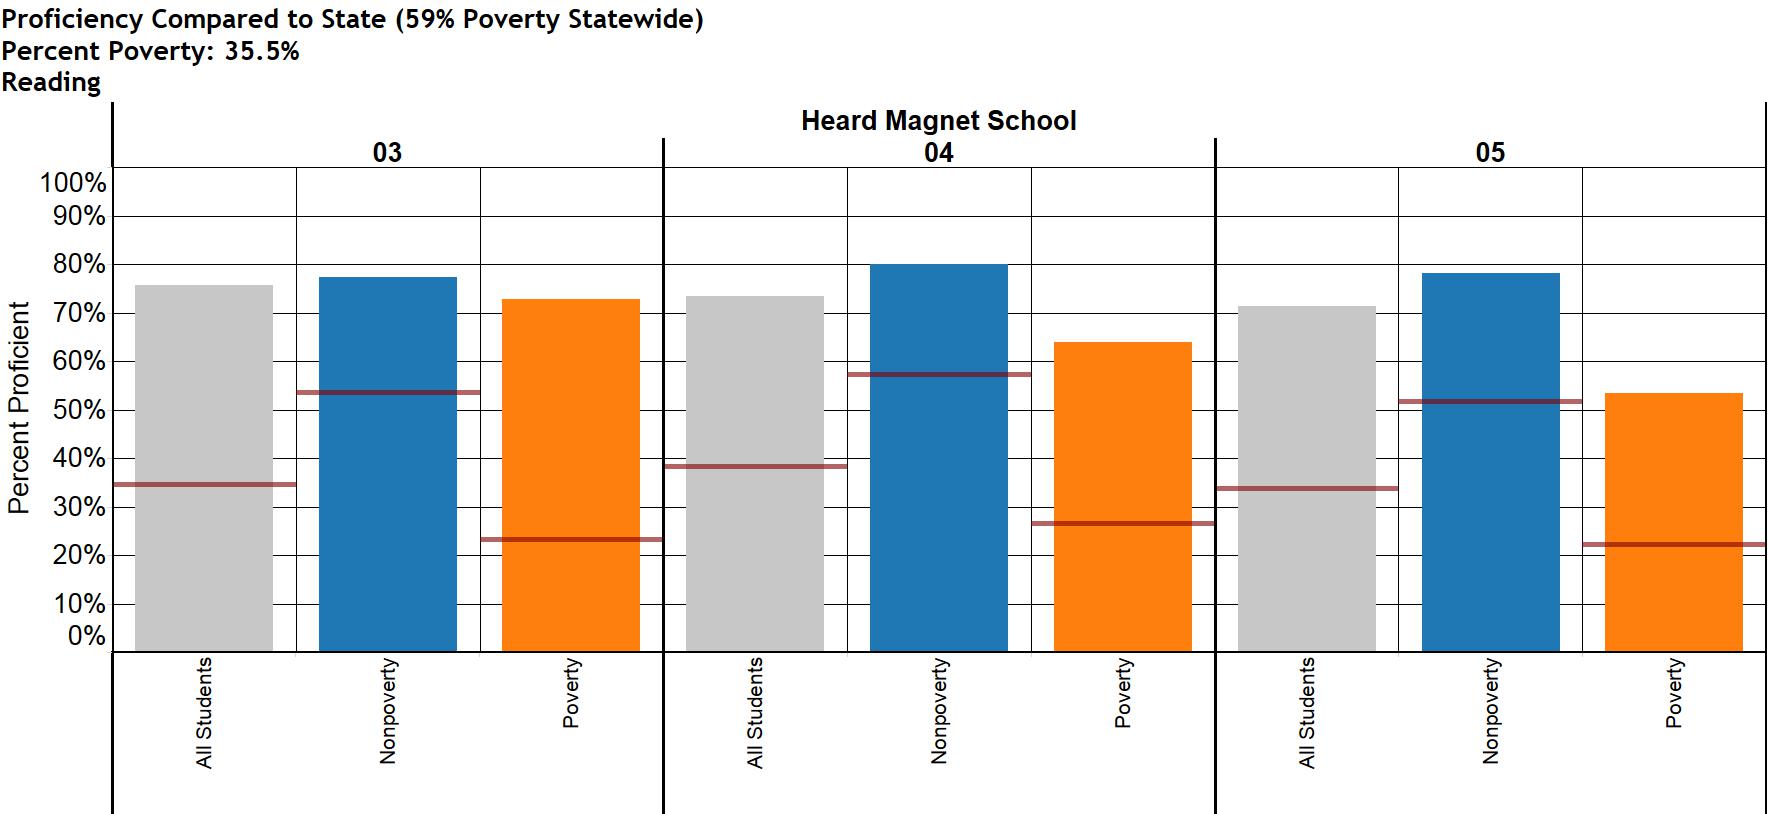
There is even more promise when you look at results at the school level. In the graph below, you can see the wide variation in success rates. Identifying successful schools and learning from their approaches should be a priority for the state and for struggling systems that want to improve.