Black students face harsher disciplinary measures than white students for similar offenses, a PARCA review of public school disciplinary records has found. Meanwhile, Alabama is one of few states nationally, and the only state in the Southeast, that has no uniform statewide policies requiring due process when students are suspended or expelled.
Suspensions have been shown to increase rates of school failure.
Students with a record of numerous disciplinary infractions are at a higher risk for trouble in school and life. Research has shown that students experiencing early problems with attendance, academics, and discipline more frequently experience negative outcomes, such as leaving high school without a diploma or graduating, but unprepared for college or work. Such problems in school have also been linked to a greater likelihood of poor health and criminal activity.[1]
There is very little evidence showing positive impact of out-of-school suspensions on student behavior, and in many cases, they are more likely to cause more harm than good. Out-of-school suspensions are disproportionately applied to Black students, and potentially contributing to a pipeline that leads from school to prison.
Background
In 2018, PARCA Research Coordinator Joe Adams collected data from the Alabama State Department of Education (ALSDE) that included extensive disciplinary records for the school years, 2014-15, 2015-16, and 2016-17. Using these data, PARCA has found that students who are Black are more likely to receive out-of-school suspensions than white students for the same offense, and students who are white are more likely to receive the less restrictive in-school suspensions than Black students. These findings provoke concern considering the broader context of racial inequities in education, healthcare, criminal justice, corrections, employment, and housing conditions.
In recent years research has found significant differences in the use of suspension and expulsion based on race. These data, along with research showing the long-term negative impact of suspensions and expulsion, have led states to re-examine their disciplinary policies, though Alabama is behind this curve.
A report issued by the Education Commission of the States in 2018 found that most states are limiting the use of suspension or expulsion. [2]
- Sixteen states, plus the District of Columbia, limit the use of suspension or expulsion by grade level, usually by disallowing suspension or expulsion in the early grades. Alabama’s state regulatory statutes do not currently have such limitations. Though suspensions are more common in middle and high school, they also frequently occur in the lower grades in Alabama.
- Several states limit the use of exclusionary discipline for certain violations. Of those, about 17 states, plus the District of Columbia, prohibit suspension or expulsion solely for a student’s attendance or truancy issues. This limitation does not exist in Alabama. Suspension is a common disciplinary action for truancy and tardiness in the state.
- About 30 states, plus the District of Columbia, encourage districts and schools to utilize non-punitive, or more supportive, school discipline strategies. Of those, 22 states, plus the District of Columbia, mention the use of specific, evidence-based interventions — such as schoolwide Positive Behavior Interventions and Supports (PBIS), restorative practices, Response to Intervention (RTI), trauma-informed practices and social-emotional learning. Alabama statutes do not address the school-wide programs cited above, though individual schools are choosing to implement PBIS, restorative justice, and other such programs, and the Alabama State Department of Education developed a guidebook to PBIS.
A student’s right to a fair hearing in the state is another important issue. Based on a 1975 U.S. Supreme Court ruling (Godd v. Lopez, 419 U.S. 565 [1975]), students who are suspended or expelled have a right of due process to defend themselves in a fair hearing. Since this ruling, states have enacted policies to ensure local communities follow through and protect a student’s constitutional right to a hearing. Some states outline very detailed procedures for local boards to use. Most directly state that no student will be suspended or expelled for more than 10 days without an objective hearing. Alabama is one of the few states nationally and the only state in the Southeast that does not have uniform statewide procedures that must be followed before removing a student from school. See https://safesupportivelearning.ed.gov/school-discipline-laws-regulations-state.
Some local boards in the state have developed due process procedures, with varying levels of clarity, and some have not. If a system fails to protect due process, the only recourse is a legal proceeding. Under these circumstances, it is conceivable that a student could be suspended, or even expelled, because of an infraction in which they are innocent, without a hearing and investigation into what happened.
Alabama lawmakers recognize these issues are a problem.
In the 2020 session of the Alabama Legislature Senate Bill 189 proposed limits on suspensions and expulsions. The bill proposed:
- Requiring local boards of education to hold a hearing when a student is expelled or suspended for more than 10 days.
- Prohibiting suspension of students enrolled in Pre-K through the fifth grade unless the safety of other students was endangered.
- Prohibiting suspension for truancy or tardiness.
At the close of the shortened 2020 legislative session, SB 189 had passed the Senate and was referred to the Education Policy Committee in the House of Representatives.
Analysis of Disciplinary Infractions
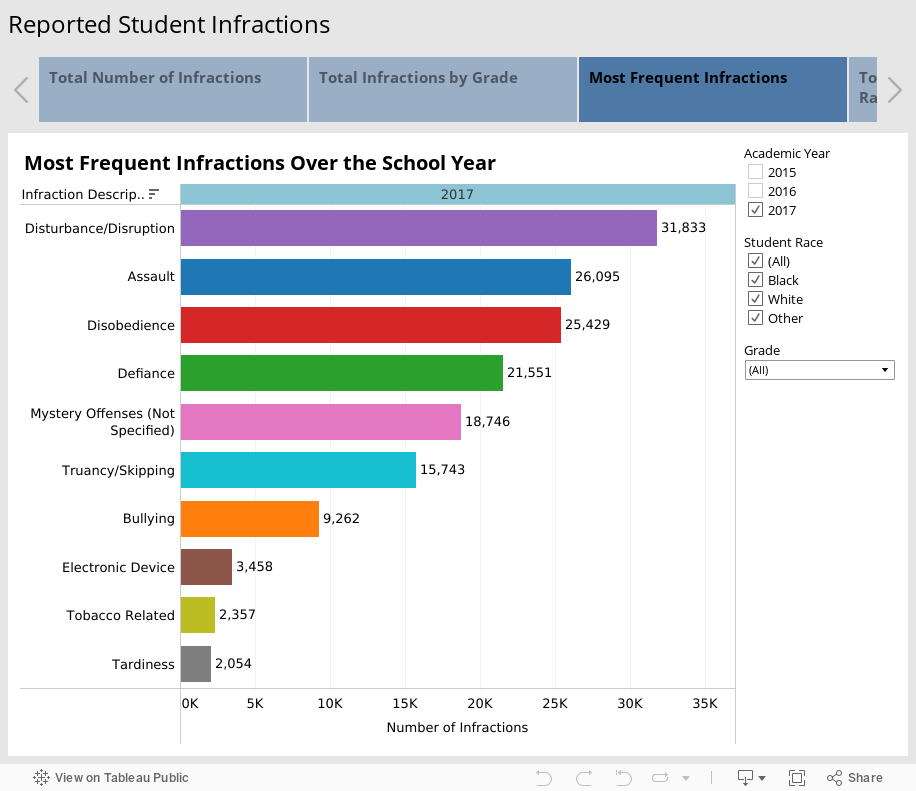
The dashboard charts below show data on reported infractions in Alabama schools, beginning with the number of reported incidences for all specific infractions collected in the state Student Incident Report (SIR) system. This includes charts showing the infractions with the highest number of incidents, as shown below.
Disturbances or disruptions generated the most reported infractions all three years, followed in 2017 by assault, disobedience, and defiance. These categories give some idea of the offense committed, but with limitations. Local schools and systems may vary in how they interpret these categories. Mystery offenses are unspecified offenses.
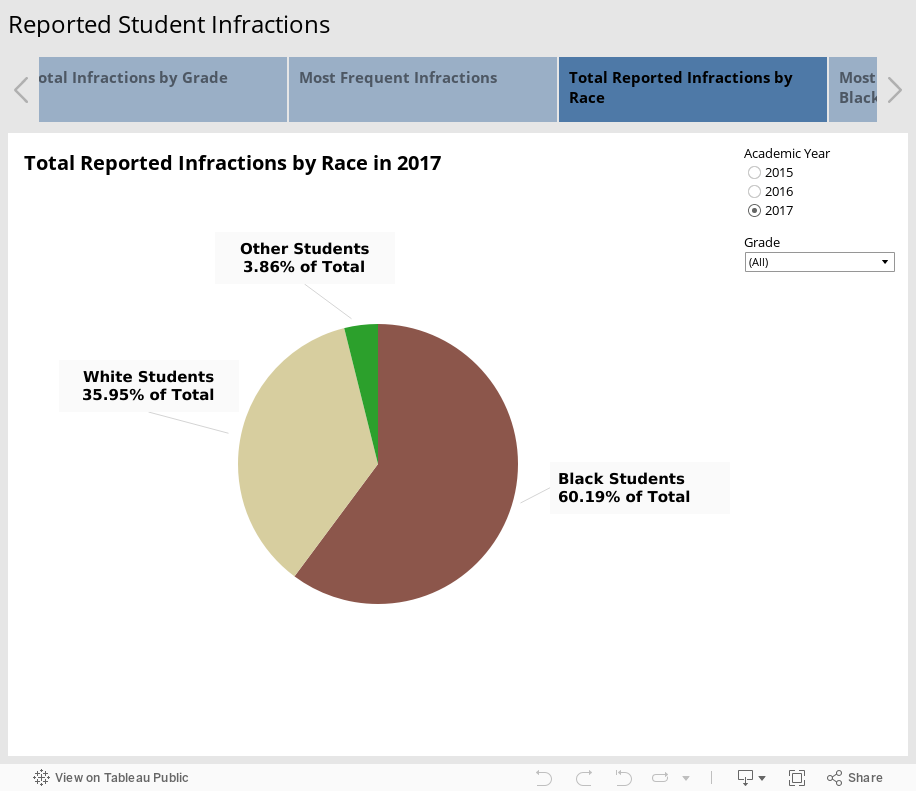
The total number of reported infractions by race are shown below. Students who are Black comprise 33% of students in Alabama’s public schools; however, they account for 60% of all reported disciplinary incidents.
Extensive research has demonstrated that students in low-income or poverty households are more likely to experience family stress, verbal and physical abuse, neglect, drug and alcohol use in the home, and other sources of emotional pain and trauma—and may develop different responses or reactions to stressful situations.[3] Cultural conflicts between students and teachers and administrators may also result in a disproportionate number of Black students cited for infractions, as well as teacher-student exchanges that escalate and fail to properly address situations that arise. [4] [5]
Responses to Disciplinary Incidents in Alabama Public Schools
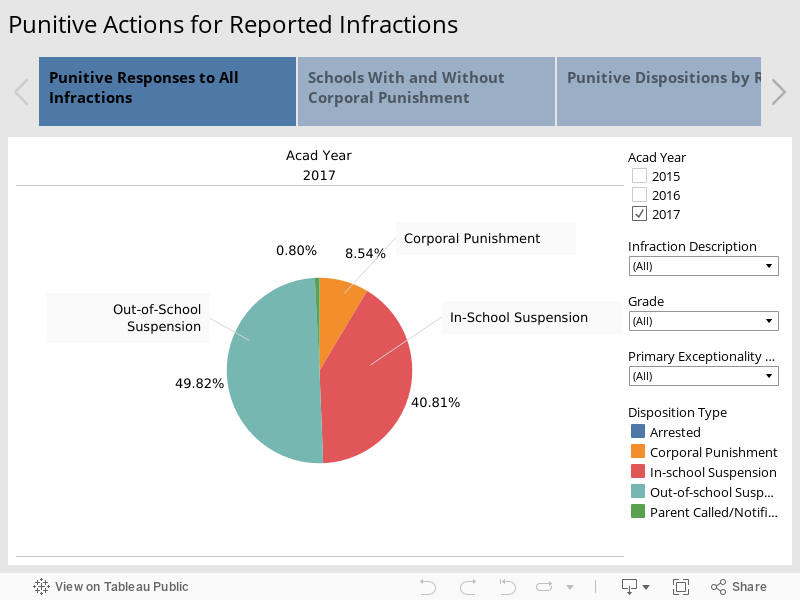
The following dashboard charts show the punitive actions (dispositions) for all offenses in Alabama, as found in the data provided to PARCA by ALSDE.
Among the incidents that are reported to the state in the SIR data, the preferred disposition for responding to the vast majority of incidents was suspension. Out-of-school suspensions are more common than in-school suspensions, though the 48-40% split is not an alarmingly large gap. Both are used frequently.
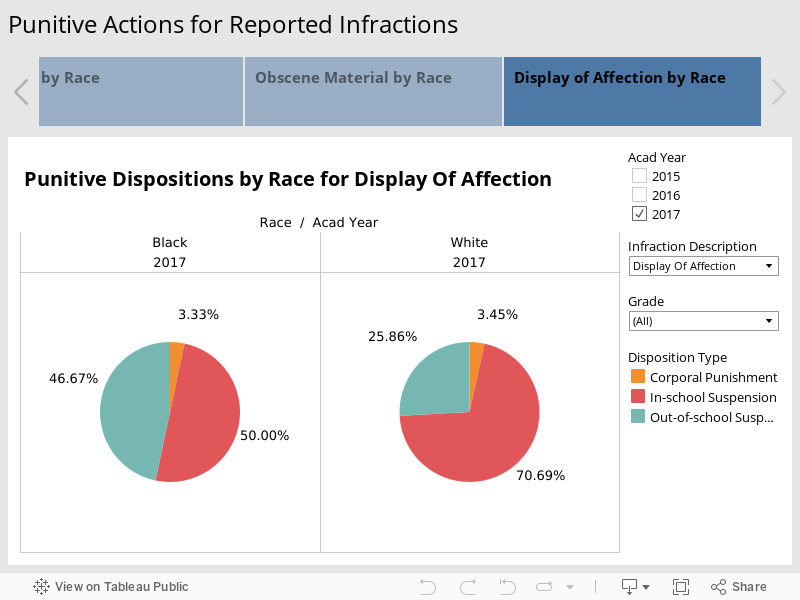
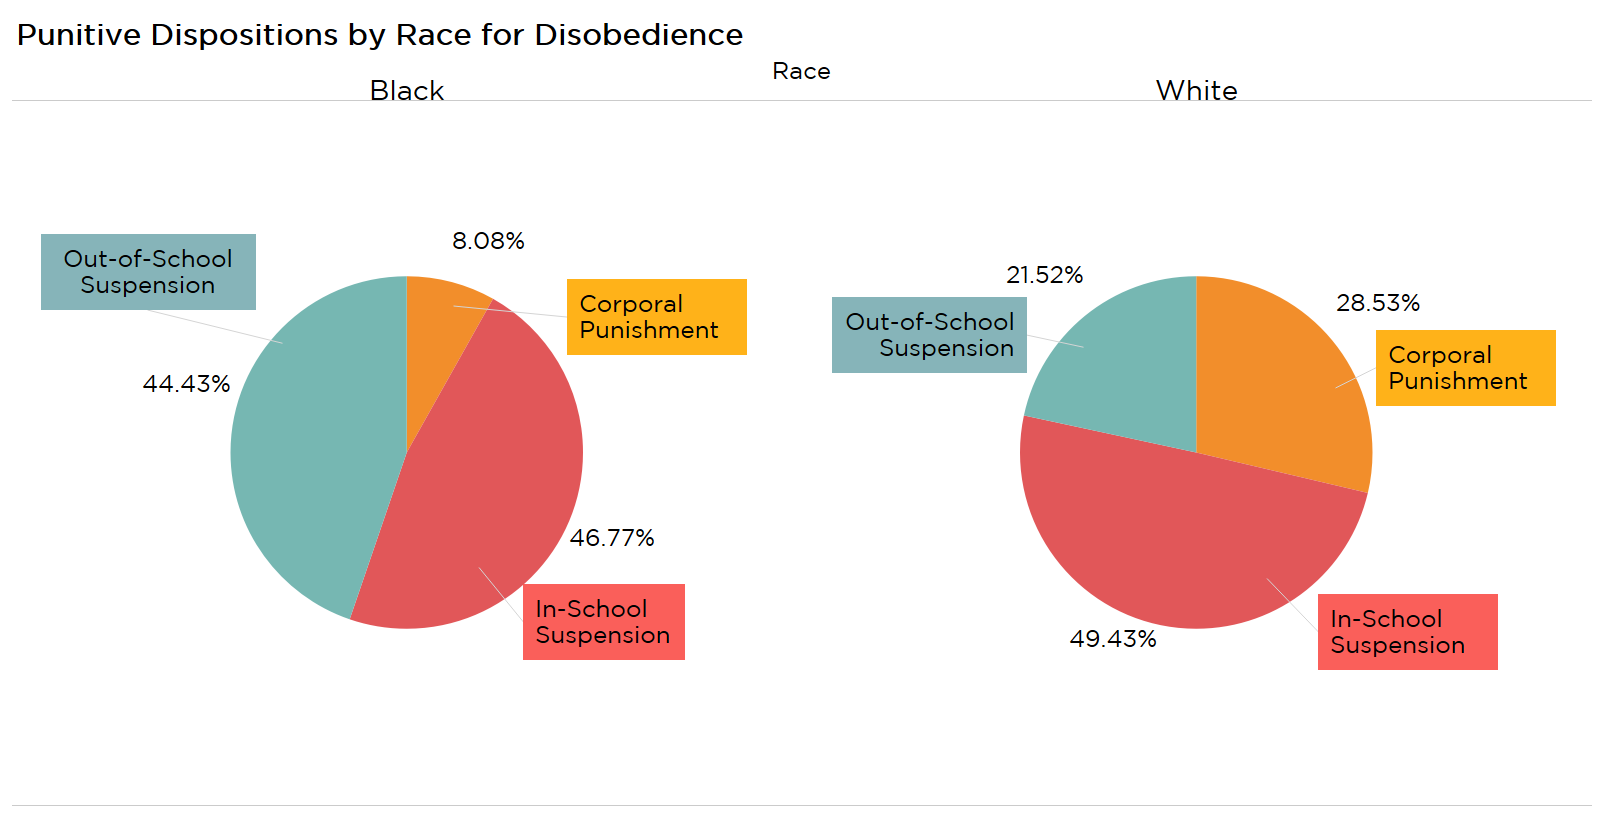
More problematic are dispositions by race. The following dashboard chart displays state-level disposition data for Black and white students, divided between schools that utilize corporal punishment and those that do not. In Alabama, systems that use corporal punishment tend to be majority white systems. Majority Black systems are more likely to prohibit corporal punishment. Systems with greater racial diversity are mixed in their use of corporal punishment. Consequently, by default, Black students are less likely to receive corporal punishment.
The proportion of Black students receiving out-of-school suspensions is markedly higher than for white students, who are more likely to receive the less severe in-school suspensions.
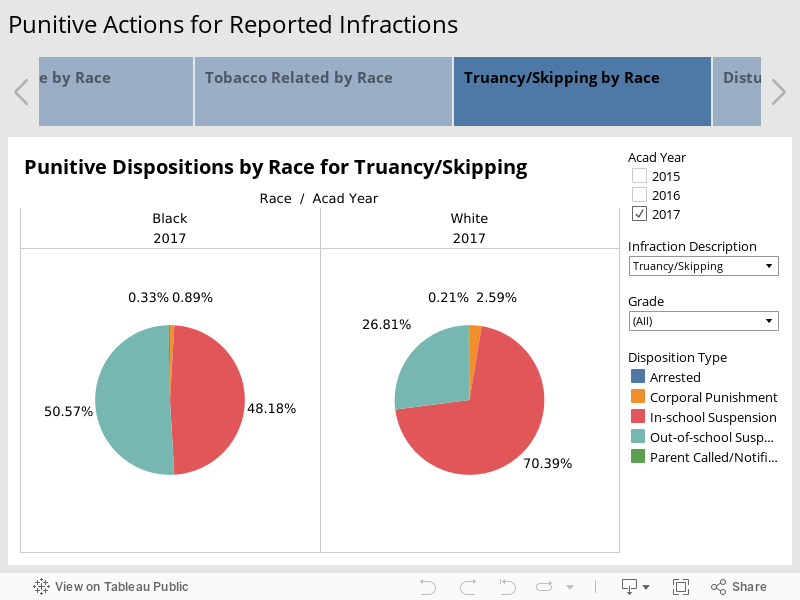
These patterns hold when looking at dispositions for specific infractions committed by both Black and white students. Looking at dispositions recorded for nearly 60 infractions, in 90% of the infraction types, Black students were more likely to receive an out-of-school suspension than white students for the same infraction.
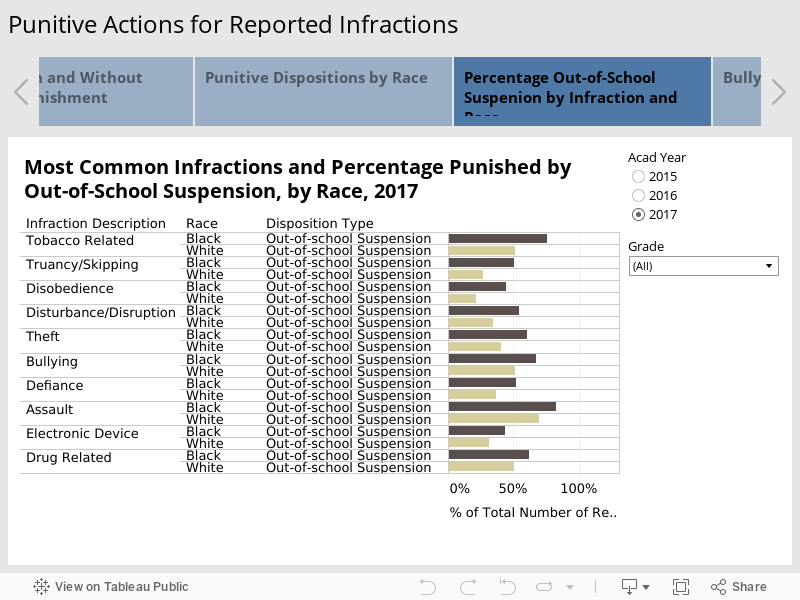
The dashboard charts show the percentage of students receiving out of school suspension by race for the most common infractions.
Infractions are ordered from the highest gap to the lowest between the percentage of offenses cited for Black and white students punished with out-of-school suspensions for the same offense. This order varies somewhat each year. Black students are more likely to receive an out-of-school suspension than white students for all of the 10 most common infractions.
Among the most frequently occurring infractions, the gap between cases in which Black and white students received out-of-school suspension was largest in 2017 for tobacco-related offenses and smallest for drug-related offenses. In 2016, the gap was largest for disobedience. Infractions for disobedience resulted in out-of-school suspension in 19% of the cases involving white students, but when Black students committed the offense, out-of-school suspension was used in 47% of the cases.
This is a gap of 28 percentage points – showing that Black students were twice as likely to be removed from school than white students for this same offense.
The charts below provide more detail for different infractions. Use the filters to explore results for all infractions. Examples are posted below.
Suspensions – Background and Research
In the 1990s and early 2000s, schools across the United States employed exclusionary discipline, namely in-school and out-of-school suspensions, at increasing rates. Suspensions are a punishment for “bad behavior” and may have also been seen as a “cooling off period” for students. In other situations, suspensions may be used to bring more control to a hostile situation and create easier conditions for maintaining a safe learning environment. In any case, suspensions are a signal to parents/guardians that their children are demonstrating behavioral problems.
With in-school suspensions, students are removed from their regular class but still attend school in a designated classroom or another school in the system. Thus, the students are still receiving some form of instruction and supervision. Out-of-school suspension prohibits the student from attending school for a temporary period, usually five or fewer days. Very serious infractions may result in expulsion—removing the student from the school system.
Clearly, there are situations where the safety of students and school personnel must take priority and call for removing a student from school grounds. However, there is very little evidence supporting the positive impact of suspensions on student behavior.[6] Researchers documenting the increased use of suspensions over the last three decades found they were not effective in changing student behavior and were associated with other negative outcomes, including lower academic achievement, grade retention, increased drop-out rates, and involvement with the juvenile justice system.
Critics argue that suspensions are adversely related to student learning. Suspensions remove students from the classroom or an optimal learning environment. Achievement gaps are widened as out-of-school suspensions are disproportionately given to students who are male, Black, economically disadvantaged, from single-parent families, or who have disabilities. Suspension can create more sense of separation between the student and school, increase feelings of not belonging, and negative feelings about school. Unsupervised students are vulnerable to getting in more trouble and consuming alcohol and drugs. Suspensions can cause further stress for children and a sense of isolation.
Suspension can be a way to remove the “problem” without addressing the underlying causes.
References
[1] Balfanz, R. (2009). Putting Middle Grades Students on the Graduation Path: A Policy and Practice Brief. Everyone Graduates Center and Talent Development, Middle Grades Program. Middle School Association.
[2] Rafa, A. (2018). 50-State Comparison: State Policies on School Discipline. Education Commission of the States. August 28, 2018
[3] Nixon, B. (2012). Stress Has Lasting Effect on Child Development. The Urban Child Development Institute.
[4] Investigating the Association between Home-School Dissonance and Disruptive Classroom Behaviors for Urban Middle School Students. The Journal of Early Adolescence, Vol. 38, pp. 530-553. April 2018. By K. Tyler, J. Burris, and S. Coleman.
[5] Classroom Disruptions, the Teacher-Student Relationship and Classroom Management from the Perspective of Teachers, Students, and external Observers: A Multi-Method Approach. In Learning Environments Research, Vol. 22, Issue 1, pp. 101-116, April 2019. By M. Scherzinger and A. Wettstein.
[6] Ritter, G. (2018). Reviewing the progress of school discipline reform. In Peabody Journal of Education, Vol. 93, No. 2, p. 133-138, 2018.