Alabama students continued steady improvement in English and math across all grade levels on the state’s suite of standardized tests, the Alabama Comprehensive Assessment Program (ACAP).
The tests are given in the spring to students in public schools statewide, grades 3-8.
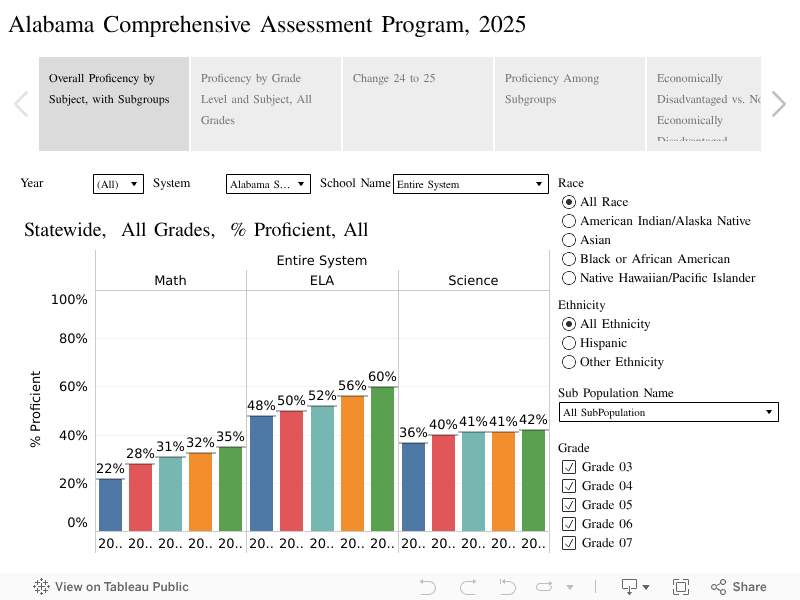
Across all grades, 60% of students tested proficient in English Language Arts (ELA), 42% of students scored proficient in science, and 35% in Math.
Figure 1. Average proficiency levels of all grades, all subjects, compared by year. Reference bar indicates state average.
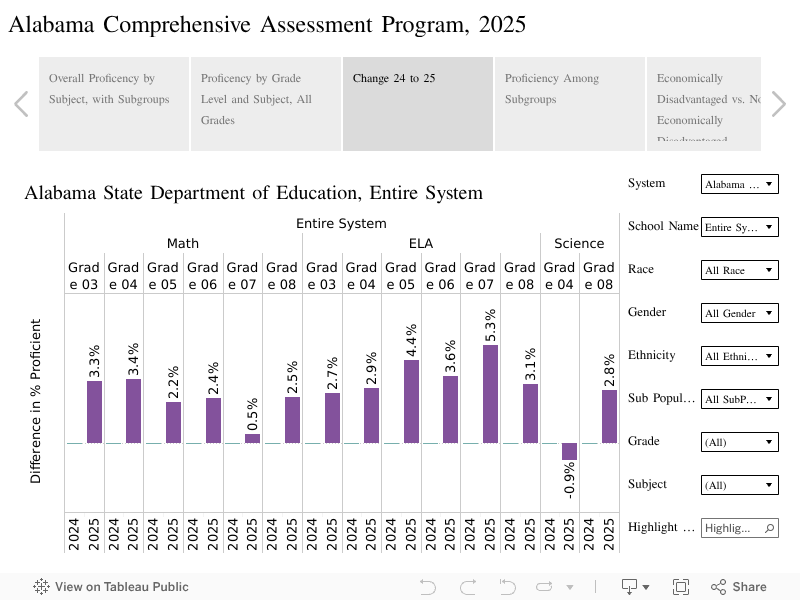
The percentage of students scoring proficient climbed at every grade level except for 4th-grade science, where the percentage of proficient students declined by one percentage point.
Figure 2. Average proficiency levels, all grade levels, all subjects, compared by year. Reference bar indicates state average.

The strongest gains were in 3rd and 4th-grade math, where the proficiency rate increased more than three percentage points, and in 7th-grade ELA, which climbed more than five percentage points. Fifth-grade ELA also showed a higher percentage gain, climbing more than four percentage points.
Figure 3. Change in proficiency in all grades, all subjects, compared by year
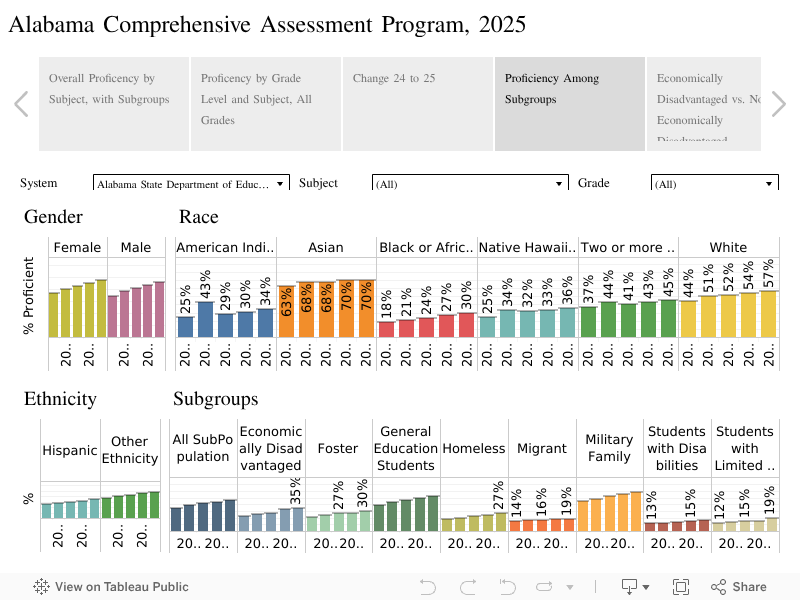
Proficiency rose across all demographic subgroups, though score gaps between racial, ethnic, and economic subgroups remain wide.
Figure 4. Comparison of average proficiency, by subgroup, by year
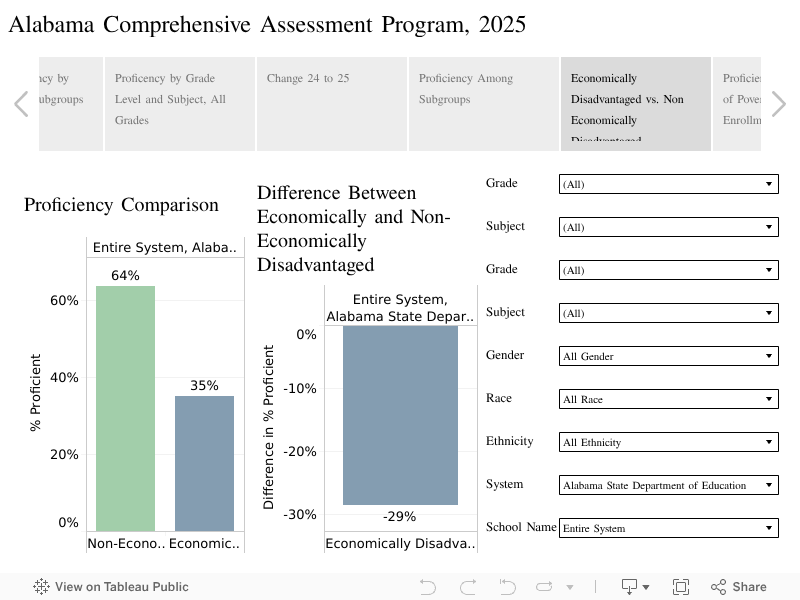
Across all grades and subjects, the average proficiency rate for students from economically disadvantaged backgrounds was 29 percentage points lower than for other students.
Figure 5. Comparison of proficiency rates, 2025, economically disadvantaged and non-economically disadvantaged students
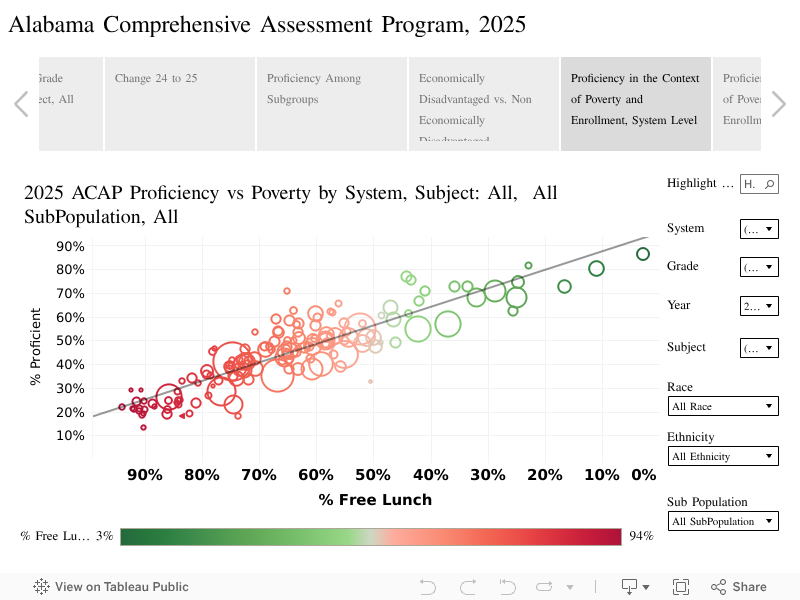
Because of that score gap, comparisons between schools or systems should always consider the levels of economic disadvantage of the schools in the comparison. In general, schools and systems with higher rates of economic disadvantage have lower average proficiency rates. However, systems with similar rates of economic disadvantage can have very different proficiency rates. Systems above the line of prediction in Figure 6 are performing better than average, considering the system’s level of economic disadvantage.
Figure 6. Poverty vs. Proficiency, Alabama public school systems, all subjects, all grades
Using the tabs and menus in the visualizations, you can focus on systems, schools, subjects, and grade levels of interest.