Huntsville and Baldwin Continue Population Gains, Birmingham Remains in Top 50 of U.S. Metros

The Huntsville area and Baldwin County continue to add more new residents, while growth in Shelby County and St. Clair County helped the Birmingham Metro Area return to positive growth after two years of population loss. That’s according to new estimates of population change in U.S. counties and metro areas published by the U.S. Census Bureau. The new estimates identify population totals and components of population change as of July 1, 2023.

Printable PDF available here

In addition to the growth in Shelby and St. Clair, Birmingham’s metro population got a boost from an accounting change. In the 2022 estimates, the Birmingham-Hoover MSA ranked No. 50 in population among metropolitan areas and seemed destined to fall out of the top 50 metro areas.

However, in 2023, Walker County was re-added to the Birmingham metro, which boosted the Birmingham MSA population by almost 65,000 and allowed it to climb to the 47th most populous metropolitan area.

Metro areas are clusters of counties where a significant percentage of the population moves back and forth across county lines for work and commerce. According to the most recent data, about 26% of Walker County’s resident workforce commuted to work in Jefferson County or other counties in the MSA. That’s above the 25% threshold that triggers inclusion in the MSA. Walker was historically part of the MSA.

Consisting of 7 counties with a population of 1.2 million, Birmingham is the state’s largest metro area. Huntsville’s MSA, comprised of Limestone and Madison Counties, is second with 527,254.

Trends

As observed in the PARCA’s analysis of state-level estimates released earlier this year, the decline in deaths related to the Covid-19 pandemic improved baseline conditions for population growth. In the 2021 and 2022 estimates, deaths far outnumbered births. In 2023, the number of deaths in Alabama continued to drop, though, due to an aging population and lower birth rate, deaths still outnumbered births.

International immigration to Alabama remains low, but domestic immigration continues to accelerate, according to the estimates. Alabama netted 30,744 new residents through domestic in-migration in 2023, building on an upward trend.

Domestic in-migration is powering population growth in hot spots like Madison, Limestone County, and Baldwin, as well as in suburban counties around Birmingham and Montgomery. In the latter cases, the central county is losing population while suburban counties gain. Across Alabama, 38 of the 67 counties are seeing more people moving into the county than moving out.

Calhoun and Etowah counties, home to Anniston and Gadsden, respectively, are showing population growth after years of decline. Mobile County also grew, breaking a streak of decline. In fact, all of the state’s metro areas posted population gains except for the Columbus, GA—Metro Area, which includes Phenix City and Russell County.

Rural counties, particularly in Alabama’s Black Belt, continued to lose population. The biggest drop in percentage terms was Bullock County, where the population declined by 2.4%, or 246 residents, according to the estimates. Hale County was the exception to the Black Belt trend. Hale added 289 residents, which amounts to a 2% population increase in a year.

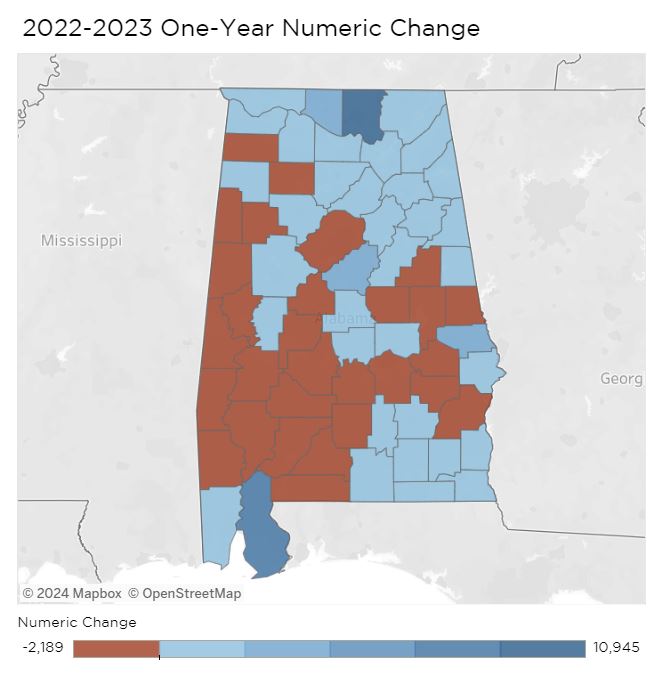
In numeric terms, Jefferson County lost the most people, with a decline of 2,186. That is less of a loss than in 2021 or 2022. Deaths were down, births were up, resulting in a positive natural change of 394. International migration added 818, a slight increase over the year before. However, domestic migration remained a drain, with 3,417 more people moving out of the county than moved in, according to estimates.

Montgomery County also continues to see significant domestic outmigration, but a slight rise in international migration and births and a drop in deaths helped offset the outmigration. Montgomery County’s population has decreased by 1,321. Autauga, Elmore, Chilton, and Lee counties grew.

Mobile County grew with a smaller net decline in domestic migration, a slight increase in international migration, and a return to positive natural change (more births than deaths). According to the estimates, Mobile County posted a net addition of 242 residents.

Next-door neighbor Baldwin County added 6,976 people, mostly because of people moving to the coastal county. In percentage terms, the Baldwin County metro area, officially the Daphne-Fairhope-Foley MSA, grew faster than any of the state’s other metro areas.

However, the Huntsville MSA netted the most new residents, with Madison County adding 8,995 and Limestone County adding 3,786. Adjacent North Alabama counties like Lauderdale, Morgan, Marshall, Jackson, Lawrence, and Cullman grew.

The Dothan-area Wiregrass counties also saw population growth, as did counties on the Alabama-Georgia Border like Cleburne, Randolph, and Cherokee.  

Most counties bordering Mississippi lost population. The median age in rural counties tends to be higher, which correlates with higher death rates.

Those counties also tend to experience more people moving out than moving in.

Use the tabs and menus to explore the estimates for counties and metros you are interested in. If you want to see how Alabama compares with the rest of the United States, visualizations of the population estimates and change are available for counties and metros across the country.

Similar stats are available for metro areas as well. Use the controls to zoom in on areas of interest.


Revisiting PARCA’s Annual Forum

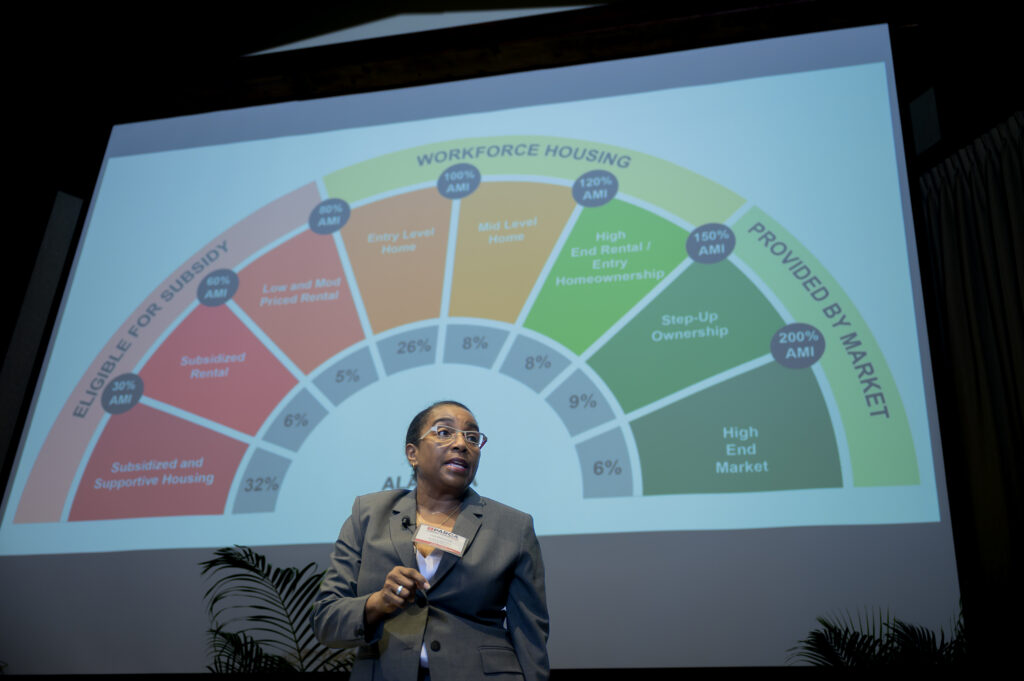
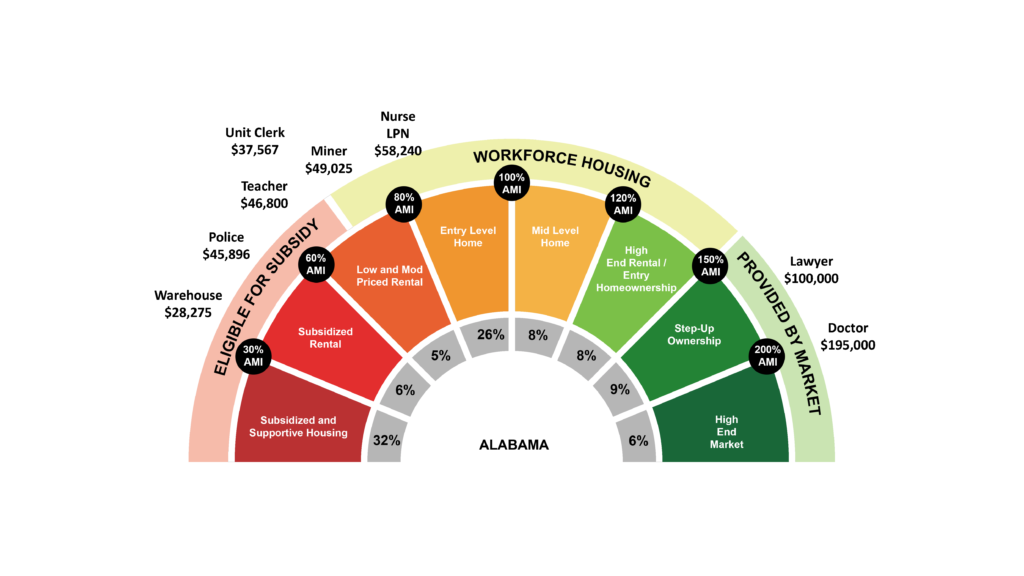
Housing inventory continues to fall, and prices continue to rise. Pressures on the housing market ripple across the economy but may have the most significant impact on middle-income workers – those earning between 80% and 120% of the median income. As housing prices increase, middle-income workers often struggle to live where they work. The shortage of affordable housing complicates hiring and threatens our economic health and community vitality. 

See links to Forum resources below

For example, while median income in Alabama is $60,000. The median home sale price in January was $263,000, one of the largest gaps in our history. Likewise, the Alabama median income supports rent of $1,240, but average rent for a three-bedroom apartment in Alabama is $1,500.

These challenges were the focus of PARCA’s 2024 Annual Forum: Housing Alabama’s Workforce.

The March 7 event welcomed over 300 state and local leaders gathered at the Harbert Center on March 8 to consider these issues and hear an address from Governor Kay Ivey.

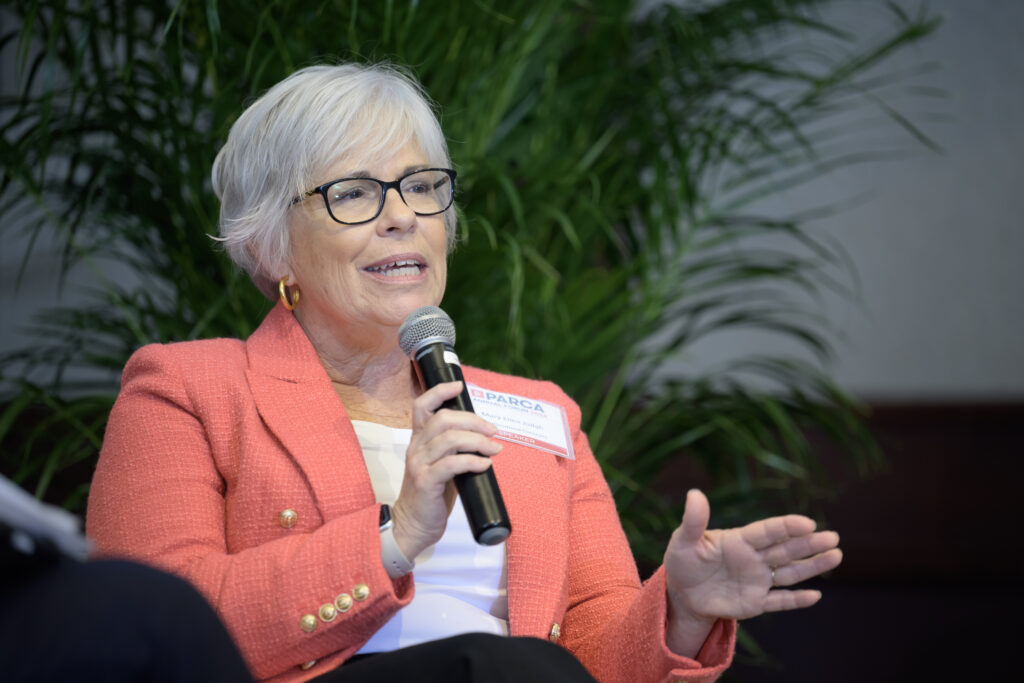
Guiding the discussion were Lisa McCarroll of Navigate Housing Partners, Amanda Loper of David Baker Architects, Terry Harbin of Affordable Homes Gulf Coast, Mary Ellen Judah of Neighborhood Concepts, Cory Stallworth of the City of Birmingham, and James Stockard from the Harvard University School of Design.

The speakers explored the housing challenges facing the state’s middle-income workers—those vital to the economy and well-functioning communities, such as teachers, nurses, and first responders.

Lisa McCarroll made the point well, noting that some 40% of Alabamians may qualify for some type of subsidized housing. Another 44% do not qualify, but earn far less than necessary to afford market rate housing.

Amanda Loper offered examples of creative housing around the county that is both affordable and builds community.

Terry Harbin, a for profit developer Mobile, Mary Ellen Judah, Executive Director of the Huntsville-based nonprofit, Neighborhood Concepts, Cory Stallworth of the City of Birmingham, shared their differing approaches to addressing the shortage of workforce housing.

They highlighted the fact that federal tax credits for developing affordable housing in Alabama are restricted to one per county. And currently, Alabama has no state credit, though one has been introduced in the Legislature this session.

Jim Stockard challenged the audience with a series of questions to consider, including:

What are the types of publicly owned sites that might lend themselves to housing construction in Alabama cities?

Where are the existing market rate apartment buildings in your cities that might be re-purposed as mixed income complexes that could serve the workforce in their cities

What should the state allow or even  mandate in terms of local zoning ordinances?

What level of assistance might cities or the state be willing to provide to assist households in becoming homeowners? 

Encouraged

Attendees noted they were encouraged to know there are people in Alabama working to address these concerns and that there are actually new things that the state can do.

More than 80% of surveyed attendees reported no, slight, or only moderate knowledge of housing policy before the event–and 90% of those same attendees reported the event improved their knowledge of the topic.

Governor Albert Brewer Memorial Lunch

Governor Ivey addressed the audience as part of the Governor Albert Brewer Memorial Lunch

Forum Resources

Annual Forum Program, including housing policy glossary, resources, and data

Why Housing? Ryan Hankins

What is Workforce Housing? Lisa McCarroll

Innovations Around the Country Amanda Loper

Opportunities in Alabama Panel

What is Possible? James Stockard


Alabama Public Opinion Survey

PARCA’s most recent public opinion survey finds, once again, aversion to certain taxes, support for public education, and mistrust in state government. At the same time, the survey finds a lack of consensus on how the state should respond to other critical issues.

Among the findings:

  • Alabamians continue to rank education as the most important state government activity.
  • Large majorities of Alabamians say the state spends too little on education and healthcare.
  • Alabamians have an aversion to taxes but say upper-income residents pay too little.
  • Alabamians are willing to pay more taxes to support education but do not agree on which taxes should be increased.
  • A plurality (48%) of Alabamians would prefer to educate their children in public schools.
  • A majority of Alabamians support school choice options.
  • A large majority believe private schools receiving state funds should meet all standards required of public schools.

PARCA’s annual public opinion survey was conducted between October 24 and December 26, 2023. The mixed-mode sample includes a mix of respondents from a statewide random digit dialed (RDD) sample of cell and landline numbers and an Internet panel provided by Qualtrics. The poll of over 500 Alabama residents was conducted by Dr. Randolph Horn, Samford University, Assistant Vice President for Enrollment Research and Professor of Political Science. 

Results of the survey indicate many opportunities for officials to demonstrate responsiveness to public concerns and leadership in crafting public policy solutions.

Download the full report here.


More Students Workforce Ready in the Class of 2023

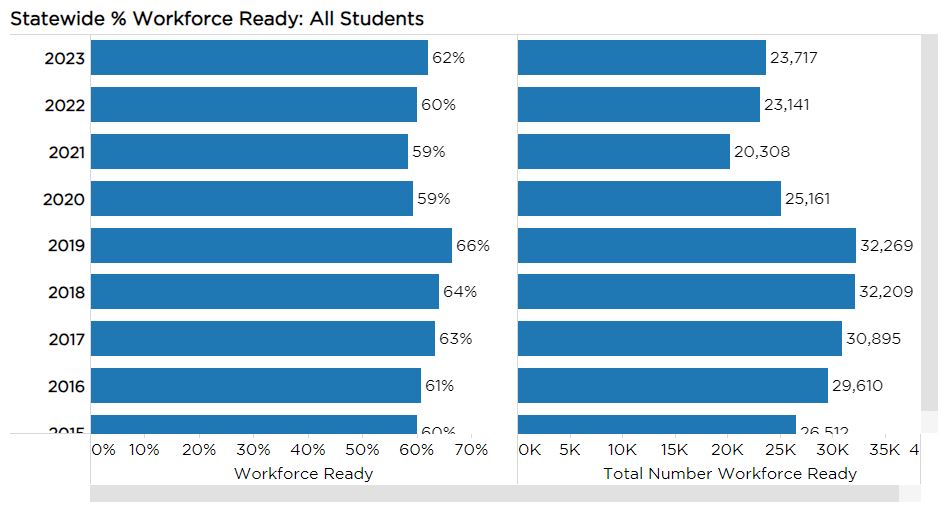
The number and percentage of high school seniors graduating workforce-ready rose with the Class of 2023, according to the results of ACT’s WorkKeys Assessment, a test of skills given to public high school seniors. The results are another sign that student performance is recovering from post-pandemic lows, though the recovery is not complete.

Printable PDF available here.

The WorkKeys test measures practical math, reading, and graphical literacy skills as they are employed in the workplace. That’s different than the ACT, which tests for knowledge and skills needed in a college classroom. In 2023, 72% of seniors took the test statewide, and 62% of those tested scored at or above the silver level of workforce readiness.

Figure 1. WorkKeys Results, Statewide Trends

WorkKeys is optional, and school systems vary in the percentage of students tested. WorkKeys was given to all seniors through 2019, but the State Department of Education stopped mandating the test. Some systems still test all seniors. Some systems make the test an option for students who haven’t demonstrated college and career readiness by another measure. WorkKeys is one of seven options for demonstrating college and career readiness.

Figure 2. Numbers and percentages of participation and passing the workforce-ready benchmark

In addition, a student’s score on WorkKeys can be a recognized credential in the job market. Some businesses, particularly industrial employers, build WorkKeys into their hiring practices. Working with ACT, those employers have determined what level of proficiency, as measured by WorkKeys, is needed in particular jobs. Depending on their test performance, students earn a platinum, gold, silver, or bronze National Career Readiness Certificate. A student scoring Silver or above has the foundational skills for 67% of jobs that ACT has profiled, and that student is considered college and career-ready by the Alabama Board of Education.

Figure 3. Percentage of all students workforce ready (scoring Silver or Above), by system, 2023 (Pictured are systems in which 90% of students were tested. Adjust filter to see other systems)

In Figure 3, the school systems are shaded by the percentage of economically disadvantaged students in each system. In general, systems with higher poverty percentages tend to have lower percentages of students scoring workforce ready. However, on WorkKeys, the correlation is not nearly as strong as it is with other measures, like the ACT college readiness test. WorkKeys seems to provide a more even playing field for comparative performance.

However, the 2023 WorkKeys test results do show a pattern similar to other assessments in the wake of the Covid-19 pandemic. After dropping in 2020, 2021, and 2022, WorkKeys results rebounded more strongly among nonpoverty students in 2023. In contrast, students from low-income backgrounds have been slower to recover to pre-pandemic levels.

Figure 4. Percentage Workforce Ready by School, 2023

The visualization below presents the results in a more detailed fashion. Each color represents the percentage of tested students scoring at each level: platinum, gold, silver, bronze, and no certificate earned. Use the menus to adjust the comparison and use the various tabs, to explore different aspects of the data.

Figure 5. WorkKeys Results, by level of certification, by system, 2023

Alabama ACT Scores Climb

ACT Scores for Alabama public high school students improved in 2023, bucking a downward trend nationally and providing another clue that Alabama schools began recovering from the Covid-19 pandemic more quickly than schools nationally. Students in the graduating class of 2023 were in ninth grade when the COVID-19 pandemic reached the U.S.

Printable PDF Document Available Here

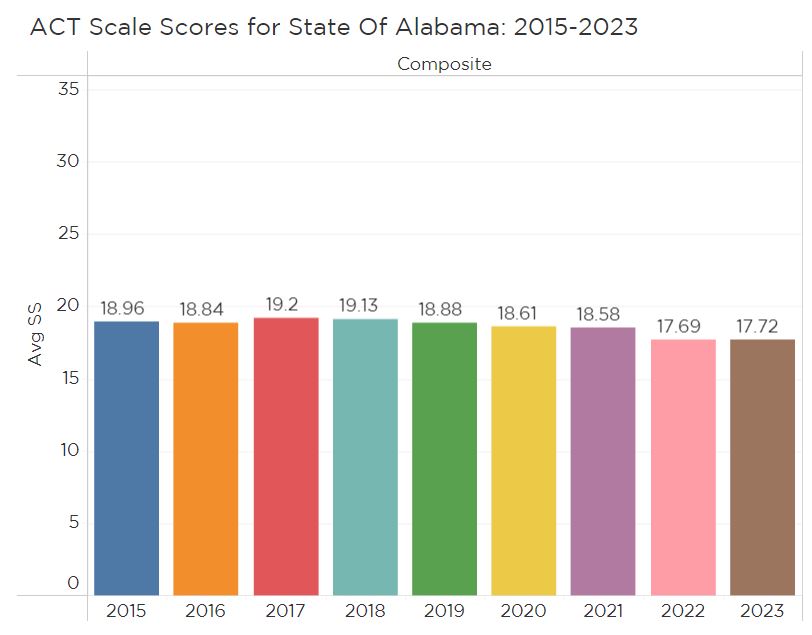
Figure 1. Alabama Public High School Average Composite Scores, 2015-2023

Alabama’s Class of 2023 still trailed the score levels of classes tested prior to the academic disruptions wrought by COVID-19. The average composite score in 2023 was 17.72 on the ACT’s 36-point scale, up from 17.69 in 2022 but down from 18.58 in 2021.

The percentage of test-takers who achieved ACT’s college-ready benchmark in all four tested subjects – English, reading, science, and math – climbed to 12.8%. According to ACT, students scoring at or above the benchmark on a subject test have a 50% chance of earning a B in an introductory college course in the subject and a 75% chance of earning a C.

Figure 2. Percentage of students scoring at or above the college-ready benchmark in 2023, by subject

The scores of students from low-income households fell further during the pandemic and have not recovered to the same extent as students from non-poverty households.

The percentage of non-poverty students who were college-ready in reading was higher in 2023 than in the graduating Class of 2020. In English and science, the non-poverty students in the Class of 2023 had nearly closed the gap. In math, non-poverty students still have some catching up to do.

In comparison, the percentage of economically disadvantaged students who scored college-ready in 2023 remains significantly lower than pre-pandemic levels.

Figure 3. Comparing Poverty and Non-poverty Students’ College Ready Percentage, by subject, by selected years

Compared to other states

Nationally, a shrinking percentage of students of students were college-ready in 2023. In all four subject areas, the percentage of students scoring at or above the college-ready benchmark was the lowest in recent history. The average Composite score declined by 0.3 points, from 19.8 in 2022 to 19.5. Immediately before the pandemic, the U.S. average ACT composite score was 20.7 in 2019. While Covid led to sharp drops in scores, the national average score on the ACT has been trending down for several years. In 2017 and before, the national average composite was 21.

Comparing Alabama’s average composite score to the national average isn’t appropriate because of the difference in the universe of test-takers in different states. All Alabama public high school students take the ACT. In many states, only college-bound students take the test. Other states focus on the SAT instead, leaving only a small portion of students to take the ACT.

Looking strictly at the states where 100% of students took the test, the average composite score was 18.3, compared to Alabama’s 18 (When it comes to state-to-state comparisons, ACT provides a different state average than the data strictly focused on Alabama public school students).

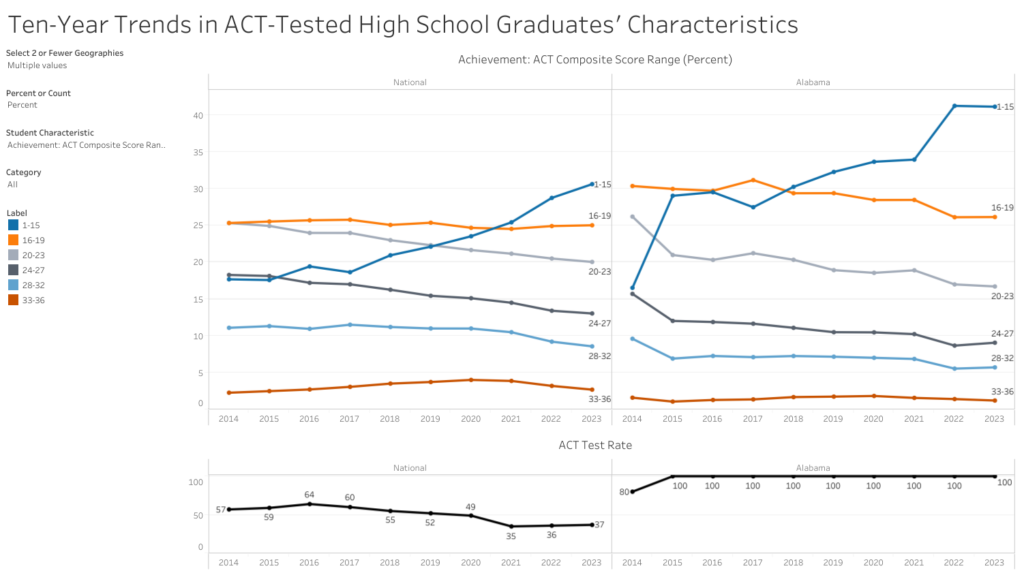
Data provided by ACT and accessible through ACT’s online dashboard indicates that White students in Alabama have caught up to and scored at the same average as White students in other 100% states. However, Black and Hispanic students in Alabama haven’t regained as much ground. There also appears to have been a steep jump in the percentage of students scoring in the lowest ranges of the test. The percentage of Alabama students who scored 15 or below jumped from 34% to 41% during the pandemic.

Figure 4. Trends in the percentage of ACT test-takers in score ranges US vs. Alabama

Focus on Alabama Scores

Alabama students’ average scores improved in reading, English, and science but not math.

Figure 5. Trends in scale scores by subject

System Level Results

At the school system level, systems with a higher proportion of non-poverty students post higher average scores. Systems with a higher concentration of poverty post lower average scores.

Using the menu options on the right of the visualization, you can adjust variables to see the data through different lenses. Figure 6 presents the average scale score of non-poverty students in each system. Applying this different lens helps identify high-performing systems where higher poverty percentages might affect overall performance. More than half of the students in systems like Brewton, Huntsville, Haleyville, Jasper, and Demopolis are economically disadvantaged. But the Non-poverty students in those systems post average scores that rank them in the top 20 of school systems,

Figure 6. Non-poverty student’s average scores, by system

Meanwhile, Figure 7 compares the average scale score of economically disadvantaged students attending the various systems. Again, this different lens reveals a different set of high-performing schools. More than 40% of students in Satsuma, Saraland, Arab, and Oneonta are economically disadvantaged, and yet economically disadvantaged students there score higher than the all-students average statewide. Economically disadvantaged students make up more than half the student body in Brewton and Winfield, but despite that concentration, the system average for students in poverty ties or beats the state all-student average.

Figure 7. Economically Disadvantaged Students’ Average scores, by system

Examining results at the school level is also important for identifying high performance. Figure 8 presents the average scores of Black students by school. The highest average scores are found in Montgomery, Birmingham, and Huntsville magnet schools.

Figure 8. Black students’ average scores, by school

Use the menus and tabs to explore data on your own, find your school or system, and make comparisons keeping in mind student body socioeconomic composition. Available data options include: