Despite Headwinds, Alabama Gains in 4th Grade Reading and Math
Alabama 4th-grade students performed better in both reading and math between 2019 and 2022, leading to improved national rankings for Alabama on The Nation’s Report Card, the National Assessment of Educational Progress (NAEP). That progress came despite the pandemic, which took a heavy toll on academic performance nationwide. Nationally, NAEP scale scores recorded their worst drops ever.
Alabama was the only state where 4th graders improved in math performance. It was one of only five states to see improvement in Grade 4 reading. Only Louisiana had a higher gain in 4th-grade reading.
To be clear, Alabama’s average scale score gain in both reading and math was not large enough to be considered statistically significant, but, when compared to sizeable scale score declines in many other states, the shift was notable. Alabama’s 8th-grade scale scores were down in reading and math, though, in the case of math, because Alabama lost less ground than other states its national rank improved.
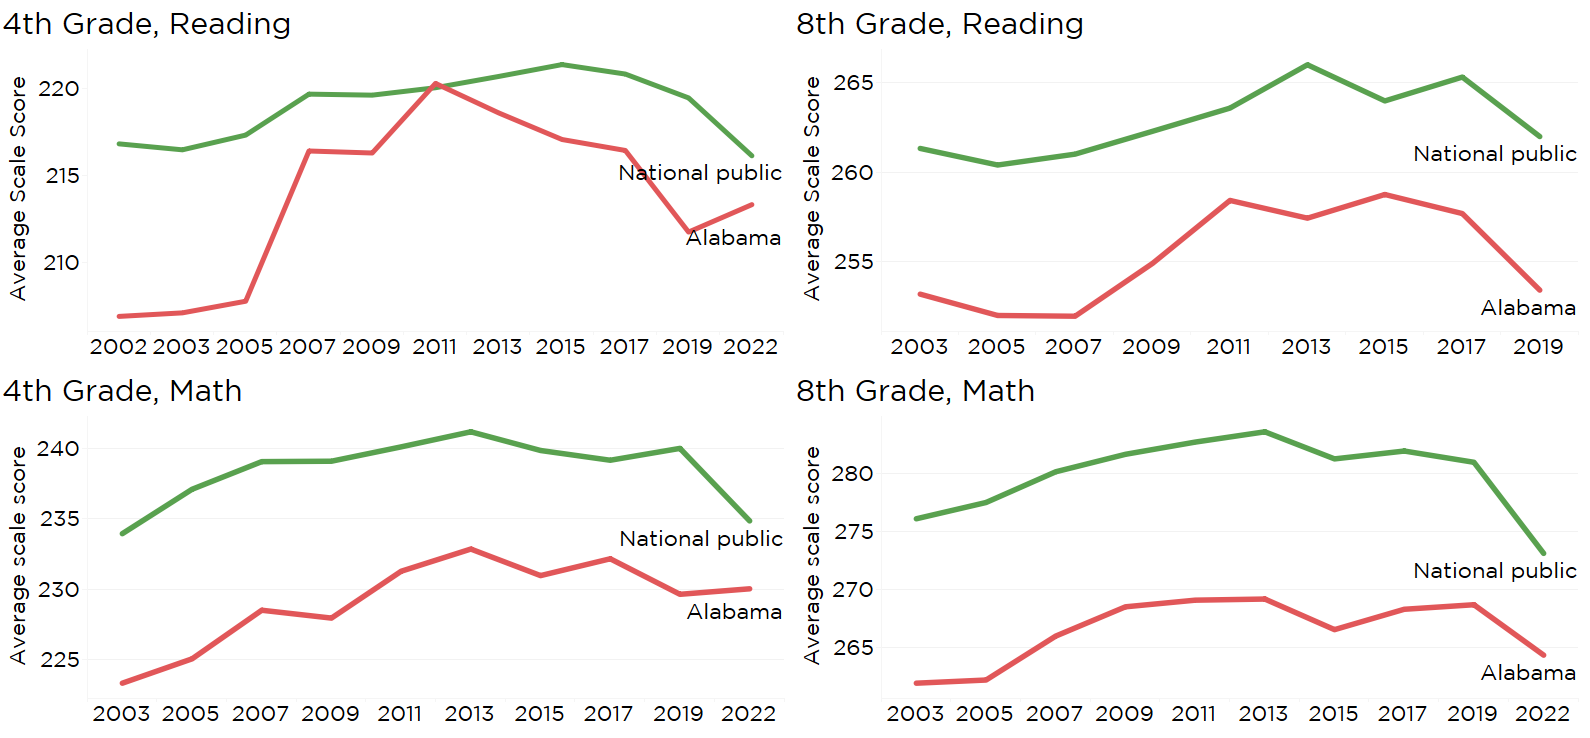
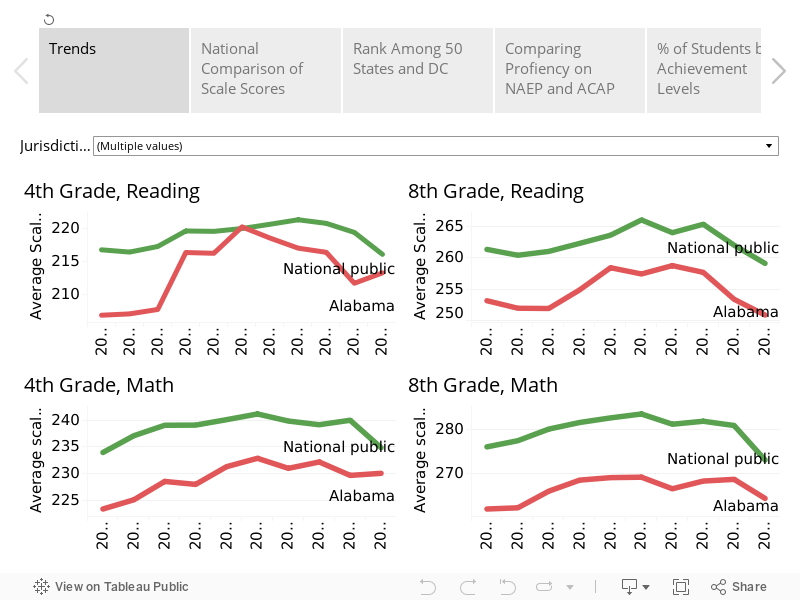
Figure 1. NAEP Performance over time, Alabama vs. U.S.
NAEP results are derived from standardized tests given to a representative sample of students in each state. The most recent test was administered in the spring of 2022. The NAEP is the only assessment that is given in every state and thus provides comparative information across the nation.
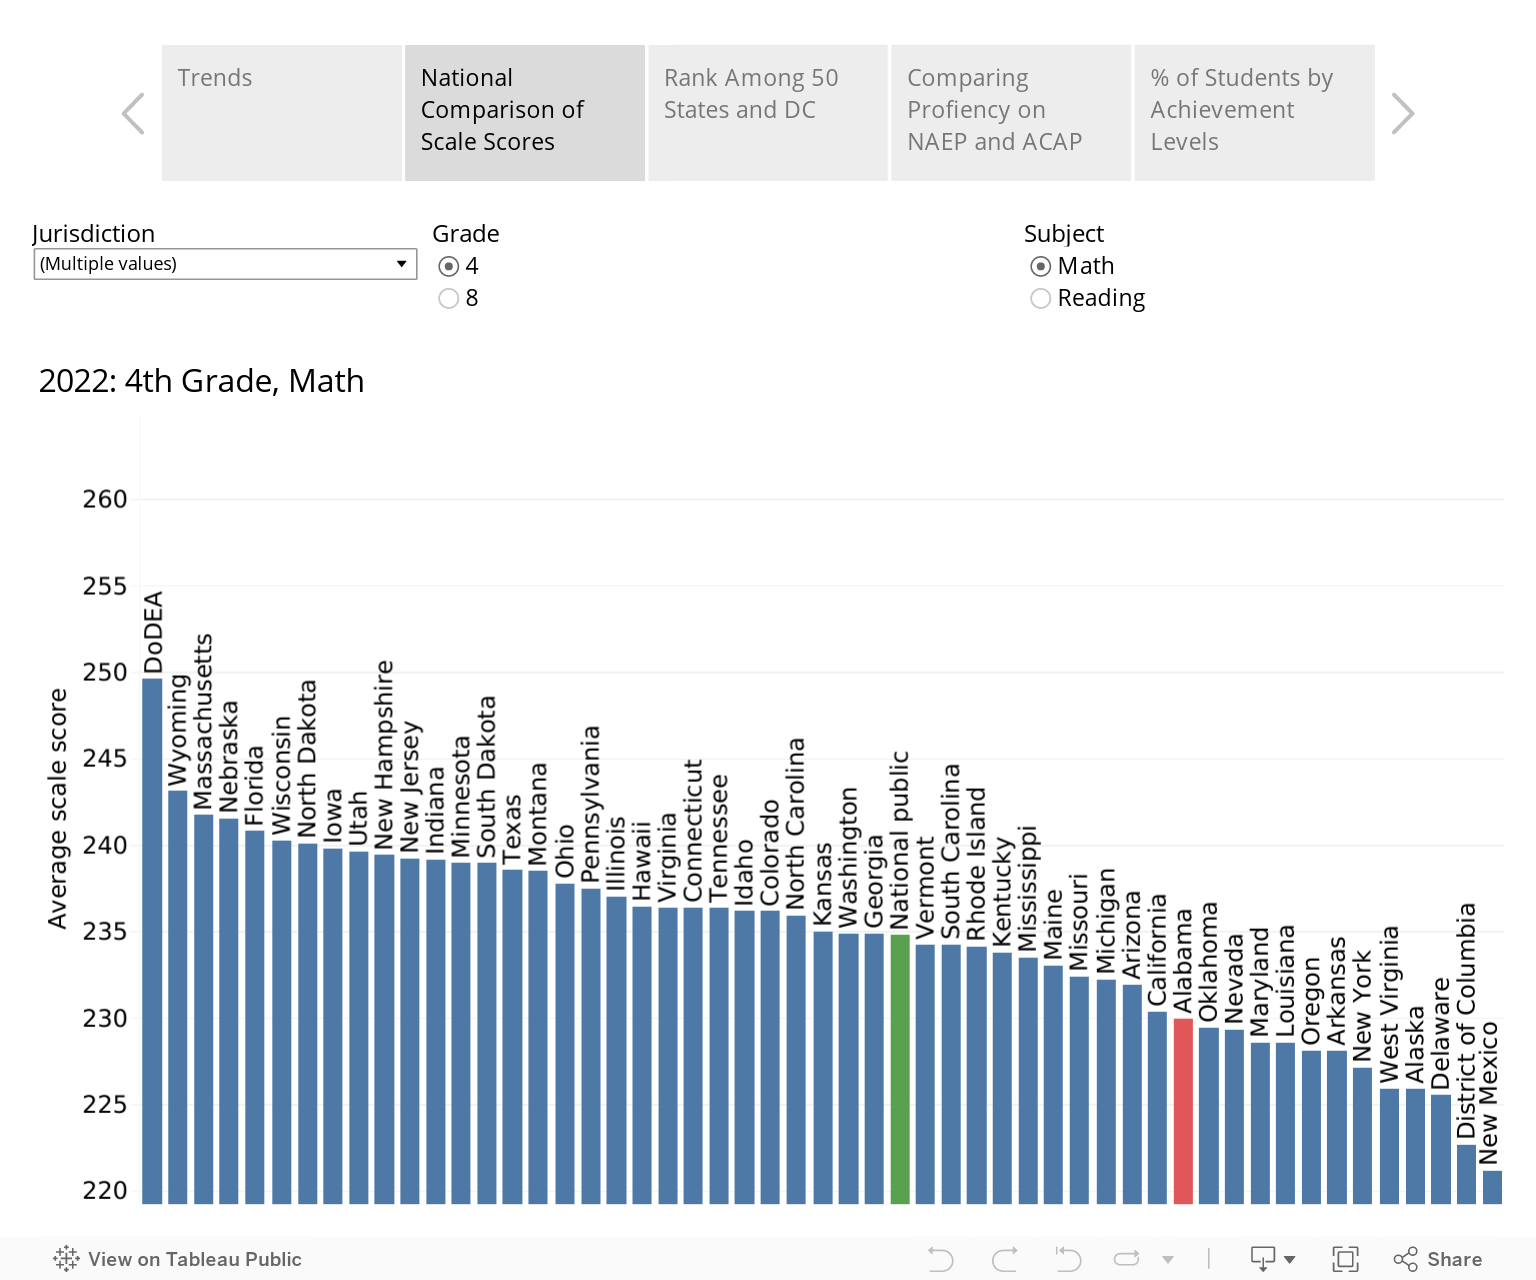
Figure 2. Average NAEP scale scores for U.S. States, 2022. Menus change views by grades and subject
Similar findings from state-level assessments
In a separate analysis of state-level assessment data, Alabama’s results have gotten national attention. An analysis produced by educational researchers and shared with al.com showed that Alabama school districts showed greater stability and improvement from 2019 to 2022 than schools in much of the rest of the country.
Since 2003, Alabama students have ranked at or near the bottom in math on the NAEP in both grades tested, 4th and 8th. In reading, Alabama 4th graders had improved enough to meet the national average by 2011 but drifted downward in subsequent years. Alabama 8th-grade reading scores have been in the bottom five consistently.
In 2019, Alabama 4th graders ranked No. 51 in math compared with students in other states and the District of Columbia. In 2022, Alabama 4th graders ranked 39th. In reading, Alabama 4th grade student performance rose from 48 to 38.
Average scale scores for Alabama 8th graders declined in both reading and math. However, other states experienced steeper drops in math, so Alabama’s rank climbed from 51 to 46. In 8th-grade reading, Alabama maintained its rank of 48 out of 51.
Figure 3. Scale score rank of states, by grade and subject
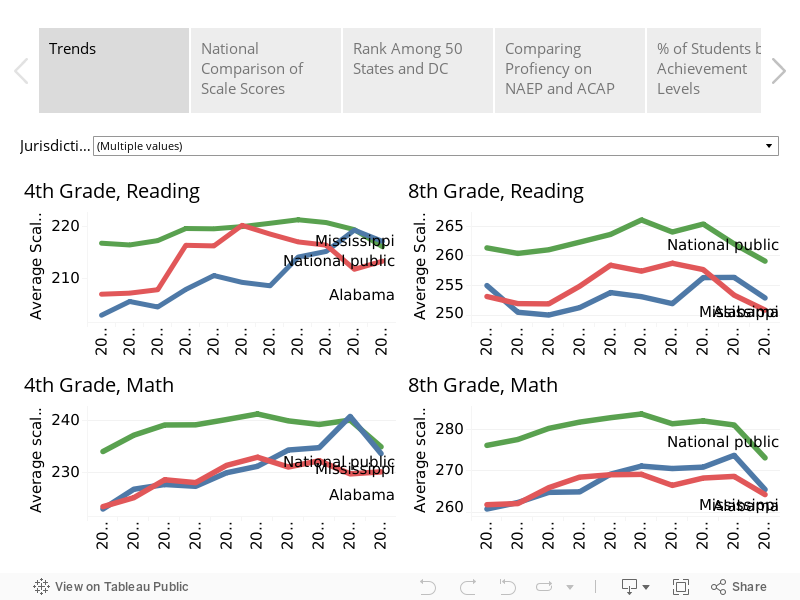
The improvements in 2022 indicate some progress, but Alabama has a long way to go before it is providing a nationally competitive education to all students. In the 2022 results, students in Mississippi once again scored ahead of Alabama in both reading and math at both grade levels. Alabama did close that gap with Mississippi in math and in 4th-grade reading, but the gap widened in 8th-grade reading.
Figure 4. Alabama, Mississippi, and U.S. NAEP scores compared
Results coincide with investments
The positive results coincide with the recent infusion of money and effort in early grades reading. The Alabama Literacy Act in 2019 was accompanied by increased funding for the Alabama Reading Initiative (ARI). ARI provides professional development and support for teachers. The state also requires a dedicated reading coach to work with K-3 teachers. The coach and teachers monitor reading data, identify struggling readers, and provide enhanced support. That includes providing services from specialists trained to diagnose and work with children with learning challenges like dyslexia.
In math, Alabama realigned its math standards in 2019, with one of the aims being to align better with national expectations represented by the NAEP. The Alabama Math and Science and Technology Initiative (AMSTI) also altered its tactics, allowing it to reach more schools and teachers. Extra federal relief money also allowed some districts to hire math coaches to work with teachers. In 2022, the Alabama Legislature passed the Alabama Numeracy Act, which provides increased funding and calls for a strategic approach to improving math performance, borrowing some of the approaches deployed to support literacy.
While the gains on the NAEP in 4th-grade reading and math might not be statistically significant, those results mirror improvements Alabama students posted on the Alabama Comprehensive Assessment Program (ACAP), the state’s standardized test. Compared to 2021, the state saw gains, particularly in early grades mathematics.
Comparing NAEP to Alabama’s test of proficiency
Alabama has administered several different achievement tests over the past decade, which leads to confusion about how Alabama students are performing. Complicating the picture is that the different tests, including the NAEP, have different measures of proficiency. Figure 5 compares the results of the 2022 NAEP with the results of the ACAP, also given in the spring of 2022.
The results of both tests are expressed in terms of the percentage of students who scored proficient or above on the tests.
The bars in red represent the percentage of Alabama students scoring proficient on the NAEP and on the ACAP at both grade levels and in both subjects.
The green bars present the percentage of students in the U.S. that scored proficient on the NAEP.
Figure 5. Scores from Alabama’s ACAP vs. NAEP, 2022, by subject and grade
Comparing NAEP and ACAP results, it is apparent that Alabama’s ACAP English Language Arts assessment is much more generous when it comes to grading student proficiency in English.
In contrast, ACAP produces results similar to NAEP’s in math.
Except for the ELA scores on the ACAP, both tests indicate that only somewhere around 20-30% are reaching proficiency. The National Assessment Governing Board sets proficiency levels and describes them as follows: “Students performing at or above the NAEP Proficient level on NAEP assessments demonstrate solid academic performance and competency over challenging subject matter.” They specify that the NAEP Proficient achievement level does not represent “grade level proficiency” as determined by other state assessment standards.
Figure 6 presents three levels of achievement on the NAEP: the percentage of Alabama students scoring “at or above Basic,” the percentage scoring “at or above Proficient,” and the percentage of students scoring “Advanced.”
Figure 6. Percentage of Alabama Students at each NAEP Achievement Level, 2003-2022
In 4th grade reading and math, students today are ahead of where they were a decade ago: a greater percentage of students are scoring above basic, above proficient, and at the advanced levels.
In 8th-grade math, there has been some progress, while 8th-grade reading gains seen in 2015 and 2017 have fallen away substantially.
Conclusion
The NAEP and the ACAP have provided evidence that Alabama educators and students can improve even in challenging circumstances. The investment and attention to early grades reading and mathematics need to be sustained and accelerated. Alabama has a long way to go to catch the national average or even our neighboring state, Mississippi.
But even as further gains are pursued for younger learners, Alabama needs to find ways to sustain learning gains into middle and high school. The erosion in proficiency in the middle grades could have lasting negative effects in preparing students for high school, college, and careers.
A New Constitution Plus Additional Amendments on the Nov. 8 Ballot
Beyond the political contests on the November 8th ballot, Alabama voters will decide whether to adopt the Alabama Constitution of 2022, a recompiled version of the current constitution, as well as 10 statewide constitutional amendments. There will also be 19 other state constitutional amendments appearing on the ballots only in the county where those amendments apply.
Replacing the Alabama Constitution of 1901 has long been a goal of reformers. The current Constitution was adopted explicitly to guarantee White Supremacy in Alabama, by disenfranchising black and poor white voters, mandating segregated schools, and forbidding interracial marriage, among other provisions.
Such unconstitutional and repealed provisions will be gone from the Alabama Constitution of 2022. The constitution would also incorporate and reorganize the 978 amendments that have been made to the current constitution.
At the same time, the new constitution would preserve current law and practices that centralize power in the Legislature and require amendments to the state constitution for even mundane local matters. If the Alabama Constitution of 2022 is adopted, Alabama will still have the world’s longest constitution: more than three times the length of the next closest state.
PARCA’s new report, An Analysis of the Proposed Alabama Constitution of 2022 and the Statewide Amendments, details the proposal for the new constitution and the 10 amendments that will also be on ballots statewide.
As always, PARCA provides a high-level analysis of each statewide amendment. We study the ballot wording, but also the authorizing legislation behind the language. We do not make recommendations or endorsements, rather, we seek to understand the impact of the proposed changes and the rationales for them.
Demographic Change in Alabama, its Counties, and Cities, 2010-2020
Alabama’s population became more diverse over the past decade as the number of non-Hispanic Whites declined and more Alabamians identified as being of a different race, a mixture of races, or of Hispanic descent. In 2010, 67% of Alabama’s population identified as non-Hispanic White; By 2020, that percentage was down to 63%. That’s according to 2020 Census data released earlier this year.
The 2020 Census marked the first decennial census in history that either Alabama or the U.S. recorded a decline in the White population. Demographers expected a decline due to falling birth rates and the aging of the population, including the unusually large and predominately White Baby Boom population. Black, Hispanic, Asian, and American Indian populations all increased. But the biggest change was in the number of people identifying as More than One Race, indicating an erosion in traditional ethnic and racial distinctions.
The Census Bureau cautions that some portion of the decline in the “Non-Hispanic White alone” population is likely due to changes in how people responded to new wording on the race question. The Census Bureau changed the wording and presentation of the race question on the 2020 Census. In 2020, for the first time, the “White” choice was followed by example countries of origin in Europe, the Middle East, and North Africa. Similarly, the Black or African American option listed African and Caribbean nations as example origins. All respondents were asked to elaborate on their origins in a text box below their selection. This change from 2010 appears to have led more individuals to reclassify themselves as not being “White alone” but instead as being of more than one race or origin. Regardless, the Bureau believes the new totals present a more accurate picture of an increasingly diverse nation.
Nationally, the non-Hispanic “White alone” population decreased by 5 million or 2.6% from 2010 to 2020.
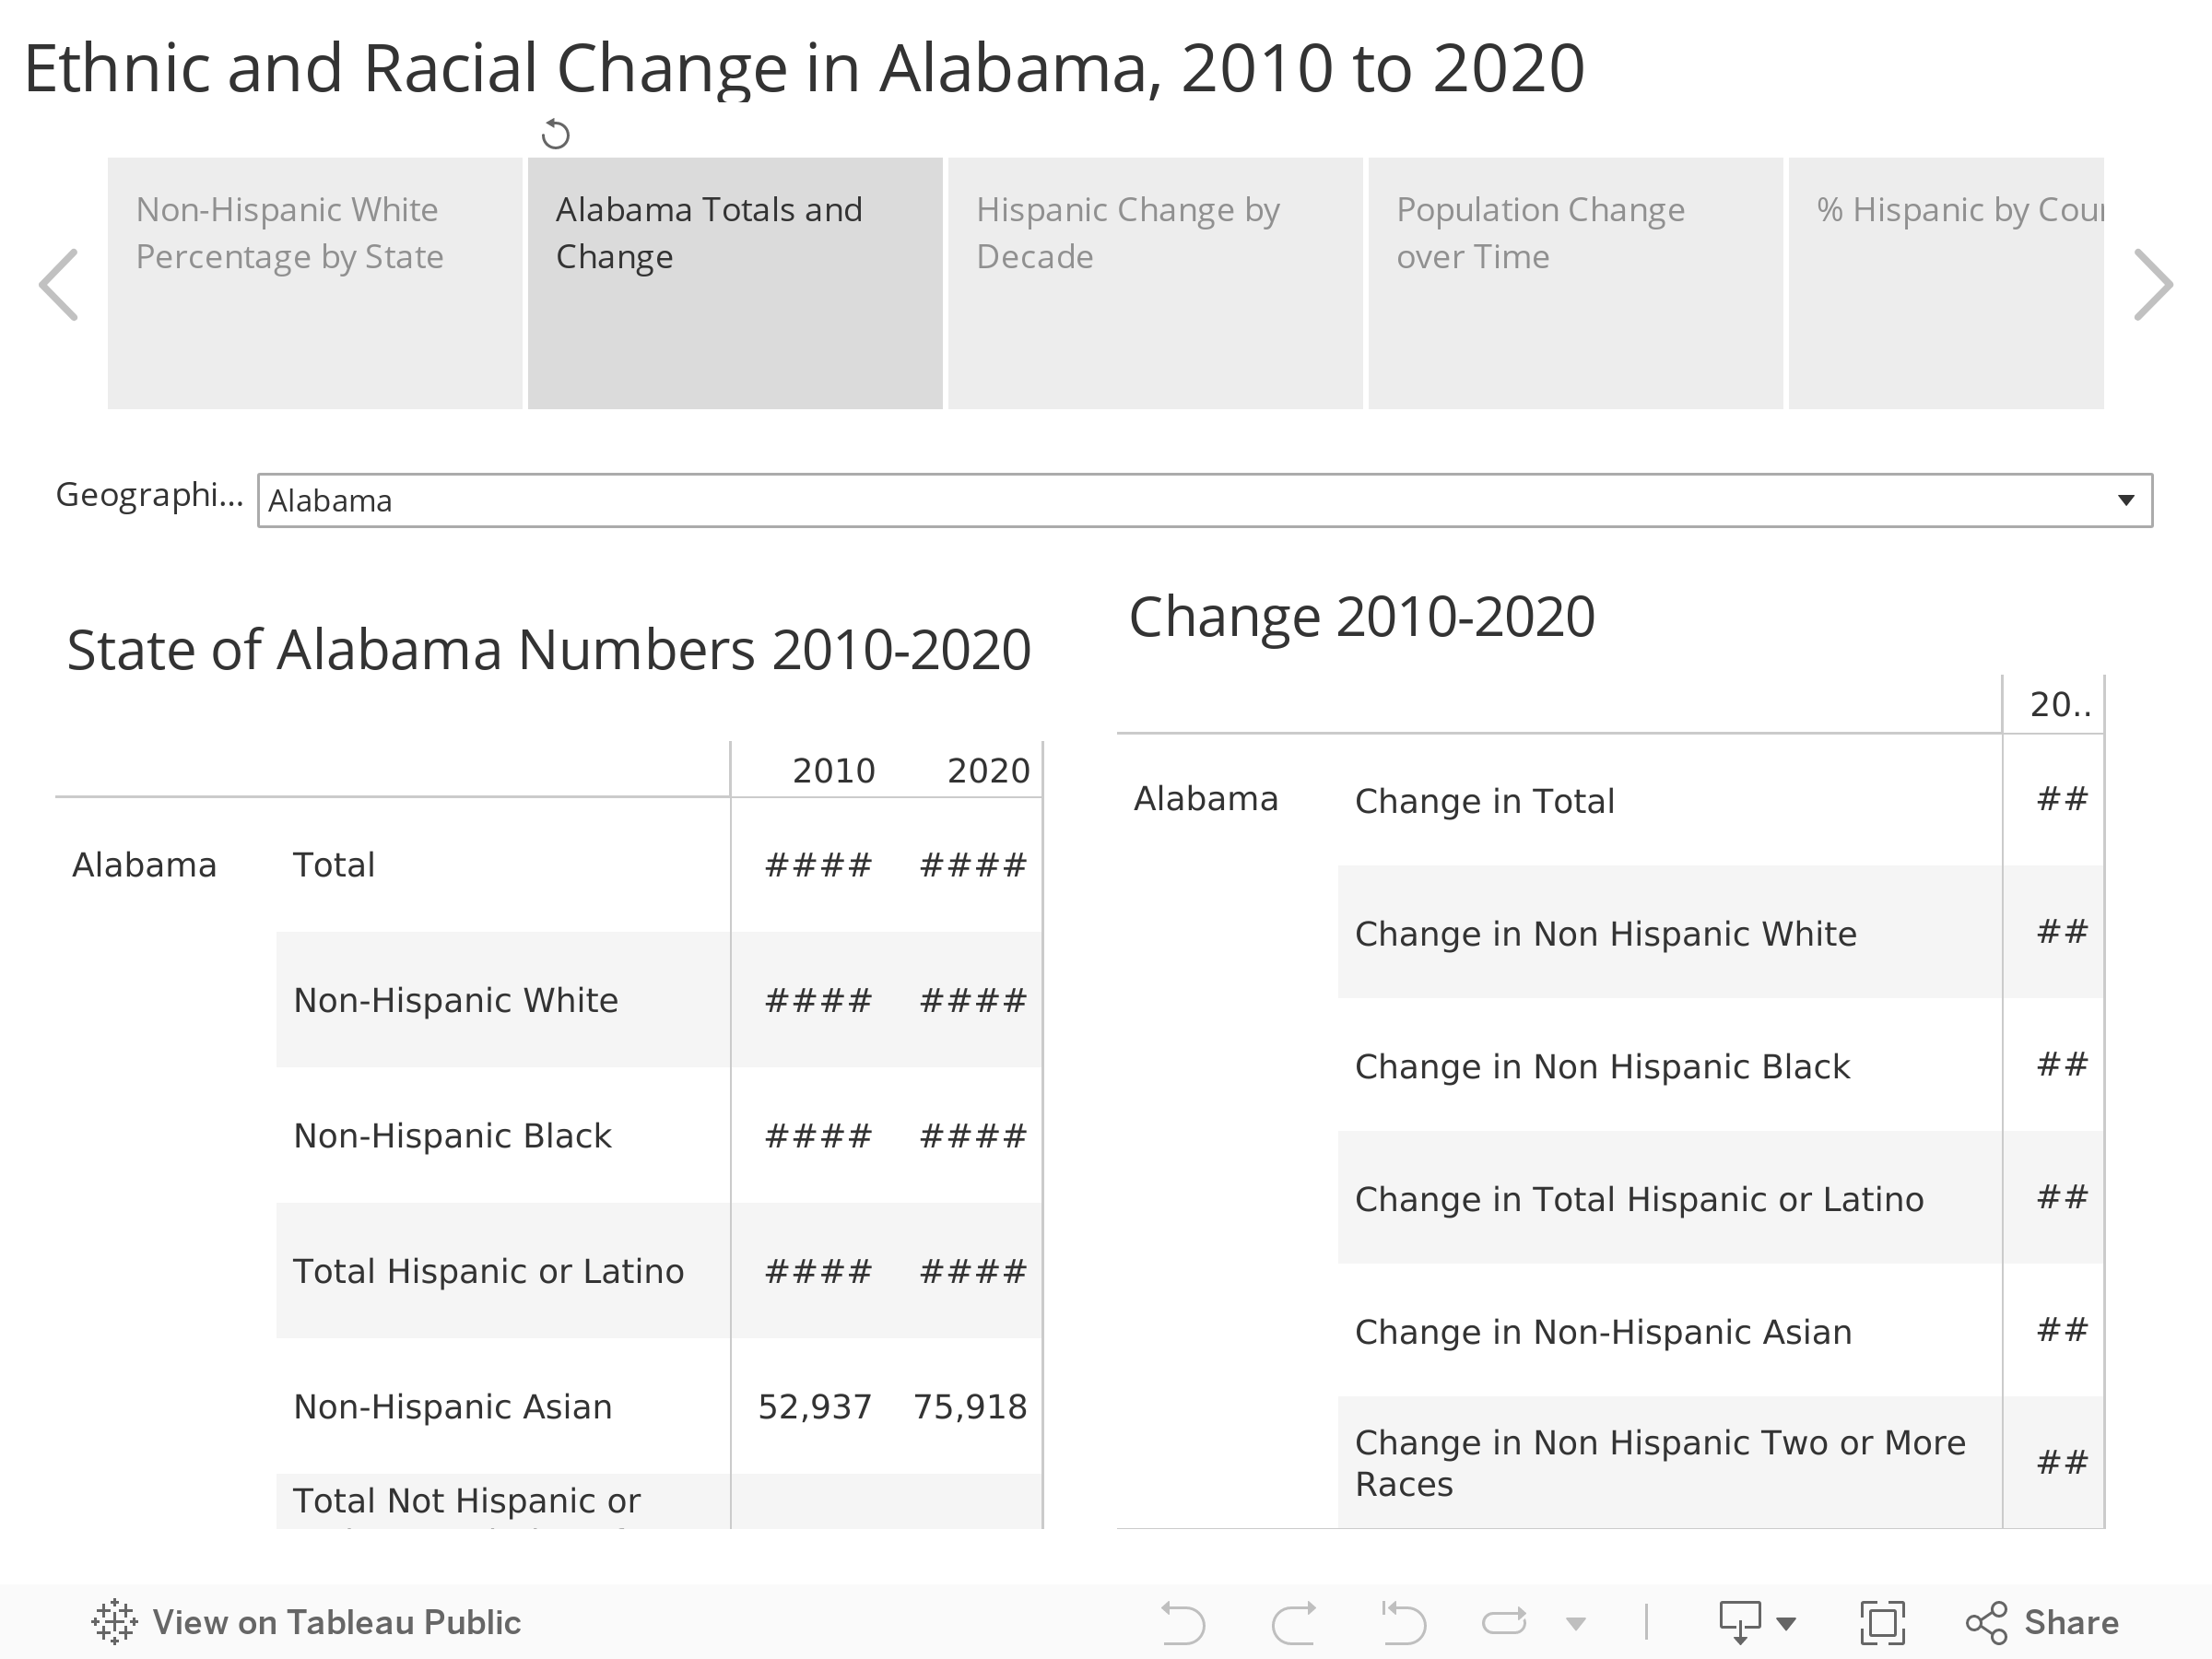
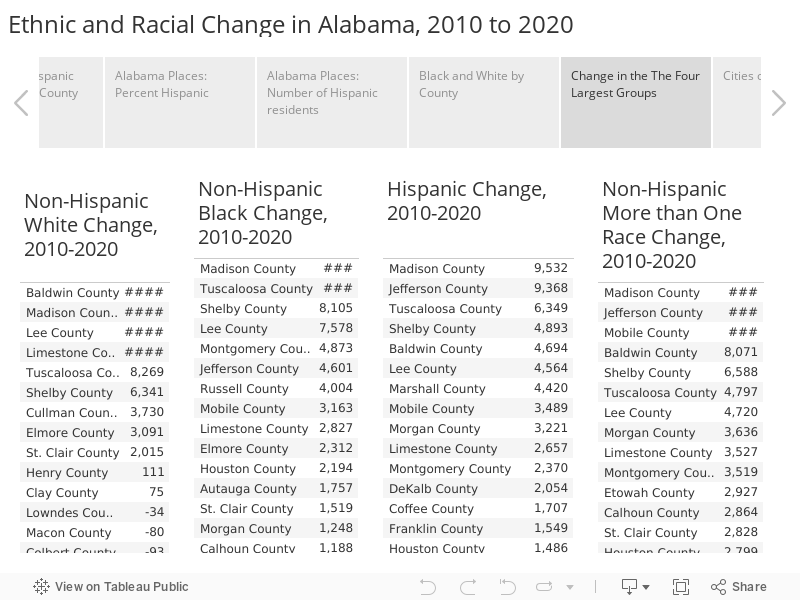
In Alabama, that population declined by 33,000, from 3.20 million to 3.17 million. Meanwhile, the number of people identifying as non-Hispanic and of more than one race far exceeded the increase in any other category, 124,173, compared to the 78,445 increase in the Hispanic population, the second fastest growing group. The number of non-Hispanic residents who reported themselves as White in combination with another race rose by 118,249, a 222% increase, from 53,260 to 171,509, from 1.2% of the population to 3.6%. The number of respondents who reported themselves as Black in Combination with another race also rose sharply, up 130% in Alabama, the third highest growth rate in the country in that category, a numerical increase of 38,767 over 2010.
Hispanics now make up 5.3% of the Alabama population, while non-Hispanic Blacks make up 25.6%. Non-Hispanic individuals of more than one race make up 3.7% of the population, now the fourth largest demographic group.
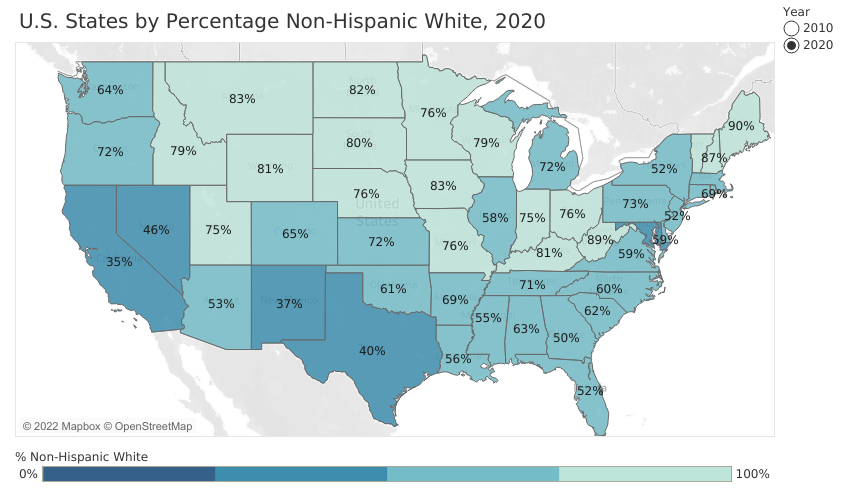
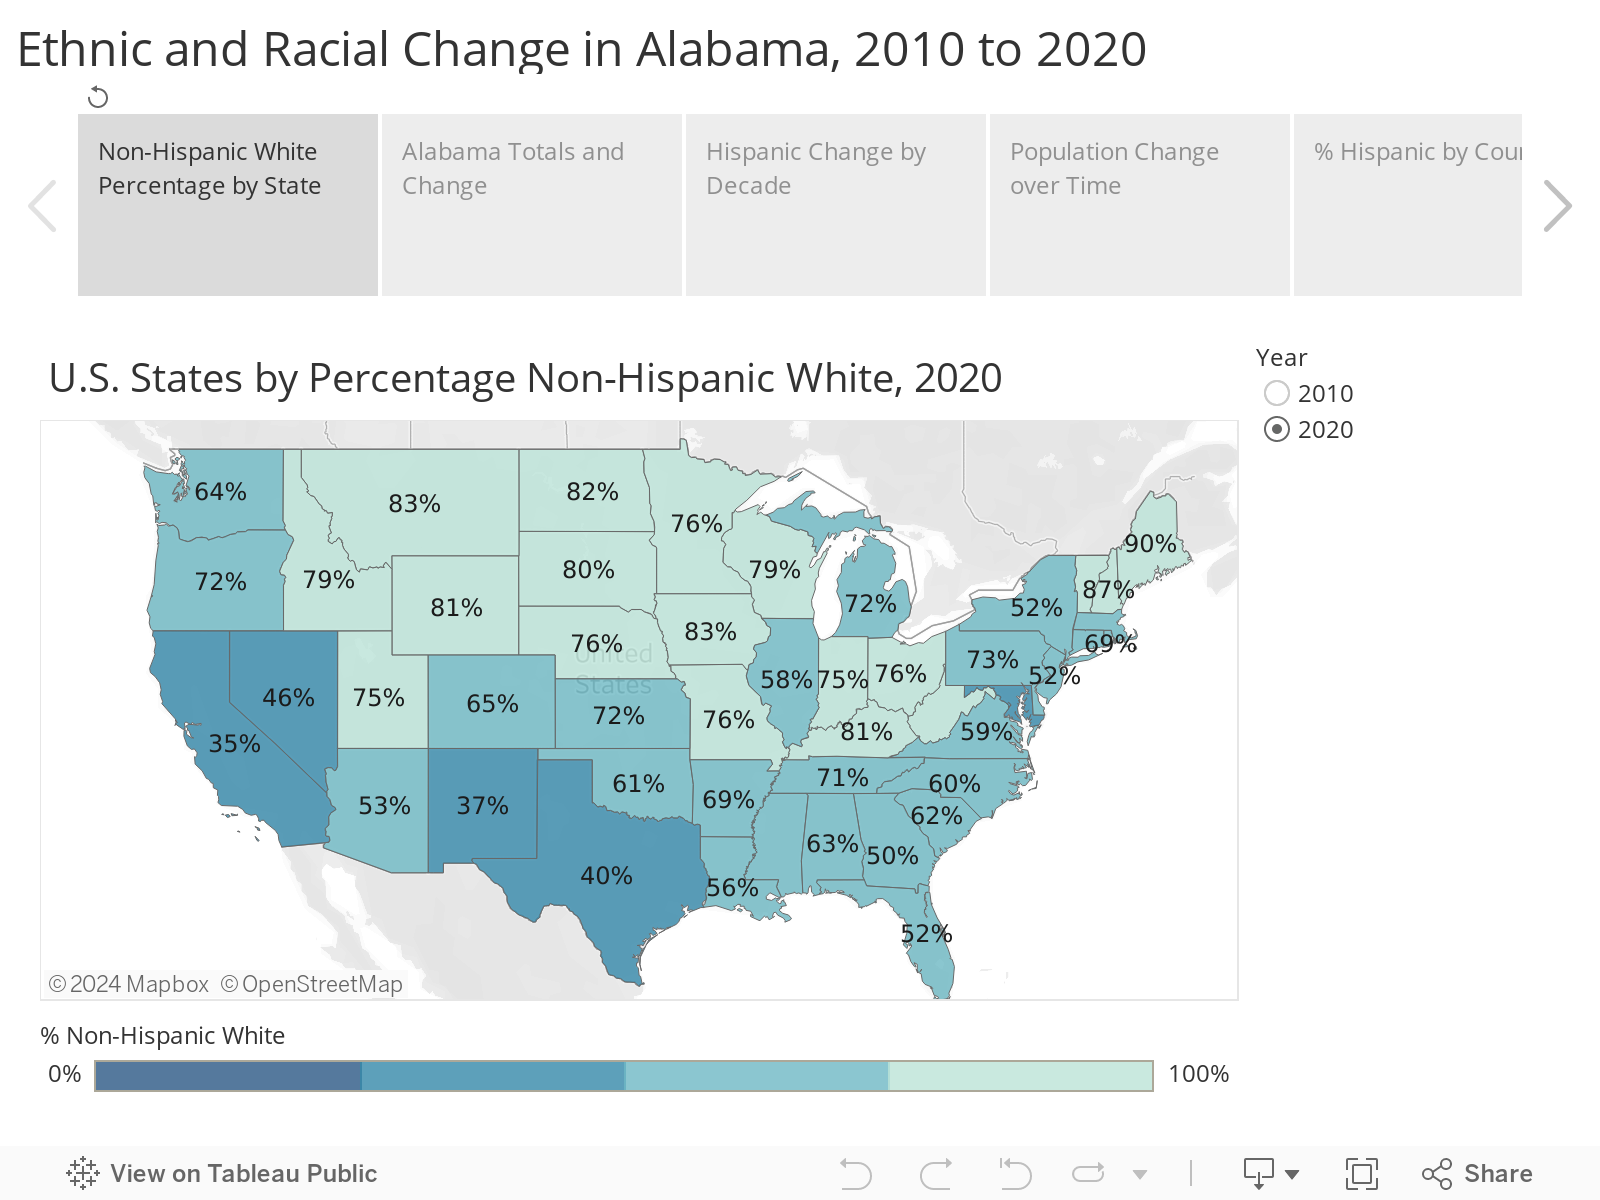
Both in Alabama and across the country, non-Hispanic whites remain by far the largest racial group representing 58% of the population nationally and 63% of the population in Alabama. Alabama’s non-Hispanic white population percentage ranks No. 30 among the states. The state with the highest share of its population identifying as non-Hispanic White was Maine at 90%, followed by West Virginia (89%), Vermont (89%), and New Hampshire (87%).
Hawaii has the lowest percentage of non-Hispanic whites, 22%, followed by California (35%), New Mexico (40%), and Texas (40%). Among its Southeastern neighbors, Georgia’s population in 2020 was 50% non-Hispanic white, while Florida’s was 52%. In all states besides Hawaii, non-Hispanic whites decreased as a percentage of the total state population.
Hispanic or Latino growth rate slows
Unlike the changes to the Census question on race, the question of whether or not the individual is of Hispanic or Latino origin has been consistent for several administrations of the Census. The official definition of “Hispanic or Latino” is a person of Cuban, Mexican, Puerto Rican, South or Central American, or other Spanish culture or origin, regardless of race.
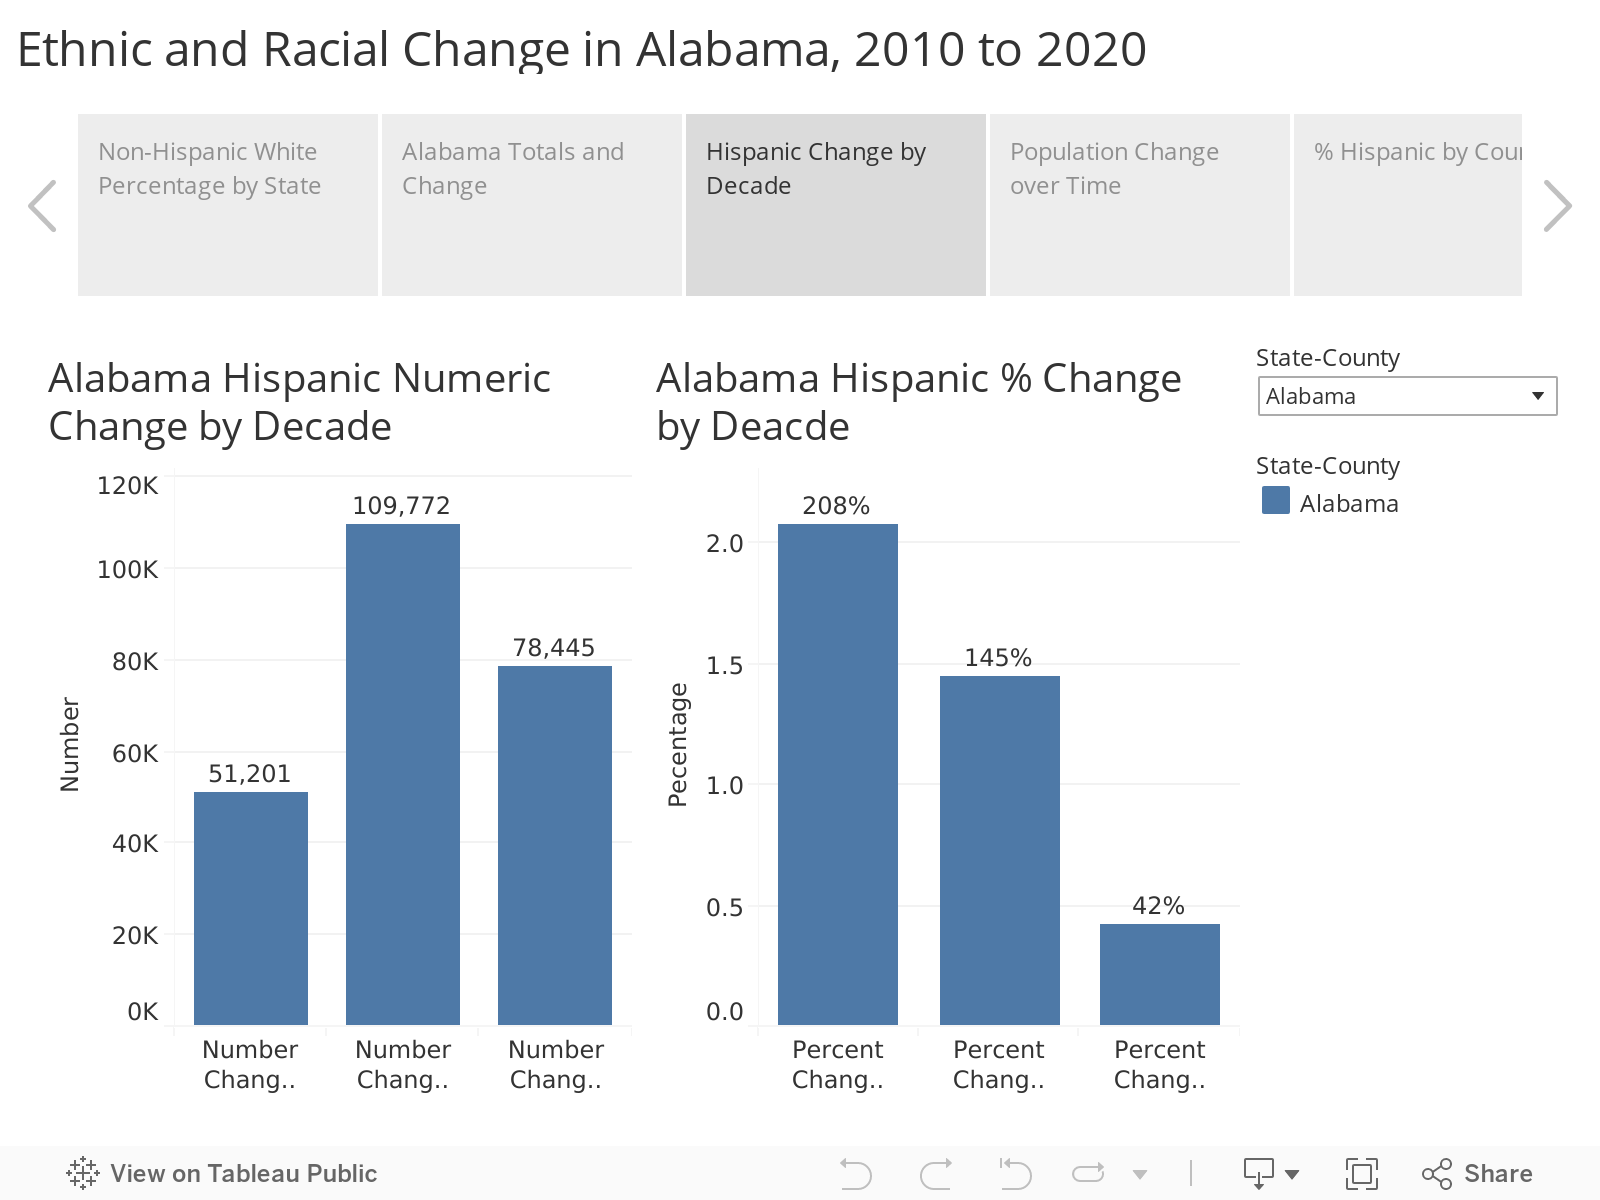
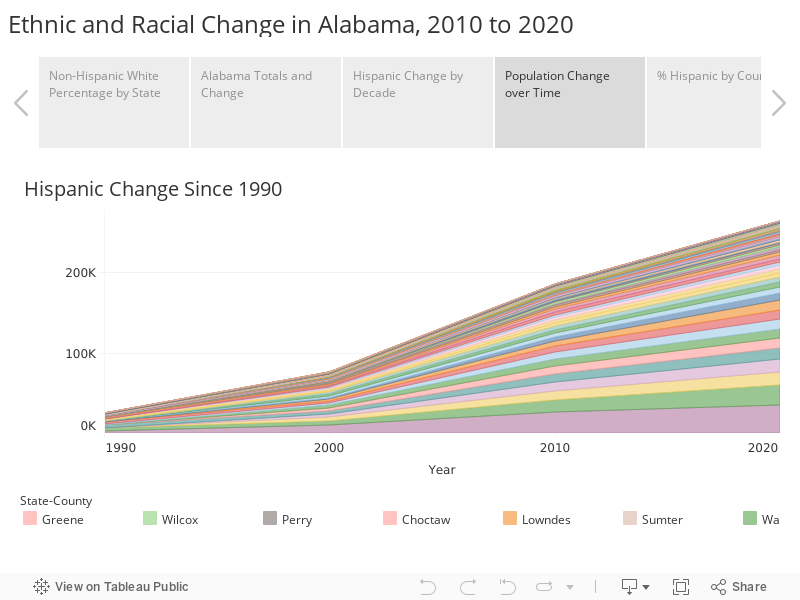
The number of Alabama residents identifying as Hispanic or Latino continued to grow between 2010 and 2020, but at a more modest pace than in previous decades. Alabama’s Hispanic population increased from 78,445 to 264,047, an increase of 42% over the course of the decade. In 2010, Hispanic or Latino individuals made up 3.9% of the Alabama population; by 2020, 5.3%.
The chart below presents decennial Census results from the U.S. Census Bureau supplemented with Census counts from the 2000 and 1990 Census analyzed by the Alabama State Data Center at the University of Alabama’s Center for Business and Economic Research.
Even without immigration, the Hispanic and Latino population will likely continue to grow more rapidly than the non-Hispanic White population because Hispanics are younger and more likely to be of child-bearing age.
The median age of non-Hispanic Whites in Alabama is 43. The median age among Hispanics is 25. Over 8% of the Alabama population under 18 is Hispanic compared to less than 2% of the population 55 and above.
Also, Hispanic mothers have a higher total fertility rate than other demographic groups. The Total Fertility Rate is the number of births that a hypothetical group of 1,000 women would have over their lifetimes. Reducing that rate to an average per female, Hispanic females average 1.9 children over a lifetime, Blacks, 1.7; for Whites, 1.5.
Demographers calculate the replacement level, the rate of births it would take to replace any given generation, to be 2.1 children per female. Generally, since the 1970s and consistently since 2008, the U.S. birth rate has been below replacement level, meaning that, absent immigration, the population will eventually decrease because not enough children are being born to replace the previous generation.
Hispanic and Latino individuals are widely dispersed across the state, appearing in every county. Much of the Hispanic population growth likely came from natural increase, state residents giving birth, rather than new immigration. For Alabama, the Census Bureau estimated that 57% of all population growth came from natural increase, 32% from international immigration, and 11% from domestic migration.
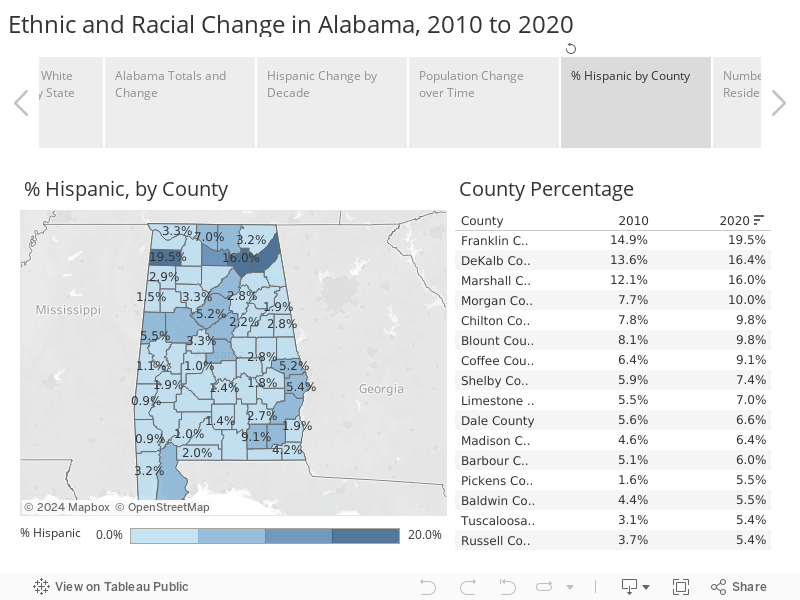
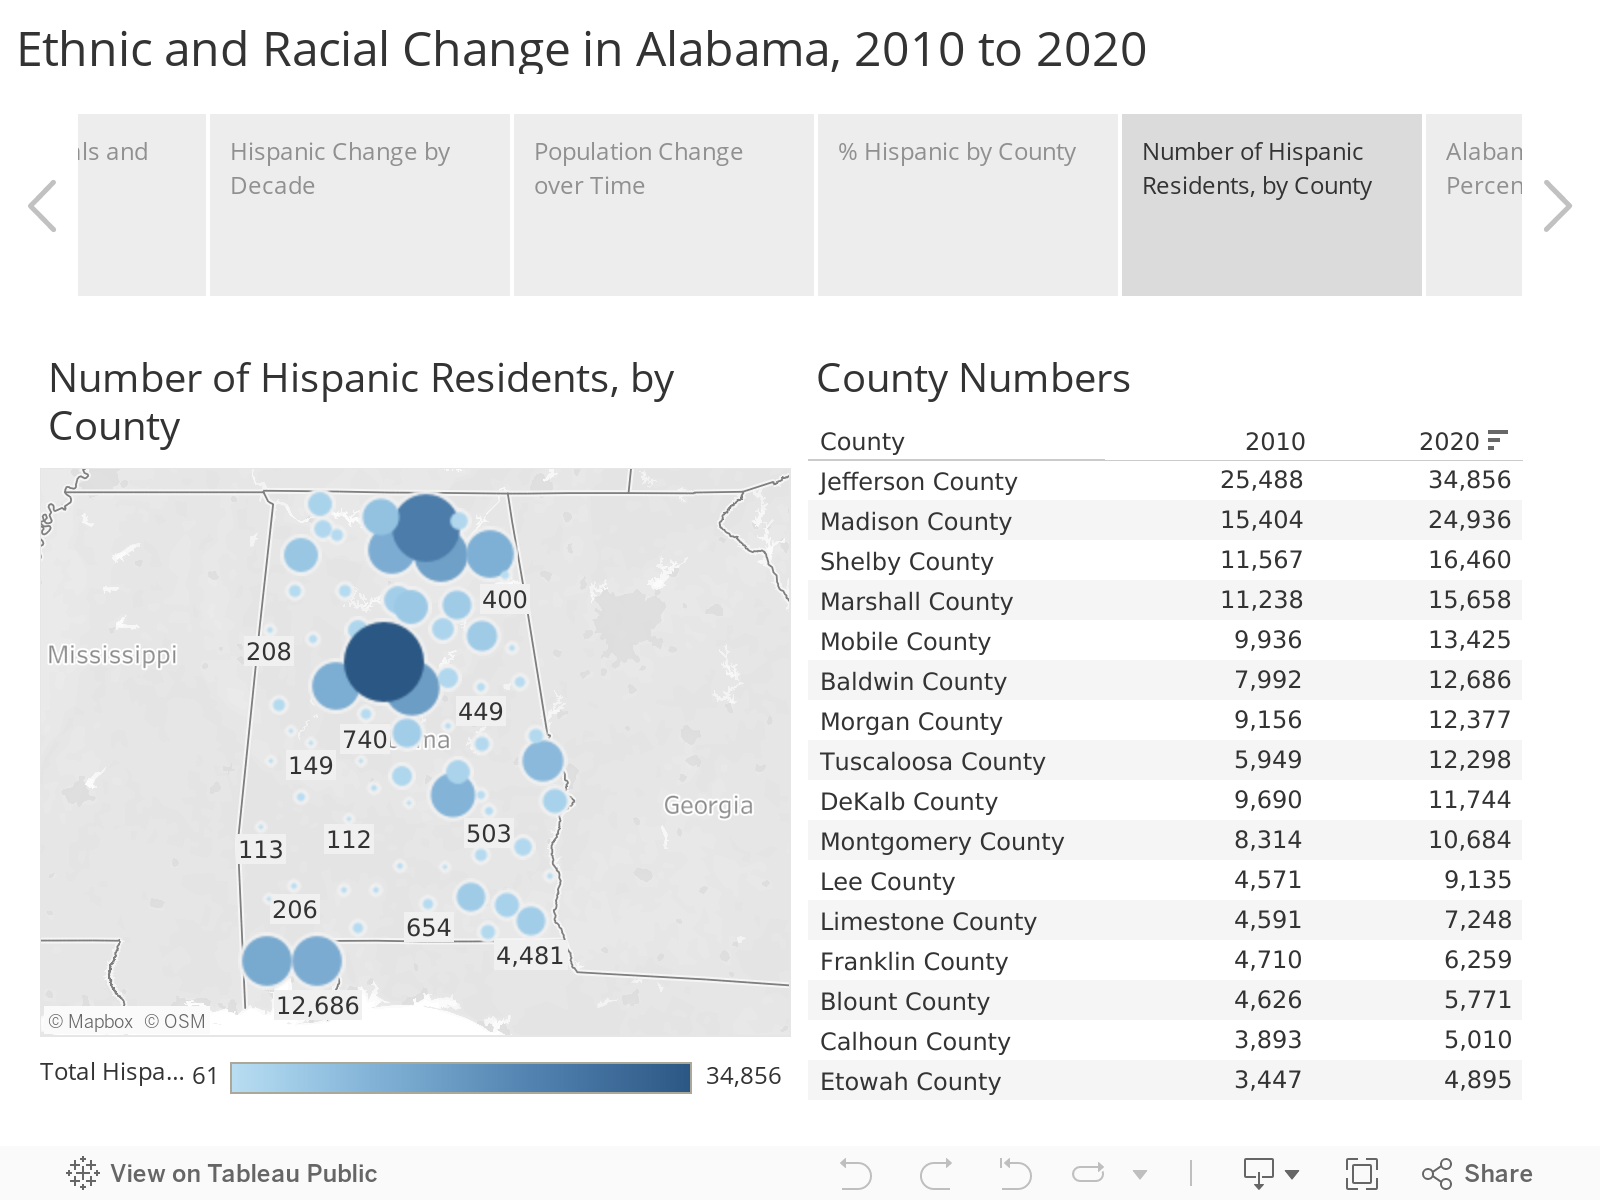
Hispanic Population in Alabama Counties
In Alabama, the counties with the highest percentage of Hispanic residents are in North Alabama, in a band stretching from Franklin County in the west to DeKalb County in the east. Those counties where the Hispanic population is most concentrated are also centers for the poultry industry, which was an initial draw for Hispanics settling in Alabama. Secondary concentrations are evident in Tuscaloosa and Pickens counties and in Southeast Alabama’s Wiregrass region. Those are also coincidental with poultry industry concentrations. Higher percentages of Hispanics can also be found in counties like Shelby, Madison, Baldwin, Lee, and Limestone, where residential and commercial construction jobs are plentiful.
But in terms of numbers, the most Hispanic and Latino residents are found in Alabama’s more populated metro counties. Jefferson County’s Hispanic population is now nearly 35,000, while neighboring Shelby is home to over 16,000. Madison County is second in the state with almost 25,000 Hispanic and Latino residents, complemented by strong Hispanic populations in neighboring Marshall (15,658) and Morgan (12,377) counties. Madison added more Hispanic residents than any other Alabama county over the previous decade.
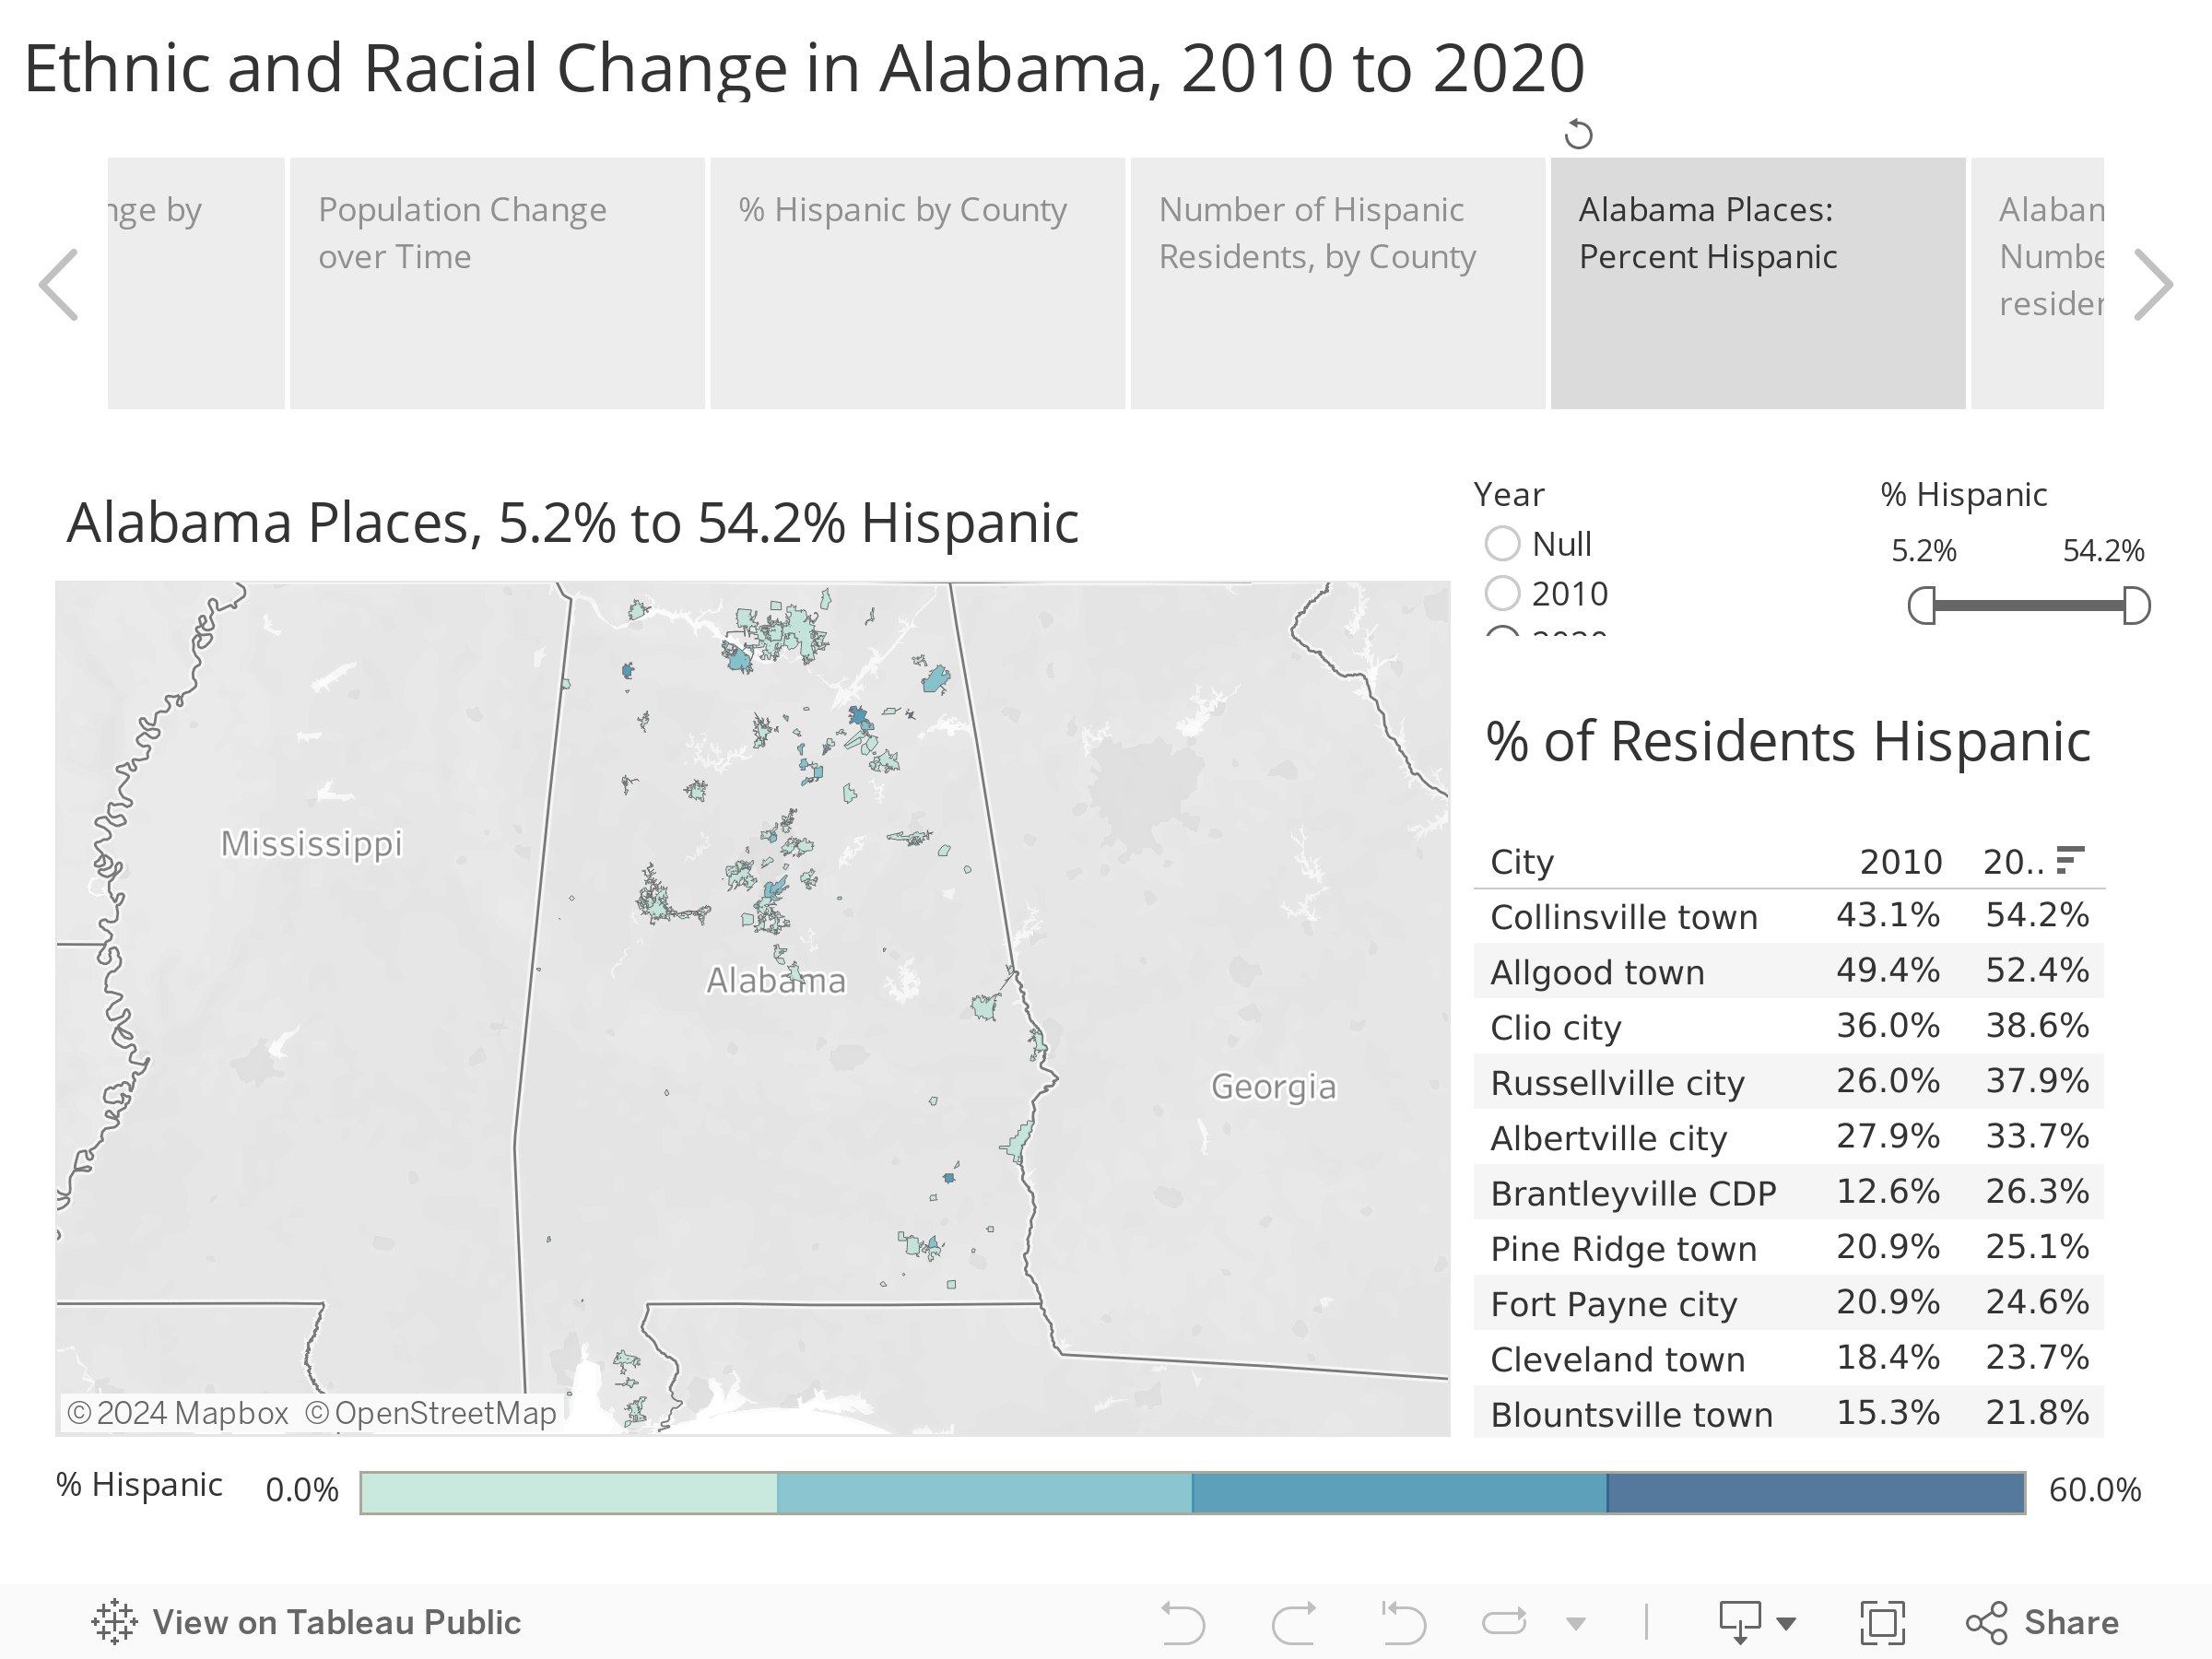
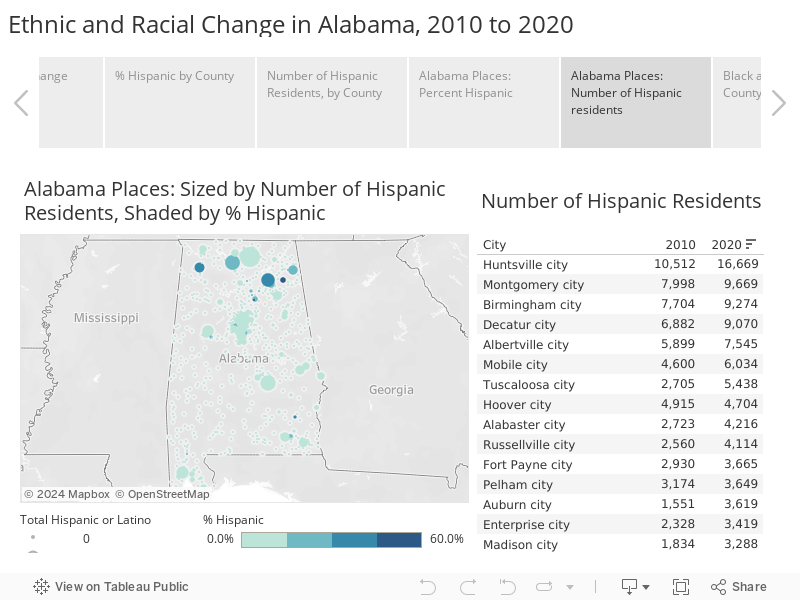
Hispanic Population in Alabama Places
Parallel geographic concentrations of Hispanic individuals can be seen in the population of Alabama cities, towns, and places. Alabama now has two municipalities where a majority of the population is Hispanic: Allgood in Blount County and Collinsville in Dekalb, according to the 2020 Census.
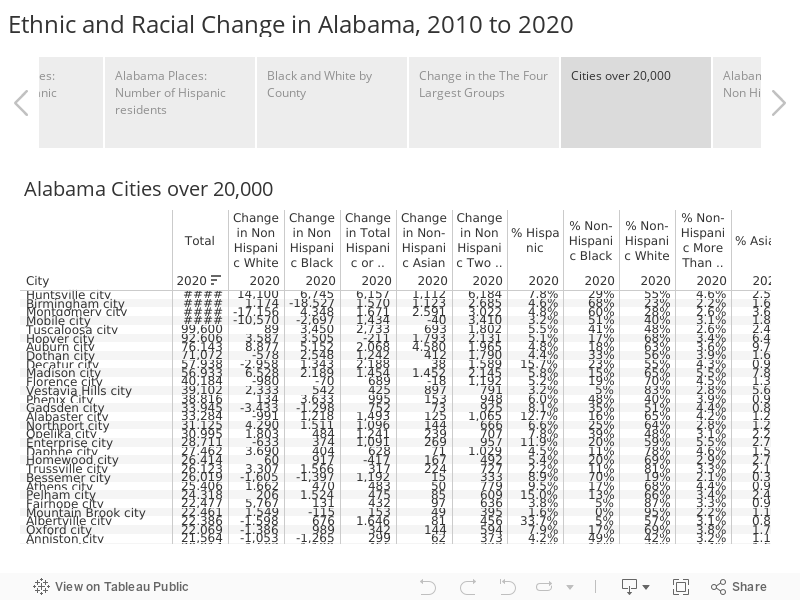
Among cities with a population of 20,000 or more, Albertville (population 22,386) has the highest Hispanic percentage of population, with the 7,545 Hispanics living there constituting 34% of the city’s population.
In terms of numbers of Hispanic inhabitants, the larger populations are found in the state’s big cities. Huntsville has more Hispanic residents, 16,669, than any other Alabama city, followed by Montgomery, Birmingham, and Decatur, each with over 9,000 Hispanic residents.
Near Birmingham, Hispanic communities along the Interstate 65 corridor in Hoover, Pelham, and Alabaster total over 10,000. Out of 597 Alabama cities, towns, and places, 450 saw either flat or increases in the Hispanic population. Among Alabama cities above 20,000 in population, only two, Hoover and Homewood, saw a decline in their Hispanic populations over the decade. Homewood was down by 417, Hoover by 211.
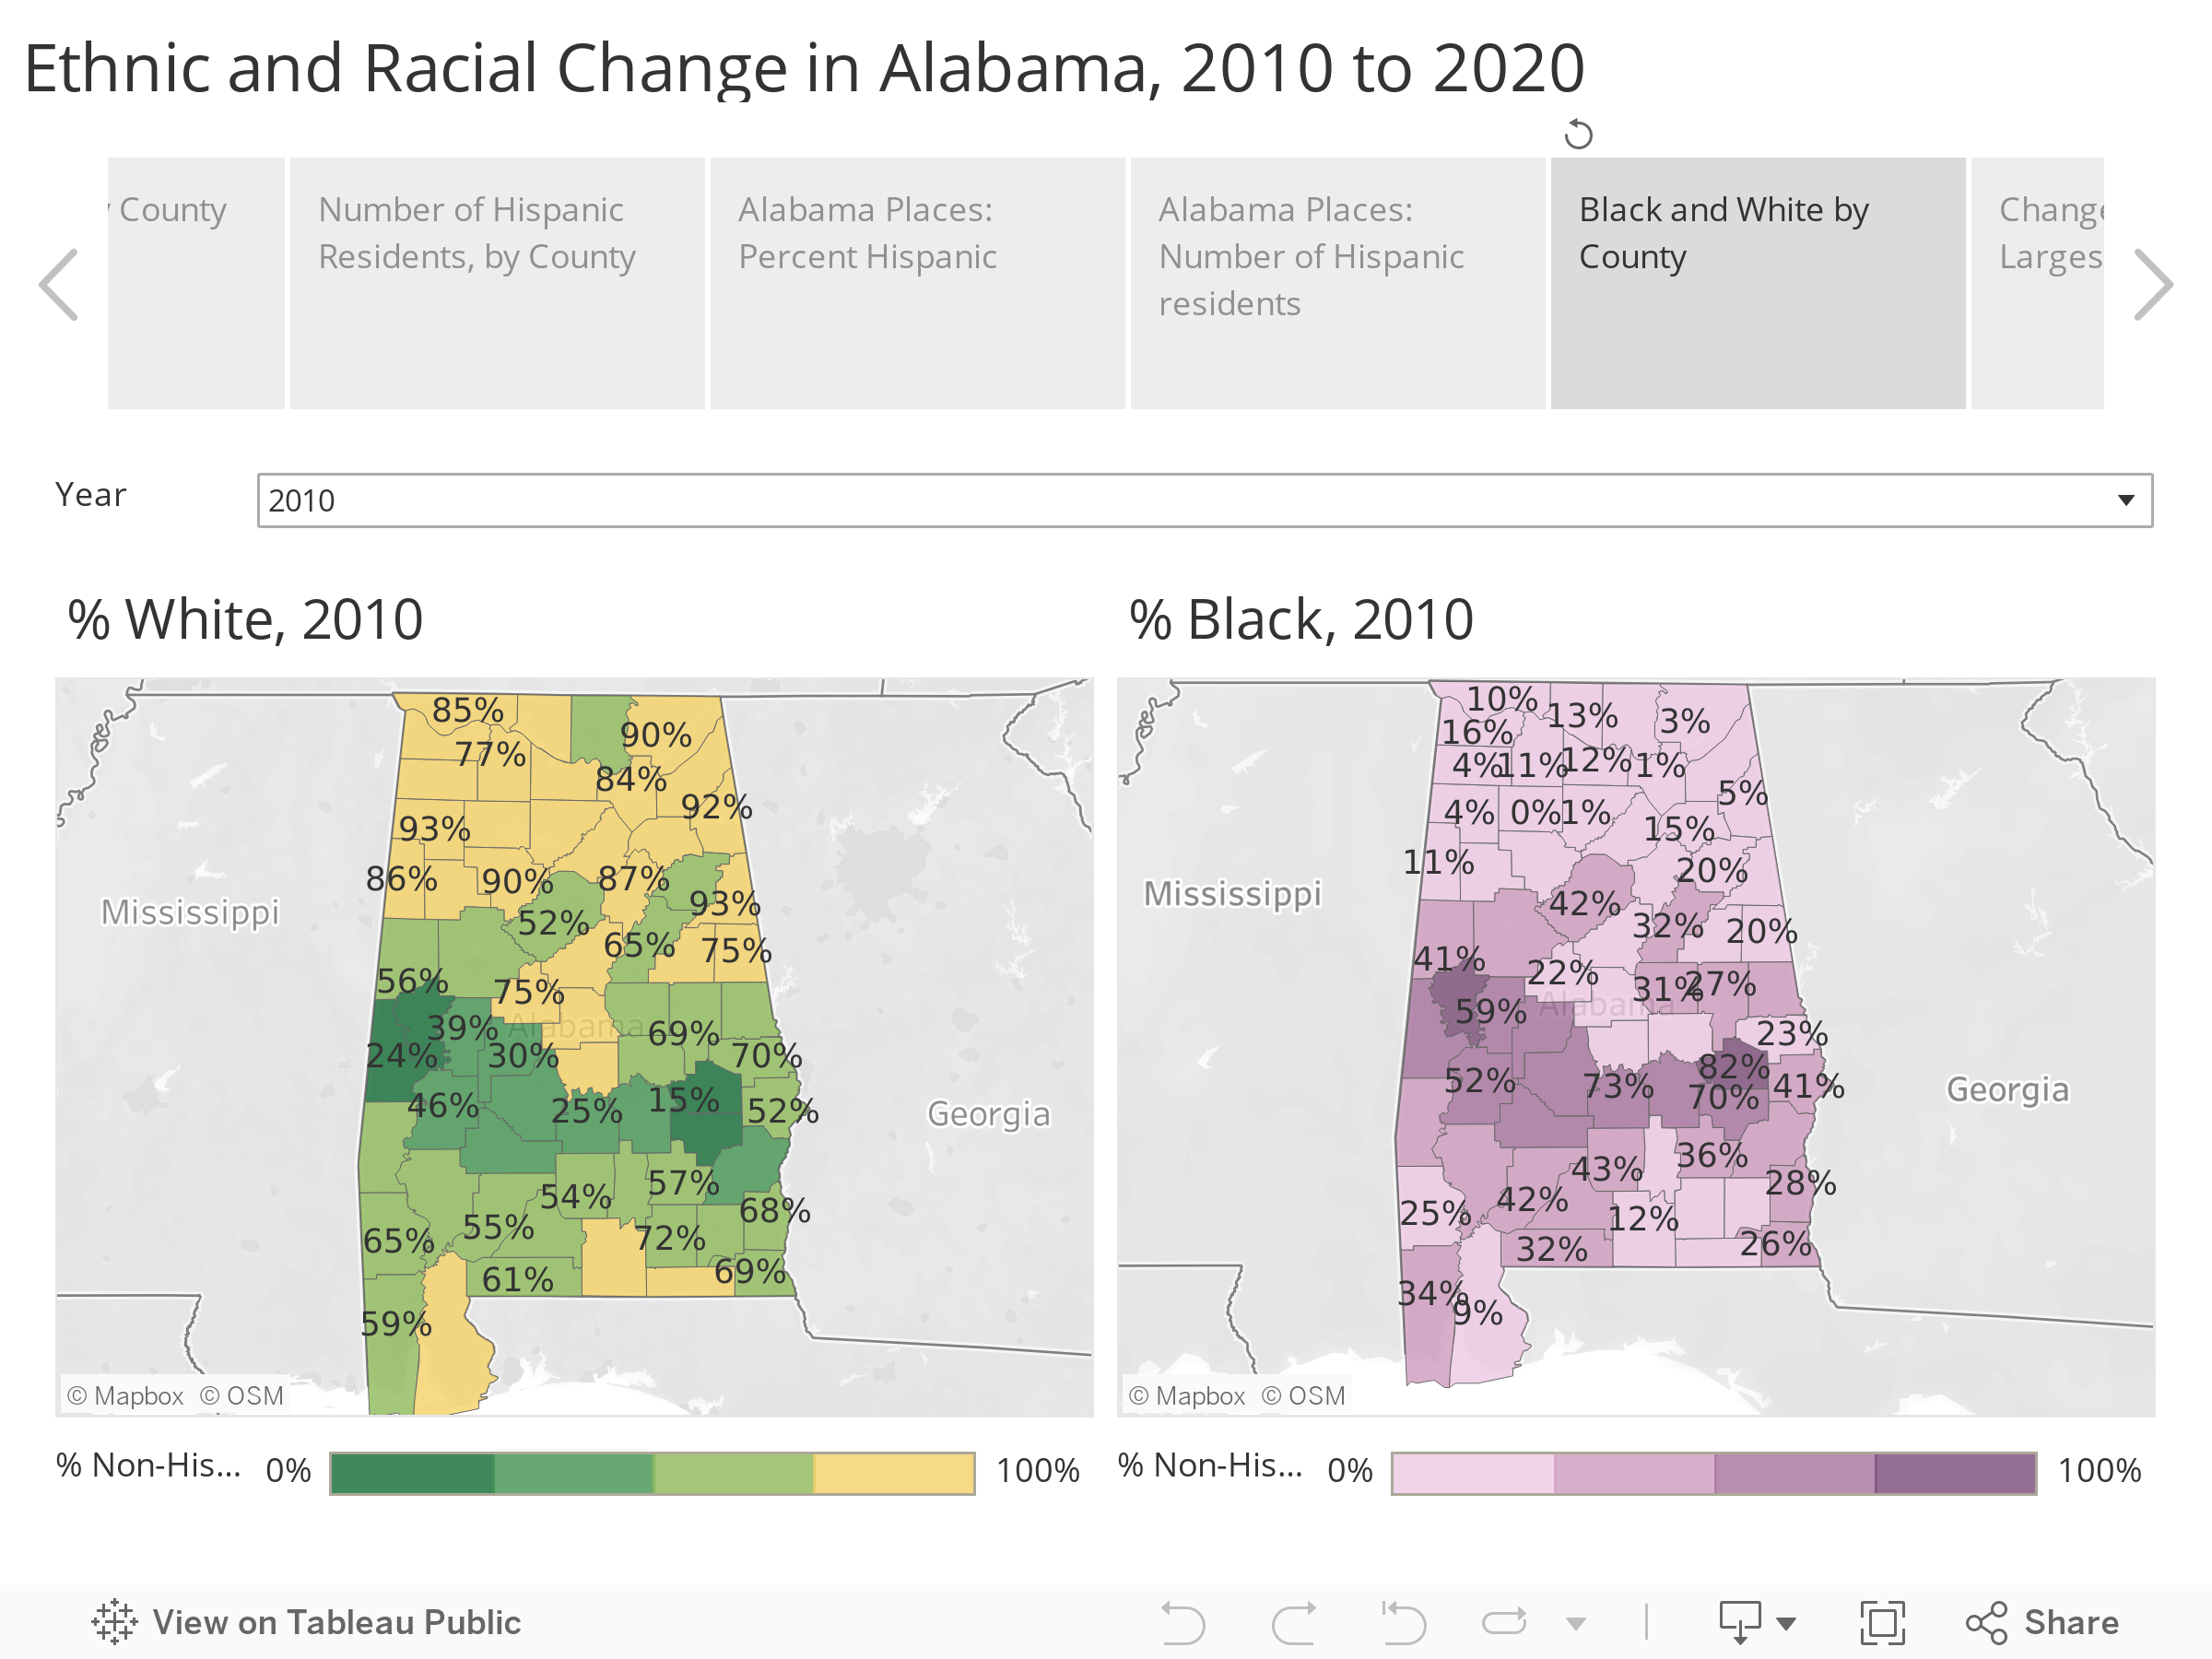
Black and White: Enduring Patterns and Subtle Changes
While the Hispanic, Asian, and multiracial populations are of interest because of their rate of change, the enduring story of Alabama is the population patterns of Black and White, a story stretching back to statehood.
The general pattern remains in Alabama: 11 counties are majority black, the south central Alabama counties of the Black Belt, named for their rich soil, counties that historically had the highest concentration of cotton plantation agriculture and enslaved persons. Those black majorities persisted after emancipation and continue today.
Greene County has the highest percentage of non-Hispanic Black population, over 80%. The most populous majority black county is Montgomery County, with over 229,000 residents, 55% of whom are Black.
Meanwhile, Winston County, in rural northwest Alabama, has the highest percentage of Non-Hispanic White residents at 92%, with Cleburne (91%), Cherokee (90%), Cullman (89%), and Marion (89%) not far behind.
In 11 counties, the Non-Hispanic White population increased. Baldwin County saw the largest increase over the decade, with a gain of 34,000, followed by Madison, Lee, and Limestone. However, those counties all diversified as well. Blacks, Hispanics, and other groups also grew in numbers.
The counties with the most significant decline in the number of residents identifying as Non-Hispanic White were Mobile (-17,201), Jefferson (-15,961), and Montgomery (-14,745). Remember that some of that “decline” in the count may be attributed to individuals reclassifying themselves. However, those population changes in the white population correspond with overall population counts and flows that show continuing movement to suburbs located in adjacent counties.
In each of the central metro counties, the percentage of the population identifying as non-Hispanic White has declined as a share of the population as the Black, Hispanic, and other racial and multiracial subgroups increase. Non-Hispanic Whites represented 52% of Jefferson County’s population in 2010; by 2020, that percentage was 48%. Blacks make up 42% of the Jefferson County population in 2020, roughly the same percentage as in 2010. The Hispanic population grew by over 9,000, increasing from 4% to 5% of the population. The group with the biggest increase in Jefferson County was non-Hispanic More than One Race, up 12,921, constituting 3% of the population.
In Montgomery County, 38.4% of the population was non-Hispanic White in 2010; In 2020, 32%. The Black majority in Montgomery County increased from 55% to 57%. Hispanics increased by 2,370, now representing 2% of Montgomery County’s population, up from 1% in 2010. Asians 3,160, now 4% of the population, while the non-Hispanic More than One Race category increased by 3,519 and in 2020 representing 3% of the population.
In Mobile County, the non-Hispanic White population percentage went from 59% in 2010 to 55% in 2020. The Black population increased by 3,163, or 35% of the county population. The Hispanic community increased by 3,489, raising its share of the population to 3.2%. Like Jefferson County, Mobile County’s biggest growth category was in the non-Hispanic More than one race category, which gained over 10,000, making it the second most populous minority group at 3.7% of the population.
Meanwhile, Madison County’s non-Hispanic White population increased by 16,000, but its Black population grew by 16,052, non-Hispanic More than One Race population grew by 13,027, and its Hispanic population increased by 9,532. Despite the growth in the non-Hispanic White population, its population percentage decreased from 66% of the population in 2010 to 61% in 2020.
Just as whites have sought out new housing opportunities in the suburbs, Blacks make up an increasing percentage of the population in Shelby and St. Clair Counties around Birmingham and are also an increasing percentage of the population in Autauga and Elmore counties outside of Montgomery.
Meanwhile, the Black population is also decreasing in Alabama’s Black Belt,
Race in Alabama Cities, Towns, and Places
When looking at cities, some subtle shifts can be seen in the data. Birmingham, which saw decades of White flight, saw an increase in the White population but not enough to offset significant outflows of Blacks. Meanwhile, Montgomery and Mobile, which had maintained more racial balance for longer than Birmingham, saw outflows of White residents and growth in other demographic groups.
In Huntsville, populations increased across all racial and ethnic groups, though that multifaceted growth also produces a diversified population.
Birmingham
Between 2010 and 2020, Birmingham saw a modest gain in its non-Hispanic White population, with an additional 1,000 residents identifying as non-Hispanic White. Meanwhile, Birmingham’s Black population declined by almost 20,000. The city added about 1,500 Hispanic residents, and the number of individuals identifying as non-Hispanic More than One Race was up 2,685. The city saw a net decline of 11,504. Because of the shift, Hispanics and non-Hispanic Whites now represent a slightly higher percentage of Birmingham’s population. In contrast, the Black percentage of the population declined from 73% to 68%., with 23% White, 5% Hispanic, 2% More than one Race, and 2% Asian.
Montgomery
The situation was different in Montgomery. The City of Montgomery’s Black population grew by 4,348, but the White population declined by 17,000. The Hispanic population of Montgomery increased by 1,671. But the most growth came from an increase of 2,591 Asian residents and 3,022 in those reporting More Than One Race. In 2020, Montgomery’s population was 60% Black, up from 56% in 2010. Non-Hispanic Whites dropped from 36% of the population to 28%. Asians climbed to 4% of the population, just ahead of More than One Race at 3%.
Mobile
In the City of Mobile, the White population declined by 10,570, the Black population declined by 2,697, and the Hispanic population increased by 1,434. An additional 3,410 people in Mobile identify as More than one Race compared to 2010. The Black population now represents 51% of Mobile’s population, up from 50% in 2010. The White population represents 40%, down from 44% in 2010. Hispanic and individuals of More than One Race each make up 3% of the population, while Asians represent 2%.
Huntsville
Meanwhile, in Huntsville, each of the four largest groups grew: Hispanics (+6,157) and non-Hispanic Whites (+14,100), Blacks (+6,745), and non-Hispanic More than One Race (+6,184). The non-Hispanic White population decreased in its share of the population from 58% to 55%. The Black population share decreased from 31% to 29%, but the Hispanic share increased from 6% to 8%. Individuals of More than One Race increased to 4.6% of the population, while the Asian share of the population increased slightly to 2.5%.
Growth in the Asian Population
Though the Asian population in Alabama is smaller in comparison to other demographic groups, there has been notable growth in some areas.
The small fishing town of Bayou La Batre in south Mobile County is the Alabama city with the highest percentage of Asians in the population. The Vietnamese community there, established by people fleeing the aftermath of the Vietnam War, represents 20% of the city’s population. However, over the past decade, the number of Asian residents declined by 162.
Meanwhile, the Asian population has grown significantly in several communities and counties along the Interstate 85 corridor, home to Hyundai, Kia, and automotive suppliers with ties to South Korea. Auburn’s population is 10% Asian, after adding 4,580 Asian residents between 2010 and 2020. Montgomery’s Asian population increased 2,591, and neighboring Pike Road added 472 Asian residents.
The Asian population also increased in the Birmingham metro — Hoover (+1,793), Birmingham (+1,123), and Vestavia Hills ($897) — and in Huntsville (1,112) and Madison (+1,452).
Conclusion
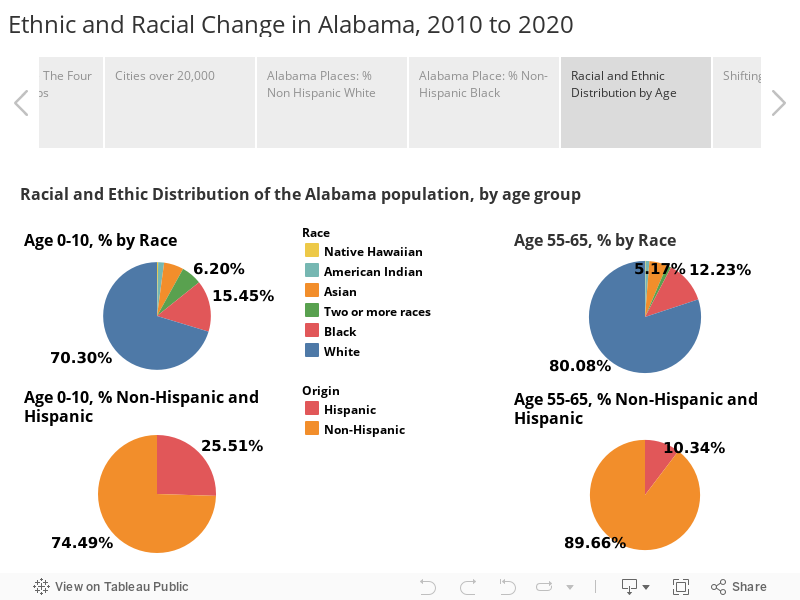
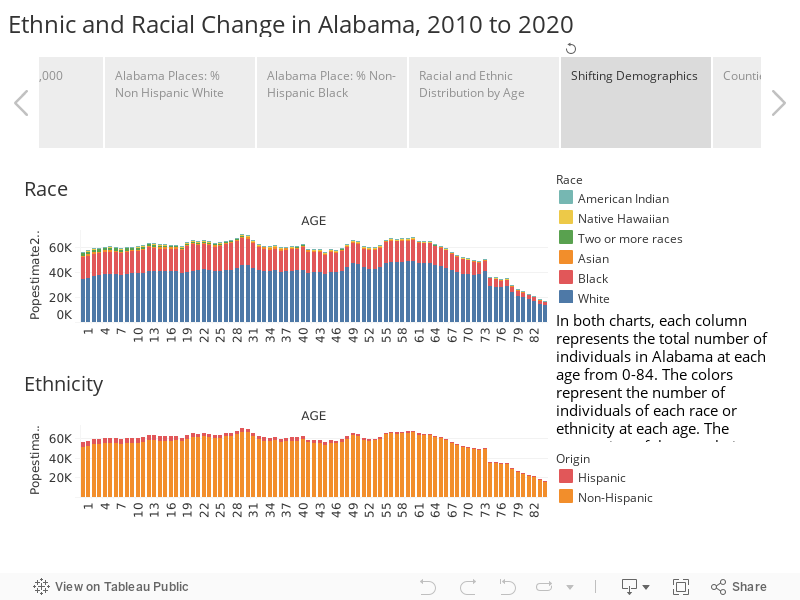
Alabama and the nation continue to diversify due to birth, death, and migration trends. But the statistics from the 2020 Census show that the nation is also changing through marriage and evolving attitudes toward racial identity as customs and generations change. The chart below looks at the Alabama population by age, with the population color-coded first for race and then for ethnicity. Both charts note the increasing racial and ethnic diversity in the younger population.
The shifting demographics challenge Alabama to continue progress toward common goals and increasing equality of opportunity for all.
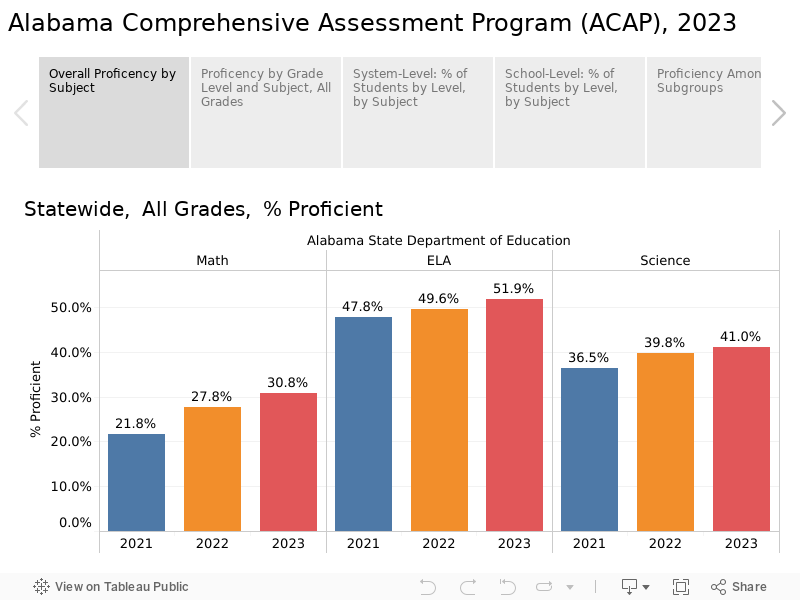
State Test Results Showed Across the Broad Improvement; Gaps Widened Though
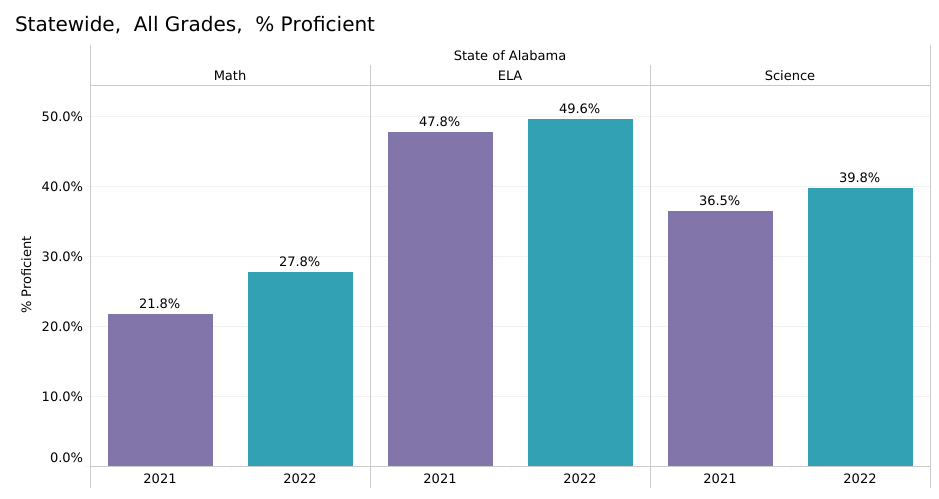
Alabama public school students showed increased proficiency in math, science, and English at all grade levels and across virtually all demographic groups in the 2021-2022 school year, according to the recently released results of the statewide standardized test, the Alabama Comprehensive Assessment Program (ACAP).
Figure 1. Proficiency By Subject (Grades 3-8), 2021 and 2022 compared
While the improvement is welcome, there is a long way to go.
Only half of students across the tested grades (3-8) scored proficient in English Language Arts (ELA). In math, only 28% of students were proficient. Students were tested in science in grades 4 and 8, and 40% of students were found to be proficient. A sub-set of the ELA questions is used to measure whether second and third-graders are “reading on grade level,” a different measure than proficiency. Those results, released by the state department this summer, showed that 22% of third-grade students were below grade level in reading.
This is the second year students have taken the ACAP as the statewide standardized test. Developed specifically for Alabama, ACAP is not taken by students in other states. Comparing ACAP scores to scores on previous assessments (ACT Aspire, Scantron), ACAP finds similar though slightly higher proficiency rates in ELA/Reading as previous statewide standardized tests found. The one national benchmark test, the NAEP, has historically graded tougher, with reading proficiency rates about half what other assessments show. In Math, ACAP seems to be the toughest measure of all, with scores in the range of but slightly lower than NAEP. Past statewide assessments have tended to grade student math proficiency more generously.
A Rebuilding Year
The 2021-2022 school year marked a return to closer-to-normal conditions compared to the 2020-2021 school year, which was marked by the disruptions from the Covid-19 pandemic. Improvements were seen not only across all subjects and all grades but across almost all school systems.
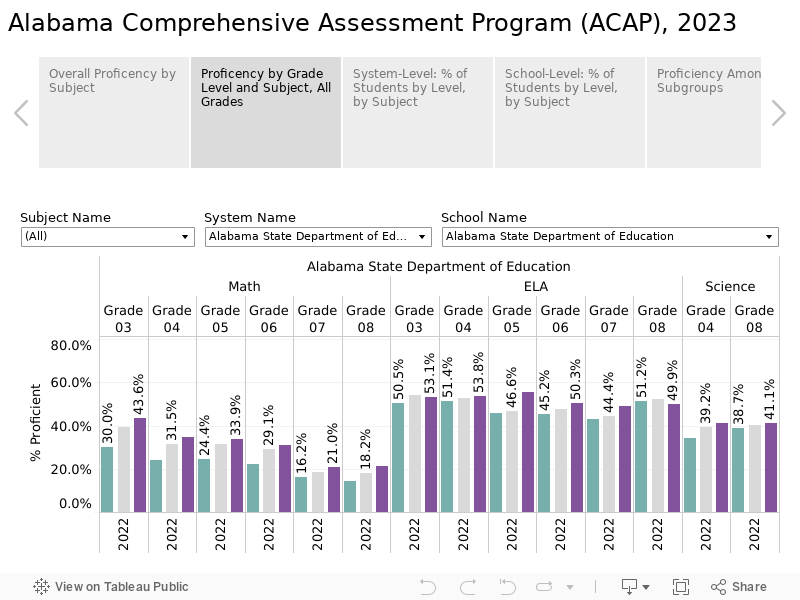
Looking at the results by subject and grade, improvements were strongest among the youngest students. The gains were highest in early grades mathematics, a welcome development considering Alabama students’ long-term poor performance in math. The math proficiency rate among third greater increased by 9 percentage points and by seven percentage points in grades 4-6. With urging and support from the Legislature, the Alabama Department of Education is putting additional emphasis on early grades mathematics. The early grade gains show promise. However, the percentage of students scoring proficient in math declines sharply in the upper-grade levels, as it has for years.
ELA scores are also highest in those early grades, with a drop after fourth grade, then a recovery in 8th. In response to the 2019 Alabama Literacy Act, schools and systems statewide have been providing an unprecedented level of professional development for reading instruction for teachers in Grades K-3. As one might expect, growth in ELA scores from 2021 to 2022 was highest in Grade 3.
Figure 2. Proficiency by Grade, 2021 & 2022 compared
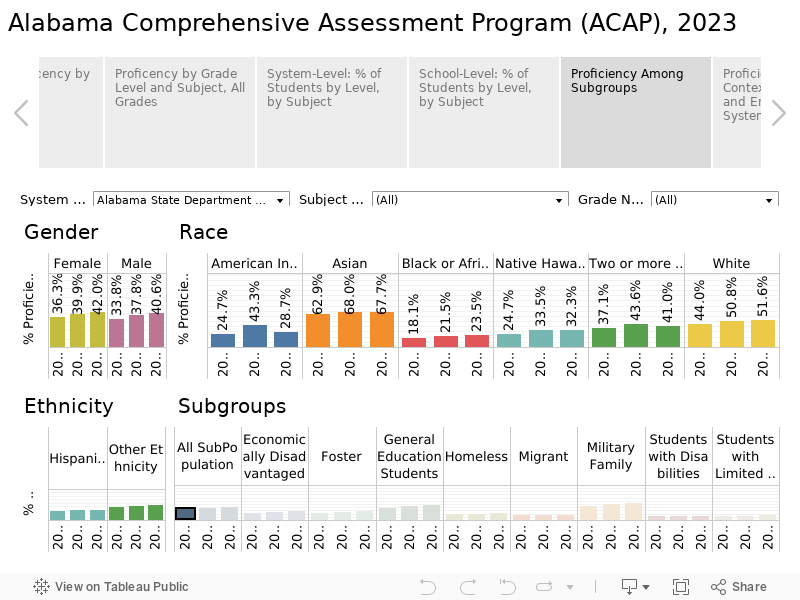
Results by Subgroup
Most subgroups of students showed improvement, with the strongest gains being among White, More than One Race, and Asian students. While Black, Hispanic, and economically disadvantaged students all posted gains, the higher level of increase among White, More than One Race, and Asian students led to a widening of the score gap between the groups. Nationally and within the state, evidence indicates that systems serving economically-disadvantaged and minority students tended to be harder hit by the pandemic and were slower to return to normal functioning as conditions improved. That may play some part in explaining the disparity.
Figure 3. Proficiency by Subgroup, 2021 & 2022 compared
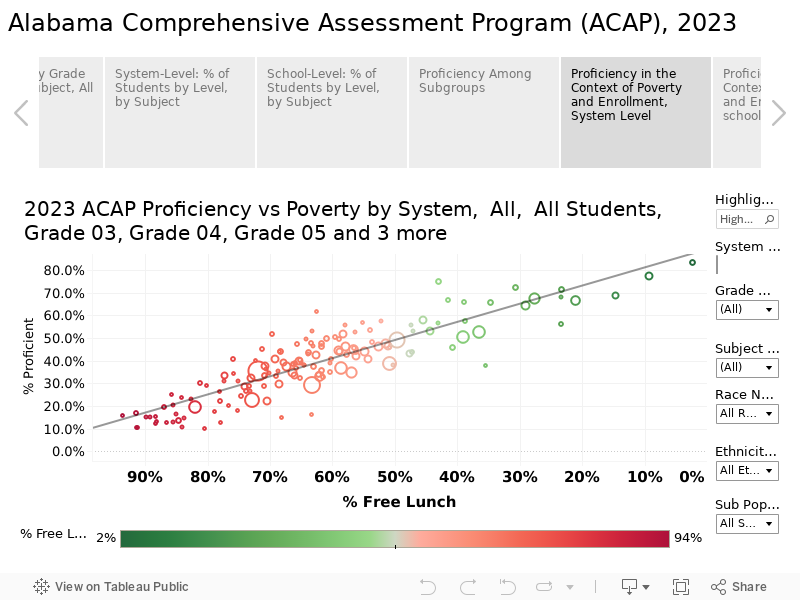
Proficiency in Context
In general, systems with low rates of economic disadvantage tend to have a higher percentage of students scoring proficient. Schools and systems with higher concentrations of economic disadvantage tend to have lower rates of proficiency. This pattern is consistent nationally across most standardized tests. The economic disadvantage for a system or school is measured by the percentage of students who automatically qualify for a free lunch under the national school lunch program.
The chart below presents school systems according to both their rate of proficiency (the vertical axis) and their rate of economic disadvantage (the horizontal axis). Systems with higher rates of proficiency are higher above the baseline, while the systems to the left of the chart have high rates of economic disadvantage, with economic disadvantage decreasing as you move right. The line sloping up to the right represents the relationship between the two variables and predicts where the proficiency rate of a system at a given level of economic disadvantage. Thus, systems above the line of prediction are performing better than predicted given the level of poverty among students.
Piedmont City Schools, for instance, generated an overall proficiency rate of 60% despite having 54% of students qualifying for a free lunch. That compares to a 2022 state average proficiency across all grades and all subjects of 38% and an average economic disadvantage rate of 41%.
Figure 3. System Proficiency in the Context of Poverty, 2022
Using the same approach to present proficiency results for schools, the relationship between proficiency and economic disadvantage levels is still there, but it is not as determinative, with greater divergence from the line of prediction. That provides further evidence the efforts of educators and communities can make a difference.
Use the menus provided to explore the data or to highlight schools and systems of interest.
Figure 4. School Proficiency in the Context of Poverty, 2022
Beyond proficiency
Student scores on the ACAP fall into one of four levels. According to the scoring system, Level 4 students have an advanced understanding of grade-level standards. Students scoring on Level Three have a strong understanding of standards. Students on Level 2 have a partial but incomplete understanding of grade-level standards, while students scoring on Level 1 demonstrate minimal understanding of the material for the grade level.
Figure 5 presents the percentage of each system’s students that earned scores at each level. Two lines are presented for each system, allowing a comparison of the 2021 and 2022 results. Overall state results are at the top for comparison.
Figure 5. Percentage of students scoring at each level by system
Figure 6. presents the same information on student levels for individual schools. Menus allow the selection of systems. When comparing schools keep in mind the socio-economic mix of the students being served, as well as the school’s status as a magnet or charter school. Results for schools where students are selected or self-selected should be understood in that context. It is also important to remember that schools can change from year to year. Some schools may close or merge with other schools. New schools may open. Grade levels may be added or removed. Any such changes need to be considered before drawing conclusions about performance.
Figure 6. Percentage of Students scoring at each level by school
Large Performance Gains
In 2022, the system that showed the highest overall percentage point gain was Cullman City School, with an 11.6 percentage point gain in proficiency in all subjects combined.
Cullman’s gains were particularly strong in math. Jumps were seen in all grades ranging from a 14 percentage point gain in 8th grade to a nearly 27 percentage point gain in fourth grade.
Superintendent Kyle Kallhoff attributed the success to teachers, students, and parents. Cullman invested federal relief and recovery money in four math coaches across its five schools. Those coaches received intensive summer training from the state department of education’s Alabama Math Science and Technology Initiative (AMSTI). They continued to receive AMSTI support throughout the year.
With support from the coaches, teachers and students began engaging in number talks, a way of discussing math problems that encourage students to develop mathematical reasoning skills. Cullman teachers also recognized that the rigor of Alabama math standards required them to supplement their math instruction to ensure the standards were covered. to make sure that the math standards were covered.
Teachers paced lessons so that the match standards were covered by April, which allowed time for review and targeting of areas where students needed additional support.
Figure 7. Cullman City Math Proficiency Gains
Explore the data
PARCA provides its analysis and visualization of the ACAP data for the benefit of school leaders and teachers, for parents, and citizens at large. The tabs in the visualizations provide a variety of ways to evaluate relevant data. Use the “full screen” option at the bottom right of the visualizations to access a larger view of the data.
Comparative data is useful for understanding performance in the context of your community and the state. Comparisons over time and with similar schools can be useful in gauging your school’s progress and identifying areas where improvement is needed.