Alabama public school students improved their performance on statewide standardized tests in 2023, with the percentage of students testing proficient rising across most of the tested grades (3-8) and subjects (English Language Arts (ELA), math, and science).
Printable PDF version available here.
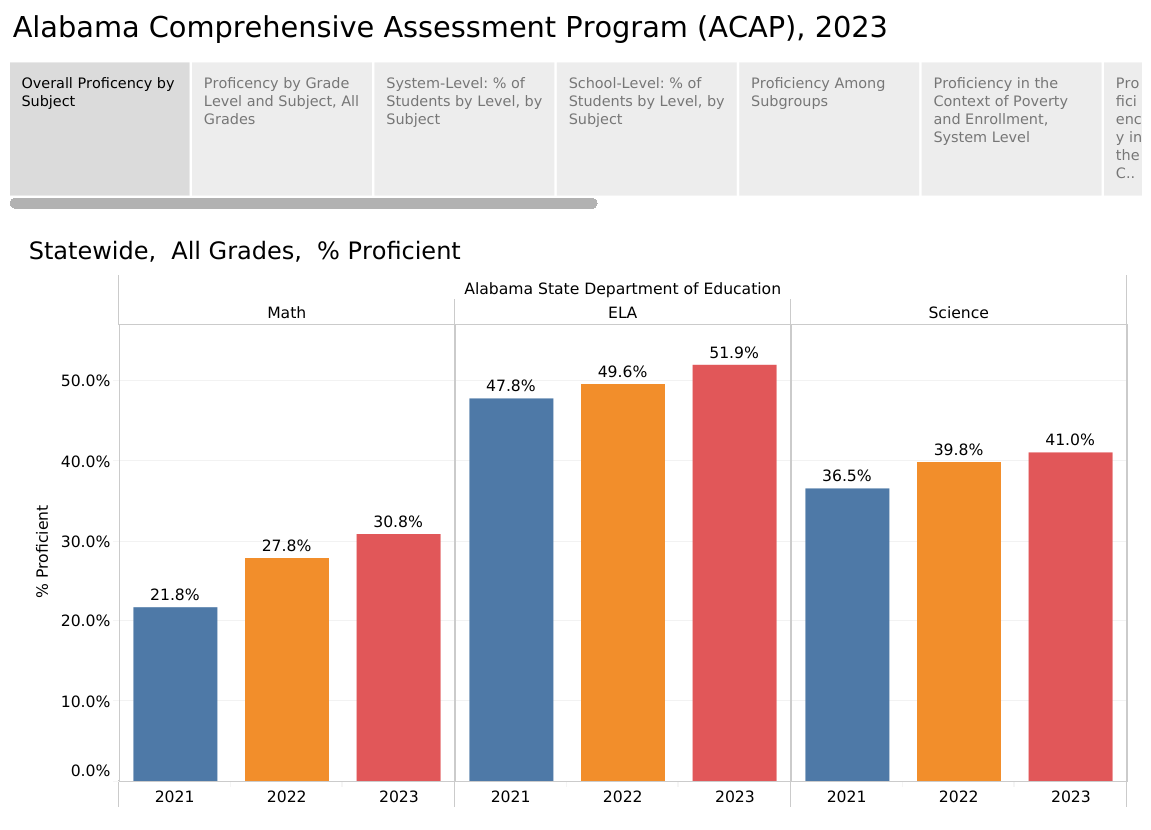
Figure 1. Trends in Proficiency by Subject
Just over half of Alabama students, 52%, were proficient in English Language Arts across all grades, and only 31% demonstrated grade-level proficiency in math. Fourth and eighth graders were tested in science, with 41% scoring proficient.
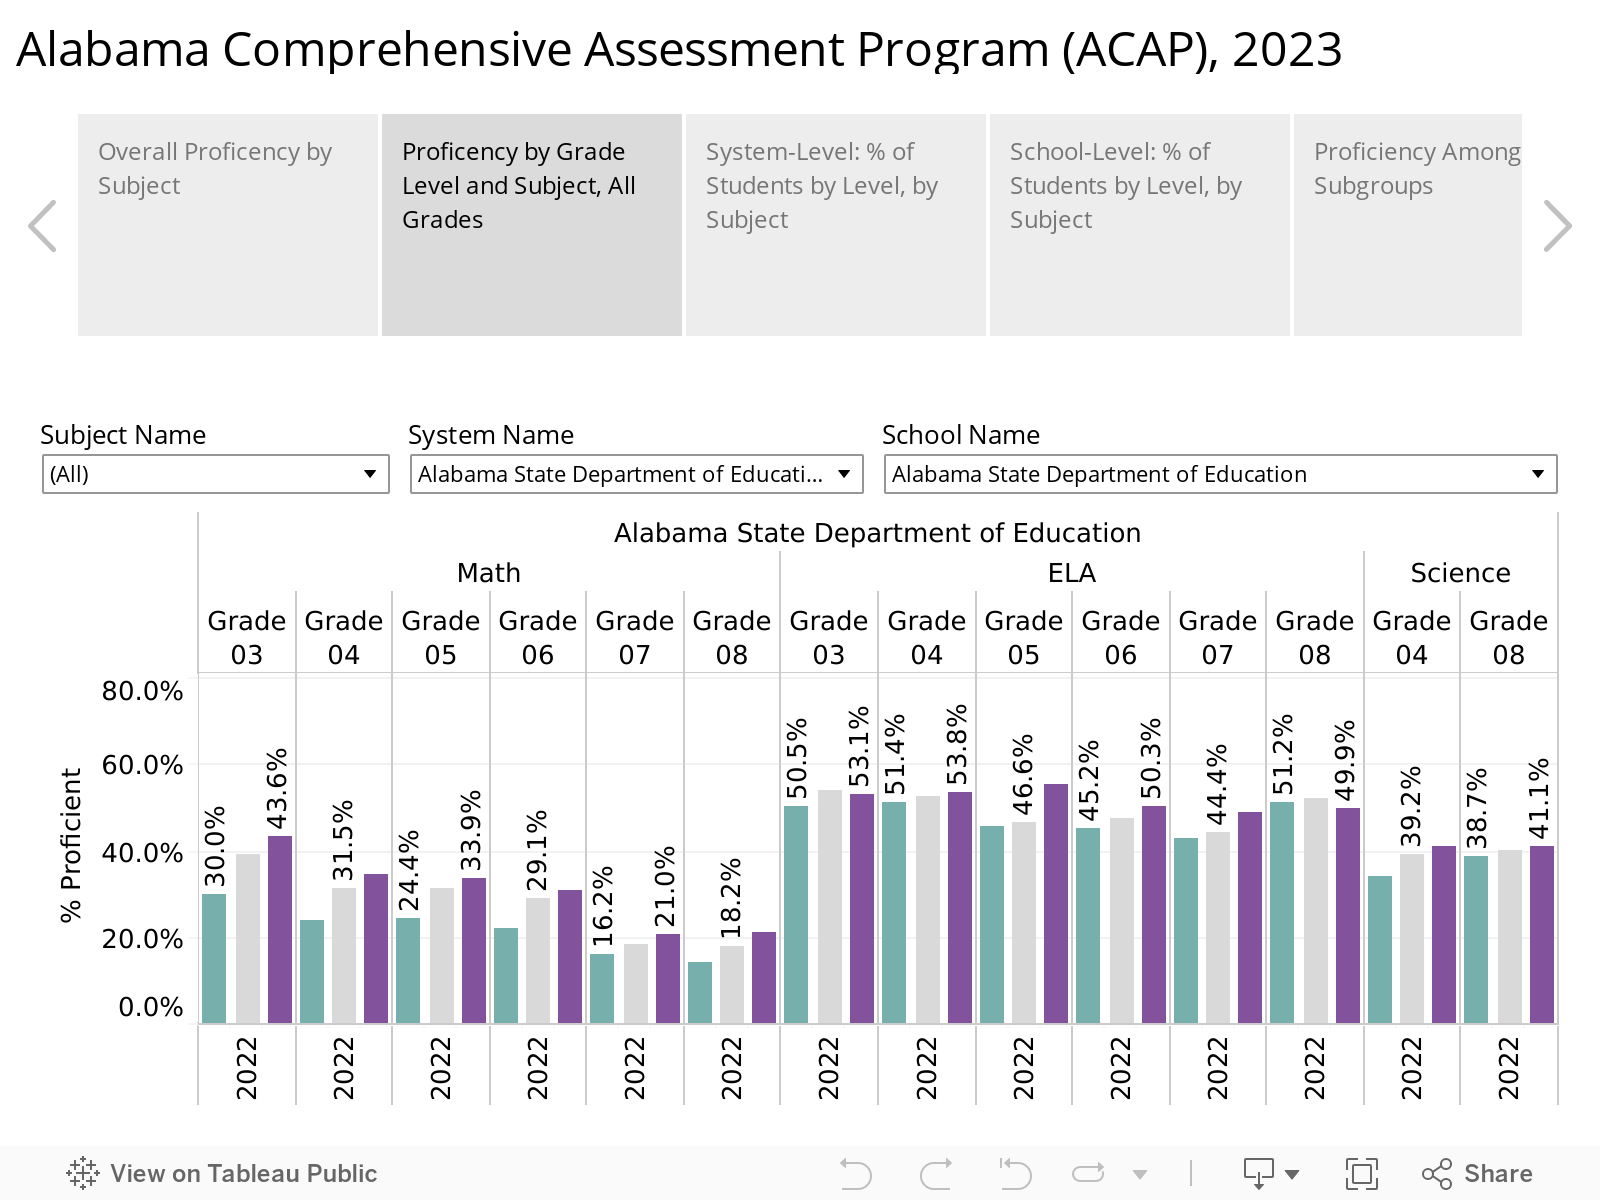
Figure 2. Trends by Subject and Grade Level
English Language Arts
The broad-based improvement comes as a relief since earlier this summer, a subset of the test, 3rd-grade reading results, showed a decline in the percentage of students reading on grade level. Those third graders also showed a slight decline on the broader test of English Language Arts, with the percentage of students proficient declining from 54% to 53%. Eighth graders’ ELA proficiency rates declined by almost 3%, to 50%. However, for students in grades 4-7, the percentage of students scoring proficient in ELA improved. The 2023 ELA test was adjusted to reflect updates to the ELA course of study. It is unclear how those changes might have impacted scores.
But across all grades in English Language Arts, a curious pattern is present. The percentage of students scoring at the highest level of proficiency is growing but the percentage of students scoring at the lowest level of proficiency is also growing.
The test groups students into four levels:
- Level 1: Minimal understanding of grade-level standards
- Level 2: Partial understanding of grade-level standards
- Level 3 Strong understanding of grade-level standards
- Level 4: Advanced understanding of grade-level standards
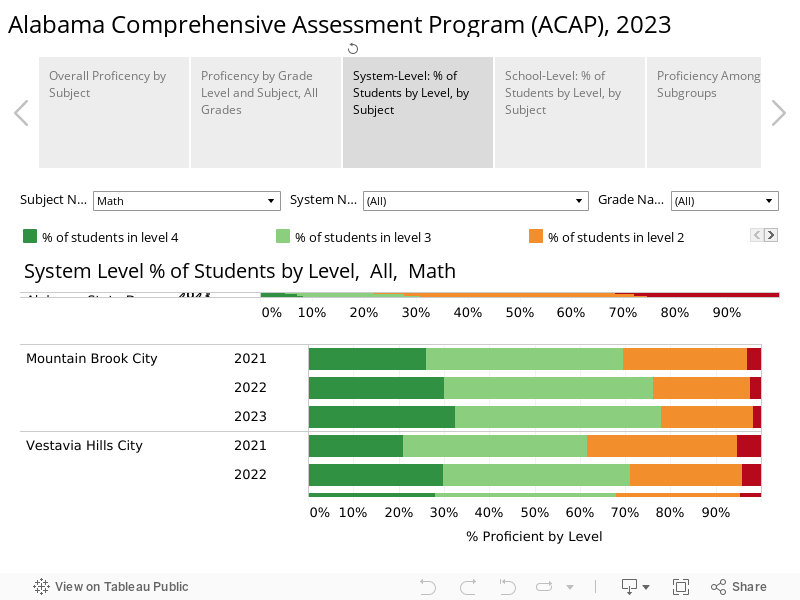
Figure 3. ELA Results, by Percentage of Students at Each Level of Proficiency
Across all grades on the ELA test, more students are testing at Level 4, while at the same time, more students are scoring at Level 1, the lowest level.
Math
The math results are different. Math proficiency has long been Alabama’s Achilles heel, with our students scoring consistently at or near the bottom on national tests. While proficiency is still low overall, math results on the ACAP are improving. As in ELA, more students are testing at Level 4 in math. But unlike ELA, the percentage of students scoring at the lowest level is also shrinking.
Figure 4. Math Results, by Percentage of Students at Each Level of Proficiency
In math, students in every grade improved their proficiency rates. However, another long-running problem for Alabama’s math proficiency is that it declines steeply as children move into middle school. In 3rd grade, 44% of students are proficient, but by 8th grade, only 21% are.
The Challenge of Poverty
One constant about standardized test scores is that the socioeconomic composition of a school correlates with performance on standardized tests like the ACAP. In schools and systems where rates of economic disadvantage are low, a higher percentage of students achieve proficiency. Schools and systems where economic disadvantage is concentrated, standardized test performance is lower.
Figure 5 allows the presentation of both factors at the school system level. Systems in dark red and on the left of the chart have higher concentrations of economic disadvantage. Systems that are dark green are on the right side of the chart. Systems high on the chart have high rates of student proficiency. Systems lower on the chart have lower rates of proficiency. The line slopes up and to the right to reveal the pattern in the data: a lower percentage of students in poverty, the higher the percentage of students achieving proficiency.
Figure 5. Percent of Economically Disadvantaged Students vs. Proficiency Percentage
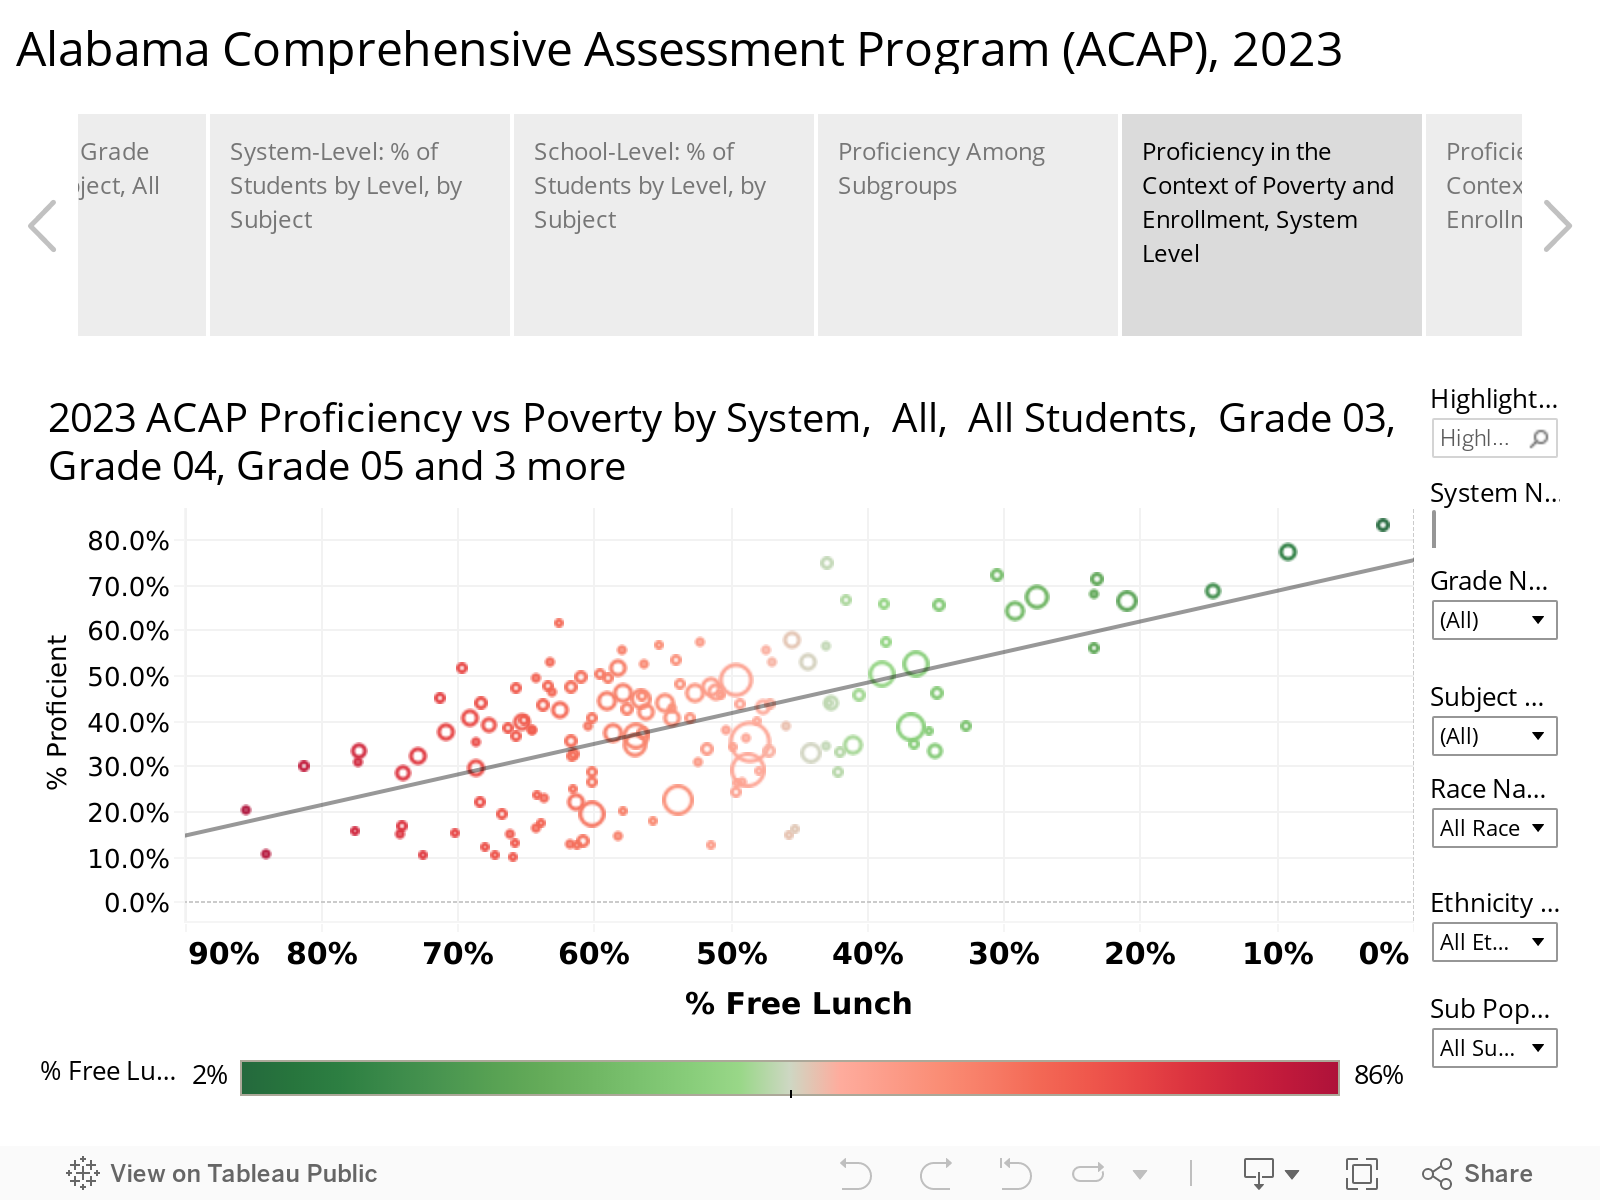
A similar array, but looking at performance at the school level, is also available. While this pattern recurs across datasets, these charts highlight the fact that some schools with high levels of economic disadvantage outperform peer schools with similar levels of poverty.
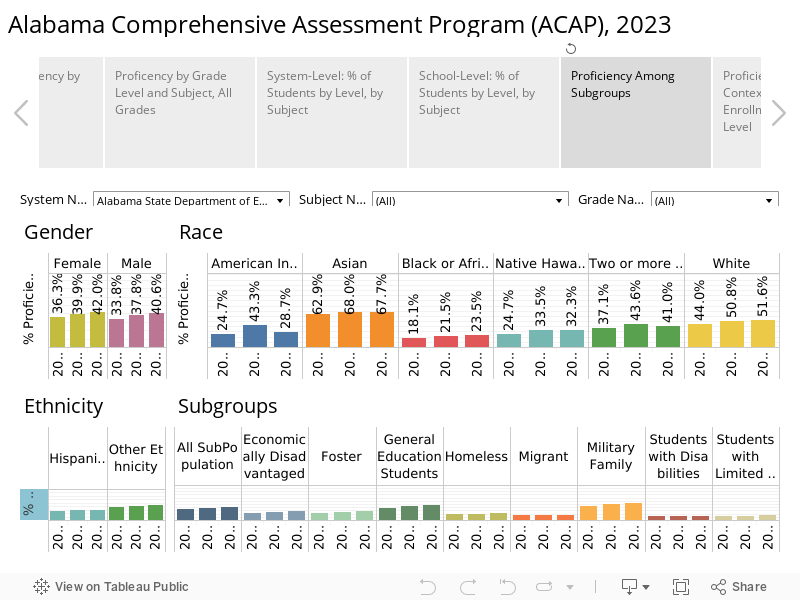
Another encouraging note is that the widespread improvement observed in the results, across grades and subjects, was not restricted to one race or ethnicity, or to a socioeconomic subgroup. Performance gaps between groups remain. But almost all economic and demographic subgroups improved their overall rates of proficiency in the three subjects. In both 4th and 8th grade, the declines in English Language Arts proficiency declines were also distributed across all subgroups.
Figure 6. Trends among Student Subgroups
Alabama students and faculty continue to recover from time and learning lost during the Covid 19 pandemic. Results indicate that teachers are becoming more successful at teaching learning standards, and students are mastering those standards at higher rates. On all fronts, Alabama has a long way to go if it is going to provide a nationally competitive education. Proficiency in math is a long-running concern; in nearly 20 districts, 10% or less of students are scoring proficient. In English Language Arts, the rising percentage of students scoring at the highest level is a cause for celebration. However, the growing number of students scoring at the lowest level is a particular concern as Alabama emphasizes literacy.
Record education budgets, supplemented by pandemic-related federal aid, have allowed for higher levels of education spending than ever. The Legislature has invested in more systematic approaches to literacy and math instruction. It is imperative that schools, systems, the state, the Legislature, the Governor, and the general public identify money being spent that is producing positive results. Successful approaches should be maintained when the inevitable constriction of revenue arrives. Ineffective spending should also be identified and reprogrammed.