PARCA Report Highlights Challenges of Municipal Financial Comparison, Examines City Tax Collections

Our 2022 edition of How Alabama Cities Compare (the tenth edition of PARCA’s study of Alabama city finances) introduces a new methodology, highlights the challenges of comparing municipal finances, and proposes a better way to collect the information in a standardized way that should produce comparable data more quickly. After building consensus and adjusting existing practices, such a system would save cities time and provide the data they need to manage their affairs.

Understanding a city’s revenues and expenditures in comparison to other cities is a fundamental tool for effective management.

By benchmarking against neighbors, a city may discover it is spending more than necessary. Alternatively, city leaders may conclude that a higher level of investment puts the city at a competitive advantage, providing a higher level of service and better quality of life for residents.

Unfortunately, making such comparisons is difficult in Alabama. Unlike other states, cities in Alabama are neither required nor encouraged to use a uniform chart of accounts, a standard system for coding revenues and expenditures.

Nor does Alabama have an effective system for publishing and sharing the kind of comparable data that could be produced with a uniform chart of accounts.

For instance, North Carolina, Georgia, and Florida have a statewide reporting system that makes city and county financial information available online in a downloadable format that allows for detailed comparisons between peer cities or counties.

If Alabama wants to gather this data and equip its cities with a tool for comparison, the U.S. Census Bureau’s Annual Survey of State and Local Finances provides an existing base of information already submitted by city governments.

In terms of tax collections, an analysis of the most recent data from the Census survey finds:

  1. Alabama cities heavily depend on sales tax, with almost 60% of revenue coming from that source.
  2. Of cities with populations more than 20,000, per capita tax collections range from $2,674 in Homewood to $402 in Prichard.
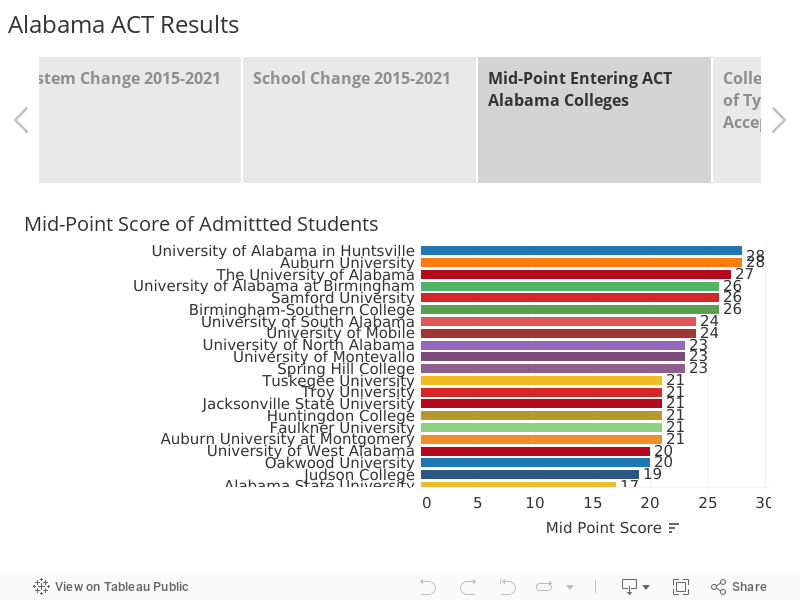
  3. Oxford has the highest per capita sales tax revenue at $1,502 per resident.
  4. Mountain Brook is the only city in Alabama to collect more in property taxes than in sales, with 46% of municipally collected revenue coming from the property tax.
  5. Birmingham leads the cities in occupational and business licenses taxes per capita, with that revenue contributing 42% of city tax revenue.

Meanwhile, on the expenditure side, the survey reveals:

  1. The governments in North Alabama spend more than governments in the rest of the state because they operate public utilities, including municipal electricity providers.
  2. Excluding utilities, Birmingham and Bessemer, both cities that receive an influx of commuters, spend more per capita on the broad range of municipal services. That includes topping the list for per capita spending on police and fire.
  3. Oxford tops the list in per capita spending on parks and recreation. Smaller cities that report the operation of municipal sports, arts, and recreation facilities rank high in this category.
  4. The data offers the potential to track spending on municipal courts, jails, solid waste disposal, and other categories of spending, but currently, cities appear to diverge widely in how they report that information in the survey.

Working with state officials and with assistance from the U.S. Census Bureau, Alabama local governments could develop a more streamlined system for generating and reporting this data. With closer agreement on how to categorize particular revenues and expenditures, the survey could provide clearer, more actionable comparable data. The survey includes questions on debt. Better reporting of this data can provide more transparency to the public. A more robust system could also provide better accountability and oversight, potentially avoiding bankruptcy and scandal.

However, it will take leadership, likely by state officials, to gather consensus and execute a system cities, counties, and other local entities are motivated to participate in.

Read the full report here: How Alabama Taxes Compare, 2022 Edition


2021 Kids Count Data Book provides roadmap for helping Alabama children

VOICES for Alabama’s Children published the 2021 Alabama Kids Count Data Book this month. For the 6th year in a row, PARCA provided the data and analysis for the project.

Since 1994, the Alabama Kids Count Data Book has documented and tracked the health, education, safety, and economic security of children at the state and county levels.

This annual statistical portrait is meant to provide a roadmap for policymakers who seek to improve the lives of Alabama’s children.
The Data Book can be used to raise the visibility of children’s issues, identify areas of need, identify trends and measure how previous efforts are working, set priorities in child well-being, and inform decision-making at the state and local levels.

Among the findings from this year’s data, VOICES points to the following challenges we must continue to address for Alabama’s children and families:

– Child Care: There are only 1,855 licensed child care providers in Alabama to support the workforce of today and tomorrow.  Lack of quality child care is a leading reason for decreased workforce participation. Further, babies need quality care and education as their parents work and their brains develop in pivotal years.

– Health: During a youth mental health crisis and increased family stress, there is 1 mental health provider available for every 923 Alabamians. The latest research shows that unaddressed childhood trauma and Adverse Childhood Experiences (ACEs) lead to lifelong chronic health issues, along with significant barriers to educational achievement and financial security.

– Economic Security: While 16% of Alabamians live in poverty, 23.9% of Alabama children live in poverty (ex. a household of 4 making $24,750 or less). Further, 1 in 5 children in Alabama are food insecure.

– Education: Poverty leads to significant disparities in education. For Alabama 4th graders in poverty, only 37.9% are proficient in reading and 12.1% are proficient in math.

–  Safety and Permanency: In 2021, 3,453 children entered foster care. While cases can have multiple causes of entry, 48% of cases involved parental substance abuse.

See how children in all 67 counties of our state are faring in education, health, economic security, and more.

Access the 2021 Alabama Kids Count Data Book here.


ACT Scores Down Only a Fraction For the Class of 2021, Despite Pandemic

The average ACT score for students graduating from Alabama’s public high schools in 2021 was down only slightly, while the national average score fell more steeply, a fact that could be considered a victory in the light of the challenges faced by students and educators during the pandemic. Still, Alabama’s 2021 ACT results continue a downward drift from their peak in 2017.

Alabama’s average score, 18.6 on a 36-point scale, shouldn’t be directly compared to the national average score. Alabama tests virtually all its public high school students, while only 35% of students take the ACT nationally. In states where the test is not universally given, only students planning to go to college take the test, which tends to push up the score. The national average score fell from 20.6 in 2020 to 20.3 in 2021. Among states that tested 100% of students, Alabama maintained its relative performance rank, behind Kentucky, Tennessee, and Arkansas but ahead of Mississippi and Louisiana.

Downward pressure on scores was expected. The pandemic led to the cancellation of several administrations of the ACT. Schools across the country operated virtually during the spring of 2020 when the students in the class of 2021 were juniors. Altered forms of schooling persisted into the fall of 2020. In normal circumstances, some students take the test more than once, attempting to boost their scores. That happened less with the Class of 2021. According to ACT, only 32% of students took the ACT more than once compared to 41% of the 2020 cohort. That drop was likely because most universities suspended the requirement of taking the ACT due to the disruptions.

In addition to the fractional drop in the average scale score for Alabama students, the percentage of students scoring college-ready in all subjects declined. In 2021, only 15% of students scored at or above the college-ready benchmark in all four tested subjects, compared to 16.3% in 2020 and 18% in 2017. According to ACT, students who meet a benchmark on the ACT have approximately a 50% chance of earning a B or better and approximately a 75% chance of making a C or better in a corresponding college course. ACT is primarily geared toward measuring readiness at four-year colleges and universities.

On each of the four subjects that ACT tests — English, math, reading, and science — student scores ticked down a fraction.

Some points of interest arise when delving more deeply into the numbers. Scores for white students declined in every subject while Black students held steady in reading and science. Hispanic students posted an improvement in English and science. Scores rose for both economically distressed and non-economically distressed students, an unexpected result considering that scores overall were down slightly. That may be explained by more students being classified as economically distressed due to the lingering economic consequences of the pandemic. Some students who had typically been in the non-economically distressed category likely shifted into the economically distressed pool, which can push up the scores of the economically distressed pool.

The stubborn score gaps between economic and demographic subpopulations persisted in 2021. Asians outperformed all other subgroups.

Due to the score gaps between students from different backgrounds, the demographic composition of the student body should be taken into account when evaluating a school or system’s performance. The scatterplot presents score performance in the context of the economic composition of the school system’s students.

Systems with a high percentage of non-poverty students are on the right of the scale, while schools with high poverty percentages are on the left. The higher the average scale score for the system, the higher the system appears on the graph. The line of prediction plots the expected performance level for a system considering the economic composition of the student body. Scores increase as the percentage of non-economically distressed students increase. Systems are grouped along that line of prediction, indicating a correlation between the average scale score in the system and the economic makeup.

Systems above the prediction line have outscored expectations based on economics.

A similar pattern can be seen in the array of individual high schools. However, there is more variation from the average. Taken together, the graphs tell us that the socioeconomic composition of a school influences the average score, but that systems and, to an even greater degree, individual schools do make a difference in student performance.

Bearing that in mind, PARCA’s visualizations of the 2021 ACT results allow the viewer to explore how their local schools and systems performed relative to others. Viewers can choose schools and systems that provide appropriate peer comparisons. In addition to comparisons by average scale score, additional views offer results by the percentage of students achieving the benchmarks in each subject. Lower poverty systems serving suburban communities tend to show the best results at the system level.

At the school level, the highest average performance is found not just among those suburban systems but also in magnet high schools in larger systems, like Montgomery County’s Loveless Academic Magnet Program (LAMP) and Huntsville’s New Century Technology High School.

To put ACT scores in perspective, it is helpful to know the typical ACT scores for students entering college. Average scores range widely between colleges and within colleges. In Alabama, the mid-point ACT score for entering students ranges from 28 at the University of Alabama in Huntsville and Auburn University to 17 at Alabama A&M in Huntsville and Alabama State in Montgomery. As part of their mission, these historically-Black universities provide opportunity and access to students who may not have received the same level of college preparation. Many colleges have continued to waive the ACT requirement for admission and are instead relying on high school grades and other factors to assess student readiness. However, ACT scores can still play a role in admissions and in the competition for scholarships.