Work Readiness Test Results Affected by Covid and the Now-Optional Nature of the Test
Between 2015 and 2019, an increasing number and percentage of Alabama students earned high marks on the ACT’s WorkKeys, a standardized test designed to measure skills in workplace applications of reading, math, and graphical literacy. Results for the Class of 2020 can’t be compared to those prior years for two reasons:
The test is now optional, and a much smaller percentage of 2020 seniors students took it.
The Covid-19 pandemic canceled the spring window for retesting, an opportunity that usually led to higher scores.
So, within the senior class that graduated in 2020, 80% of high school seniors took WorkKeys compared to 93% of seniors the previous year. Those that take WorkKeys are awarded a National Career Readiness Certificate, the highest scoring earn a Platinum, with Gold, Silver, and Bronze level following down the scale. Of those who did take the test in 2020, 59% scored at the Silver level or above, compared to 66% for the Class of 2020.
Earning a Silver certificate or above on WorkKeys is one of the six ways an Alabama high school senior can prove that they are college and career-ready. Some systems made the test optional for students who had already demonstrated college and career readiness through qualifying ACT or AP scores, students who would have likely performed well on WorkKeys.
WorkKeys, as it is administered to high school seniors, consists of three tests: Applied Math, Workplace Documents, and Graphic Literacy. ACT works with employers to evaluate jobs and determine the level of reading, math, and comprehension skills each job requires. Research from ACT finds that someone earning a Silver-level WorkKeys certificate would have the basic skills necessary to function in 69% of the jobs they have profiled.
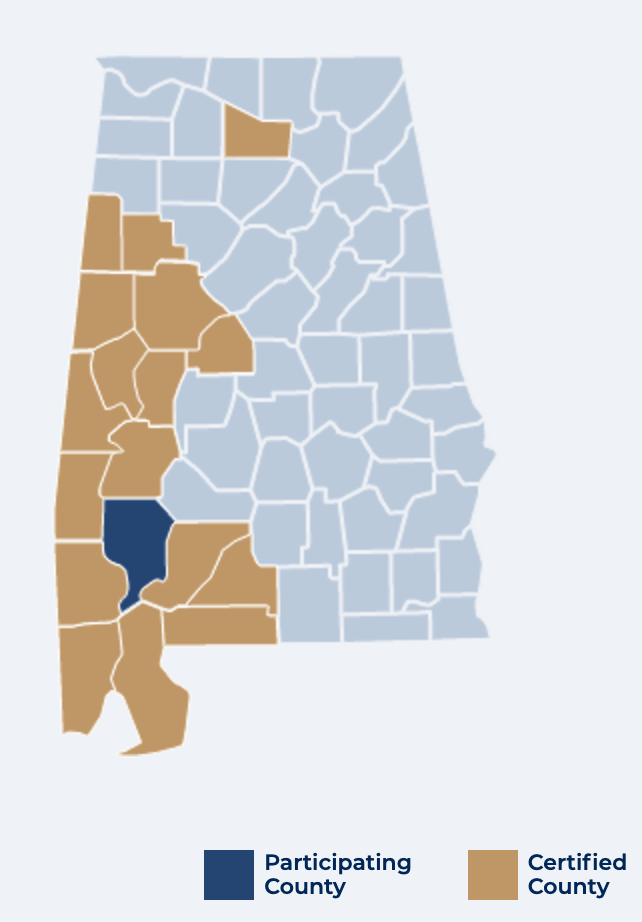
In West and Southwest Alabama, where economic development organizations have worked to familiarize businesses with WorkKeys, the credential is valuable. Employers, particularly in manufacturing, regard the scores as an indicator of a candidate’s ability to effectively function in the workplace. A student can use the credential when applying for a job with those employers that recognize what the credential means. The map depicts the counties that have worked with ACT to document the WorkReady credentials of their workforce and to educated local employers about the test.
However, in other areas of the state, where fewer employers are familiar with WorkKeys, and in school systems where almost all of the students are going to a four-year college, the WorkKeys assessment can be viewed as extraneous. In 2020, in Mountain Brook and Vestavia Hills, for instance, only 25% of the students opted to take the test in 2020.
Because the pool of students taking the test was significantly altered, the results shouldn’t be considered as part of a trend or a statewide indicator of performance. However, in schools and systems where almost all students take it, the information can be useful for communities evaluating the level of preparation the students are receiving.
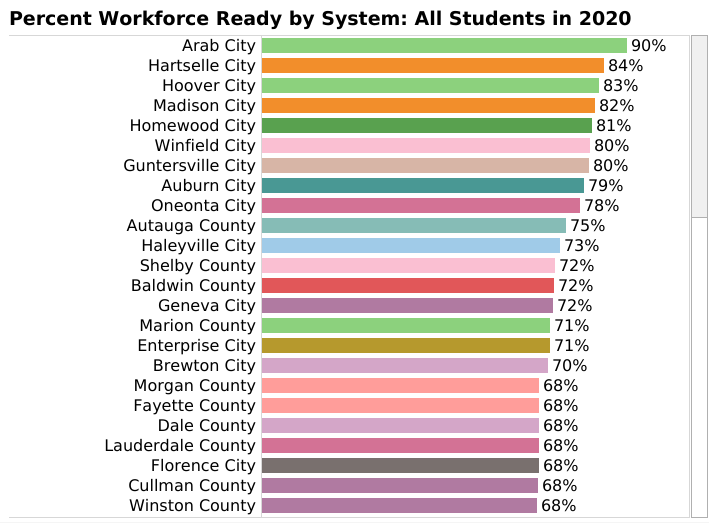
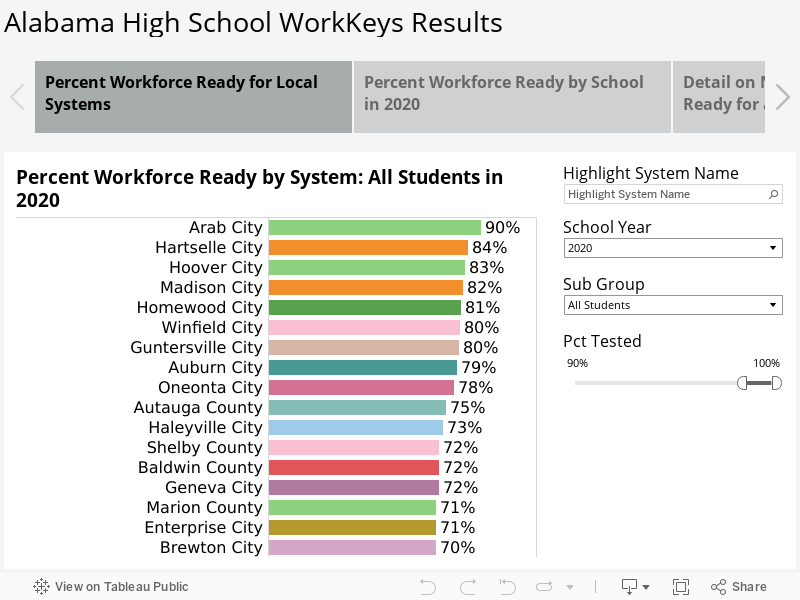
The different nature of the WorkKeys test has tended to allow a slightly different set of schools and systems to show up as top performers in the state. In 2020, the top-performing system was Arab City Schools, where 90% of students scored earned a Silver or better. Hartselle City Schools placed second, with 84% of students scoring Silver or above. The default listing in the visualization shows only systems in which 90% of students took WorkKeys. The slide allows the viewer to adjust that percentage. Other controls allow exploration of other views of the data, changing the year, or looking at the results for a particular demographic subgroup.
Looking at the performance of individual schools, a familiar pattern is apparent. Magnet schools from the Montgomery, Huntsville, and Birmingham school systems top the list. But joining them in the Top 10 are Arab High School, Marengo County’s Sweet Water High School, Autauga County’s Billingsley High School, Fairhope High School, and Hoover’s Spain Park.
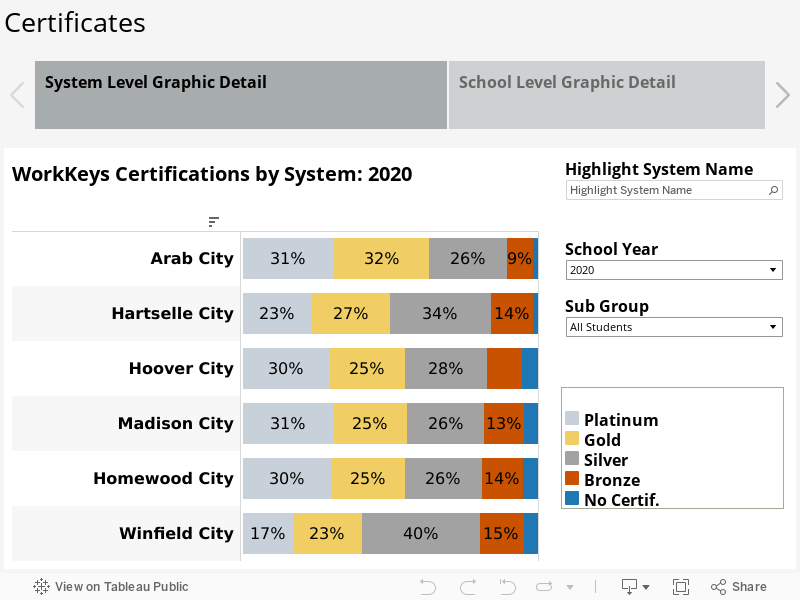
For a more fine-grained look at performance, the chart below breaks down the percentage of students scoring at each level on WorkKeys, ranging from the percentage earning a Platinum-level certificate to the percentage of students who took the test but failed to earn a certificate. Other views of the data are also available through the tabs at the top of the visualization.
Alabama Public Opinion Survey 2021
PARCA’s 2021 public opinion survey finds a growing majority of Alabamians support spending more on education but a lack of consensus on how to pay for the increase.
Among the findings:
Taxes
61% of respondents say upper-income Alabamians pay too little in state taxes. The percent of respondents who believe upper-income earners pay too little increased by 10% from 2020.
53% say lower-income earners pay too much, up from 40% in 2016.
49% say they pay the right amount of taxes, compared to 57% in 2016.
Despite Alabama’s low per capita tax yield, 69% of residents believe they pay the same or more taxes than people like themselves in other states.
Public Education
Alabamians believe education is the most important service state government provides, but its lead over other services is declining.
44% rank education as the most important service, while 31.3% rank healthcare No. 1.
78% believe the state spends too little on education, compared to 74% in 2019 and 68% in 2013. Large majorities in every subpopulation have this belief.
69% support increasing taxes to support education, but no single tax increase option garners majority support.
This year, respondents were asked what supplemental programs might improve education. No program received a majority response, but the top priorities were expanded tutoring, increased technology funding, and more mental health counseling.
When asked what respondents’ top priority for new education funding would be, the highest percentage (41%) said that new revenue should go to increasing salary and benefits for teachers
59% say local boards of education are best suited to decide how education dollars are spent.
Respondents believe that the local board of education are best suited to decide school spending, school policy, and school closings.
Other notable education findings:
77% believe that taxes on Internet sales should be distributed to local schools in the same way as sales tax revenue from brick-and-mortar sales.
Alabamians are almost evenly split on tax-funded vouchers to pay for private school tuition. However, 61% of Alabamians believe vouchers, if allowed, should be available to all students.
Trust in State Government
Alabamians’ trust in state government improved slightly compared to 2019 but is still well below rates reported in the early 2000s.
77% support keeping the General Fund and Education Trust Fund separate, down from 80% in 2020 and 82% in 2019, but still well above the 69% reported in 2016.
63% believe state government officials do not care about their opinions, down from 66% last year. This compares to a low of 55% in 2008 and a high of 74% in 2010.
61% believe they have no say in state government, up from 55% last year, but well above the low of 43% in 2008.
Deaths Exceed Births but Surge in Domestic Migration Powers Alabama Population Growth
Recent data from the U.S. Census Bureau indicate a growing number of people moving to Alabama prior to the Covid pandemic, which helped offset population loss due to a rising death rate and declining birth rate. The estimated number of net new domestic migrants was 13,115 in 2020, the largest inflow of the decade.
That estimate data, released earlier this month, is generated annually by the Bureau. Those estimates use the 2010 Census count as a base and attempt to capture population change by tracking births, deaths, and migration. The actual census count, conducted in 2020, showed even stronger growth than the estimates have indicated.
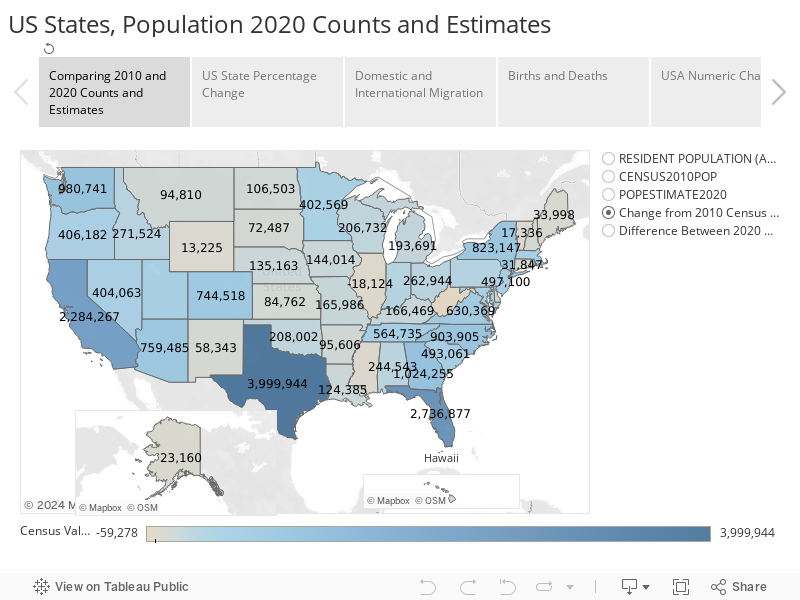
By April 1, 2020, Alabama’s statewide population had climbed above 5 million, according to the official 2020 Census enumeration. That total, 5,024,279, exceeds by more than 100,000 the Census Bureau’s estimate of Alabama’s population for July 1, 2020. Going forward, estimates will be re-calibrated using the Census count as a basis. On the basis of the count, Alabama kept all seven U.S. House Districts. According to the official Census count, Alabama added 244,543 residents since 2010.
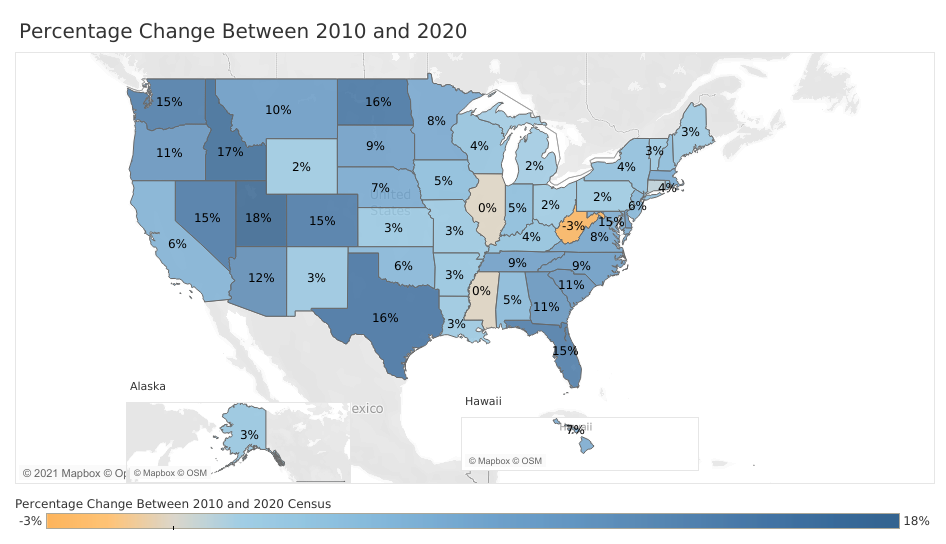
According to the counts, Alabama’s population grew by 5% from 2010 to 2020. The Carolinas, Tennessee, and Georgia grew at about twice that rate, but Alabama grew faster than Mississippi, which lost population, and Louisiana and Arkansas, both of which grew at a rate of 3%. Florida’s population grew by 15%, adding a staggering 2.7 million new residents.
Components of Change
Though Census population estimates were off compared to the actual 2020 count, the estimates and components that drive the estimates provide insight into the drivers of population change in Alabama throughout this past decade. The newest estimates, released earlier this month, and the estimates from prior years present some patterns:
Over the course of the decade, Alabama birth rates fell, and death rates climbed as the population aged.
International migration provided growth in the early part of the decade.
As international immigration faltered in the final years of the decade, domestic migration to Alabama surged.
Aging and Fertility
The most fundamental elements of population change are births and deaths. Census estimates are based on the number of birth and death certificates issued, with some short-term projection built-in since there is a two-year lag in getting the actual county-level data..
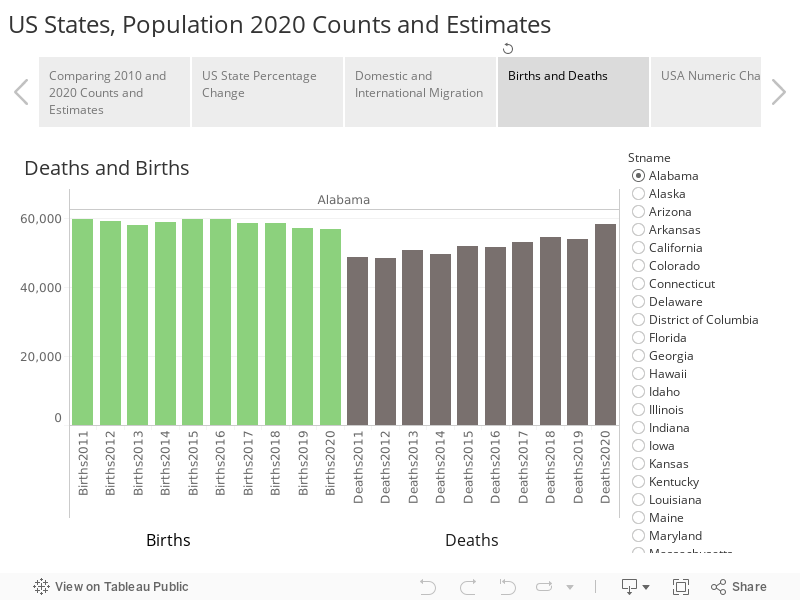
According to Census estimates, over the course of the decade, Alabama and the U.S. saw a decline in the number and rate of births and a rise in the number and rate of deaths. For the first time in 2020, the Census Bureau estimated that more people died in Alabama than were born.
If the estimates accurately captured the trend, deaths will likely exceed births in Alabama again in 2021. The math that drives these numbers has to do with the size of generations and the size of families. Members of the Baby Boom Generation, the extra-large cohort born between 1945 and 1965, have entered years of increased mortality, causing a rise in the death rate. Meanwhile, younger generations, with fewer members, have had children later in life and are having fewer children. In addition, the Covid-19 pandemic led to increased mortality, between March and July 1, 2020. The Census Bureau made a national-level adjustment for increased mortality from Covid-19 between March and July of 2020. That will factor into population change this year as well.
But the effects of these changes in fertility and mortality play out unevenly across the U.S. and across Alabama counties. Places that have attracted younger residents have a lower median age and a higher share of births. Places that are losing population tend to retain a higher share of older individuals and consequently see higher death rates. Birth rates are highest in the counties with urban centers, or universities, or cities’ suburbs. Death rates are highest in rural communities where the population is older. The social, ethnic, and racial composition of a community affects birth rates as well. Hispanic and Black families tend to have more children.
The visualization above allows you to explore how the differences play out in different states. The visualization below allows you to explore those differences among Alabama counties.
For example, Blount County has a pattern that reflects the state as a whole. However, using the selector on the right, toggle to Madison or Shelby County, and observe a different pattern: The number of deaths is still rising, but so is the number of births as young families move in, producing a positive rate of natural increase. Conecuh County, by contrast, shows a steep fall in births and a rise in deaths, producing a population decline through natural factors.
Migration
Beyond births and deaths, population change is driven by who is moving in and who is moving out, measures of migration. The Census Bureau develops estimates of movement within the United States (domestic migration) and between the U.S. and other counties (International migration). Over the past decade, general regional migration patterns emerged: Southern and Western states have gained through domestic migration. Northeastern states and California have gained through international migration. Rural counties in the interior South, Rust Belt, and the Plains States have seen moderate growth or some population decline. In the end, all states except Mississippi, Illinois, and West Virginia added population between 2010 and 2020, with gains concentrated in the cities and metropolitan, suburban counties, and retirement and recreational destinations.
According to the estimates, Alabama experienced two different periods of migration since 2010. In the first part of the decade, rising international in-migration offset weak growth and even population loss through domestic migration. Over a span of years, Alabama had more residents moving away than arriving from other states. But late in the decade, those factors flipped: a surge in domestic in-migration replaced faltering international immigration as the driver of population change.
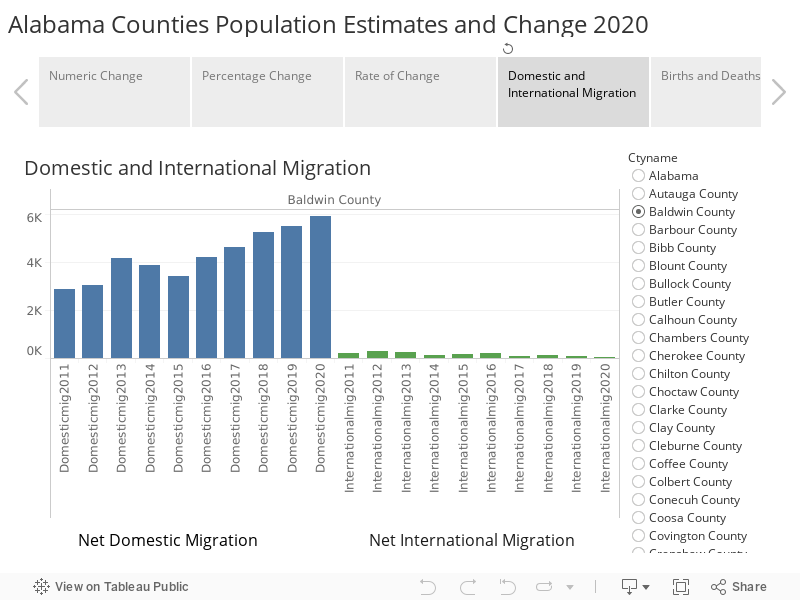
Time will tell whether that surge in domestic migration will resume or even accelerate after the Covid pandemic. Early indications suggest it might. Unemployment in Alabama is down close to pre-pandemic levels, historic lows that should attract movers. There are indications that movements already underway are continuing and even accelerating. The Wall Street Journal analyzed data from permanent change of address forms filed with the U.S. Post Office. The results suggest that during the pandemic, there has been a movement out of dense urban areas in the Northeast towards the South and toward smaller metros and suburbs. The pandemic has accelerated retirements and migration to retirement destinations, adding fuel to the strong growth in Alabama’s Baldwin County, for instance.
As has been the case throughout the decade, estimates indicate that most of the growth in Alabama is occurring in a handful of counties, led by Baldwin and Madison, home to Huntsville. A second tier of growth magnets consists of Lee County, home of Auburn University; Shelby County, south of Birmingham; Limestone County, adjacent to Huntsville; and Tuscaloosa, home to the University of Alabama.
In the estimates for 2020, more counties in Huntsville’s orbit, including Colbert and Lauderdale in the Shoals and Morgan, are showing population gains. Meanwhile, in Southeast Alabama, counties around Dothan, including Houston and Coffee, appear to be picking up residents, as well.
Jefferson, Montgomery, and Mobile counties all lost population in 2020, according to the estimates. All three counties have been net exporters of domestic migrants throughout the decade but have made up for the loss through natural increase and the arrival of residents from other countries. However, with the clampdown on immigration during the Trump years, made even more acute by the pandemic, all three counties saw sharper losses. That was particularly true in Jefferson, which had a rising number of deaths, a lower number of births, a depressed level of international immigration, and a higher net loss through domestic migration. Jefferson was estimated to have 3,197 fewer people living in the county in July 2020 than in July 2019, the biggest numeric loss among Alabama counties.
Dallas County continued to lose population with an estimated 1,084 fewer residents in 2020. According to the estimates, Dallas County had a population of 36,098 in 2020, a cumulative loss of 7,715 people since 2010. Dallas experienced the second-fastest rate of decline since 2010, 17.6%, among Alabama counties. Only Perry County, at 17.9%, had a greater rate loss. Perry’s population, estimated at 8,698 in 2020, is second lowest in Alabama, outranking only Greene County’s 7,990.
Prior to the pandemic, with unemployment at a historic low, Alabama was on the verge of a labor force shortage. Perhaps in response, the state appears to have begun drawing increased numbers of new residents. For Alabama to reach its economic potential, the state will need to continue to draw migrants. The existing population is aging, with the Baby Boom generation headed for retirement.
Drawing more workers into the state may help Alabama meet the goal established for the state workforce system: add 500,000 highly-skilled workers to its workforce by 2025. But reaching that goal will also require bringing more Alabamians back into the workforce, increasing labor force participation by increasing access to training and education.