2019 ACT WorkKeys: Preparing Students for Work in a Time of Uncertainty

High school seniors and recent graduates are preparing to enter a workforce that has been disrupted, hopefully only temporarily. In a matter of weeks, the nation has gone from record low unemployment to levels not seen since the Depression. Employers are adapting to a new set of work conditions and the demand for new skills appropriate for remote work is rapidly rising.

The WorkKeys Assessment may now be more valuable than ever in helping employers assess the practical skills and adaptability of potential hires.

WorkKeys Assessments in Alabama

WorkKeys is a standardized test given to 12th graders in Alabama public schools. The assessment is meant to measure skills relevant to many of today’s work environments. This is a test that generates positive results in Alabama with steady progress.

WorkKeys is one of the measures through which a student can be designated as College and Career Ready in the state. They may not have the specialized training needed for particular occupations, but if a student earns a certification at the higher levels, the measure should increase the confidence of employers in hiring staff who are adept at applying useful cognitive skills and knowledge to applied work tasks in contemporary work settings.

The Assessments. The assessments consist of three tests of applied cognitive skills which are relevant, according to ACT’s research, to over 20,000 occupations:

  • The Applied Math test
  • The Graphic Literacy test
  • The Workplace Documents test (applied reading for understanding)

Students are awarded a National Career Readiness Certification if they score a Platinum, Gold, Silver, or Bronze score on the WorkKeys. Platinum is the highest level, followed by Gold, Silver and Bronze.

After modifications to the 2018 assessment created significant fluctuation among the different certificate levels, the results in 2019 showed steady gains in the Platinum and Silver levels, and slight decreases in the percent of students earning Gold and Bronze certificates, as well as the percent of students not receiving any certificate.

In Alabama students earning a Silver certificate or above are considered career ready.

Highlights of the WorkKeys test results for the Class of 2019 include:

  • 66% of Alabama high school graduates were deemed workforce ready as measured by the ACT WorkKeys assessment, an improvement over 64 % in 2018.
  • At 94%, Hartselle had the highest percentage of workforce-ready graduates, as measured by WorkKeys.
  • The Silver Certificate continues to be the level with the highest percentage of students.

WorkKeys is emerging as another source of information for making employment decisions and helping prospective workers learn about strengths and weaknesses and opportunities for growth. Using job profiling data provided by ACT, the Alabama Department of Labor maintains data listing the median WorkKeys scores for high demand occupations requiring an associate’s degree or less.


2019 Assessment Results

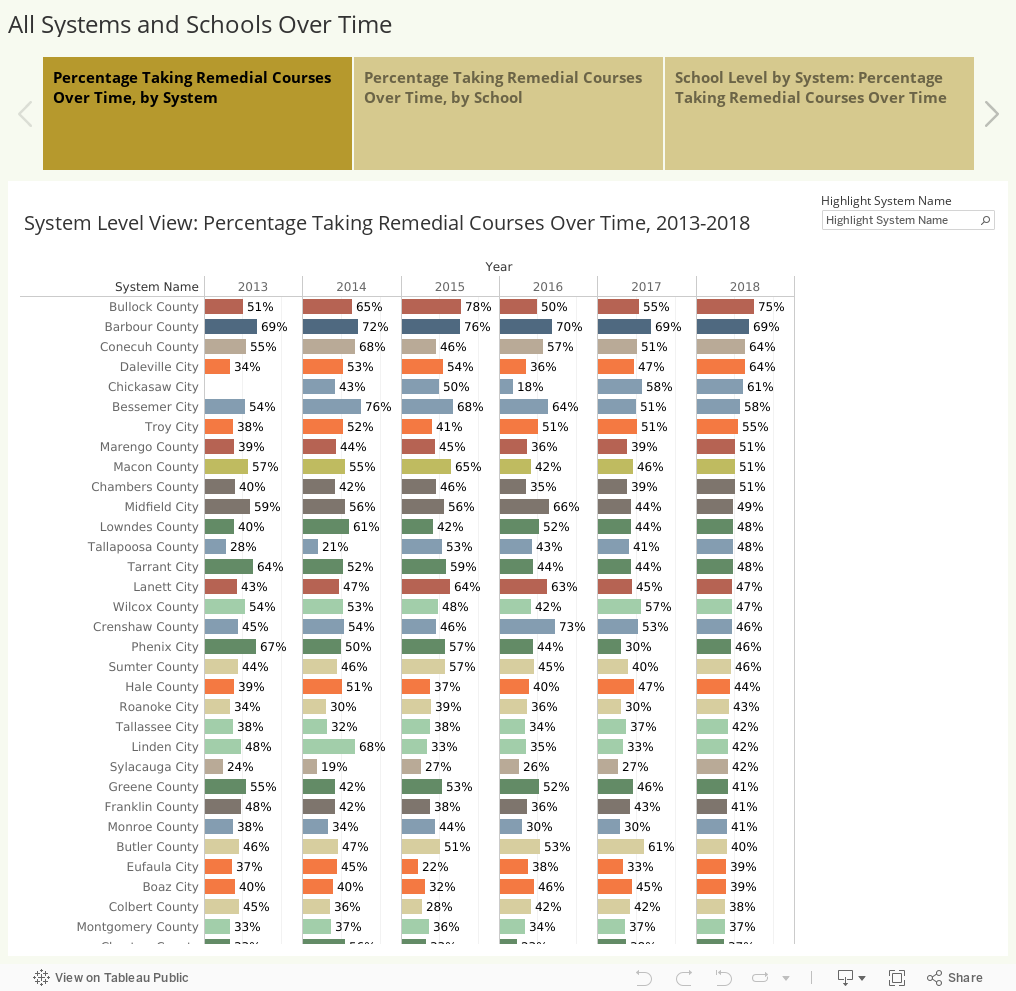
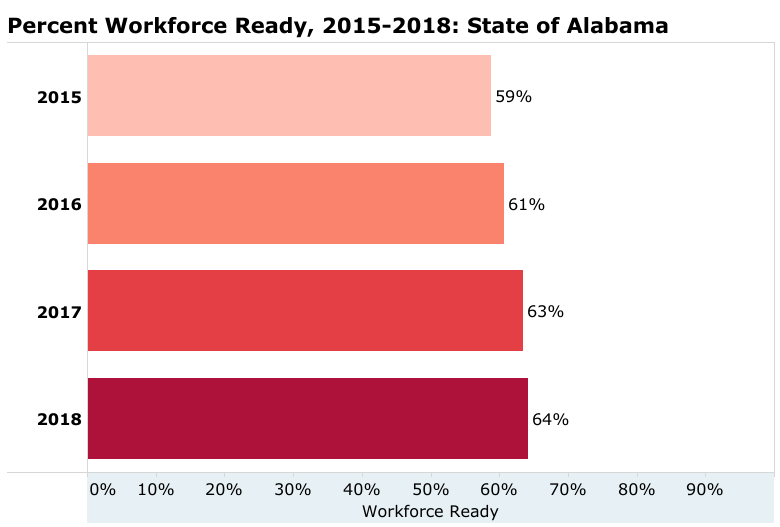
The following charts show the percentage of graduates in Alabama who demonstrated workforce readiness on WorkKeys assessments.

Percent Workforce Ready Increased in 2019.

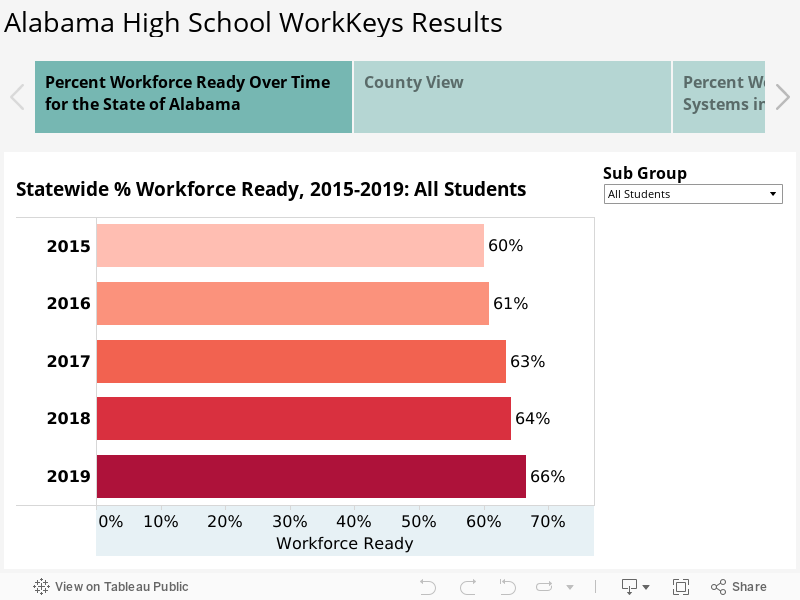
In 2019, 66% of high school graduates taking the assessment were deemed workforce ready. This percent has steadily increased since 2015.

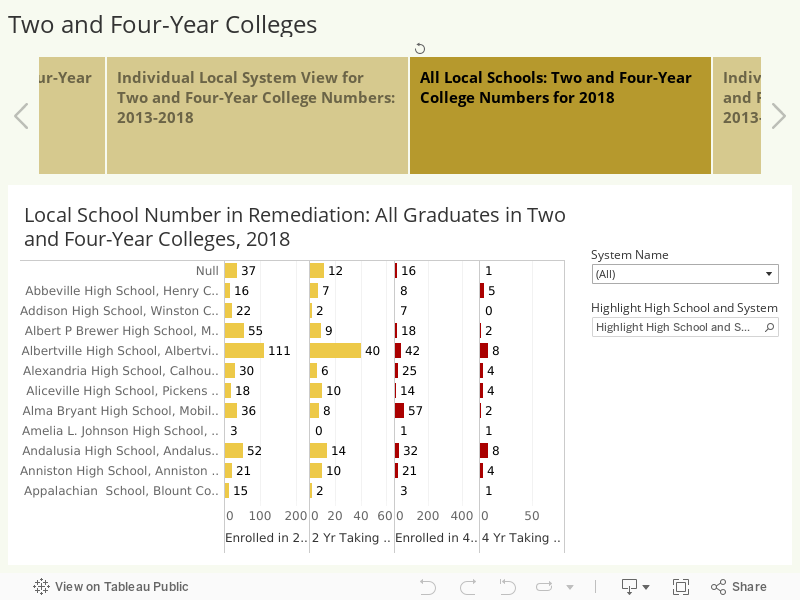
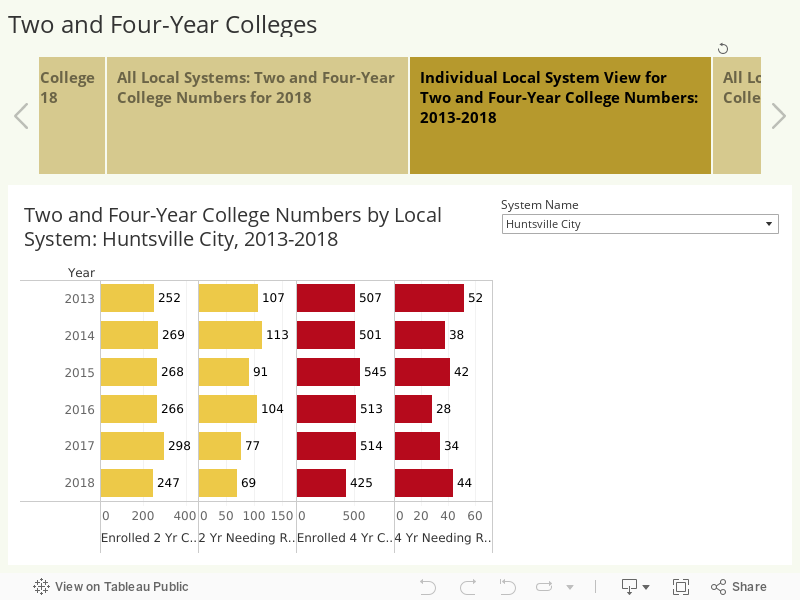
Workforce Ready at the Local Level  

The following charts focus on workforce readiness among graduates at the local level. A county view is appropriate when thinking about the quality of a local workforce.

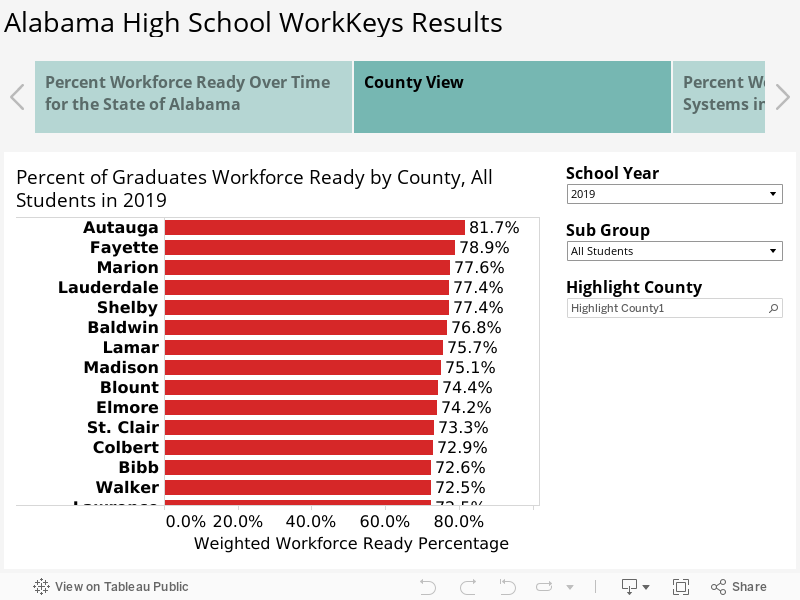
Of course, local school systems and schools are the places where students develop knowledge and skills related to work readiness.

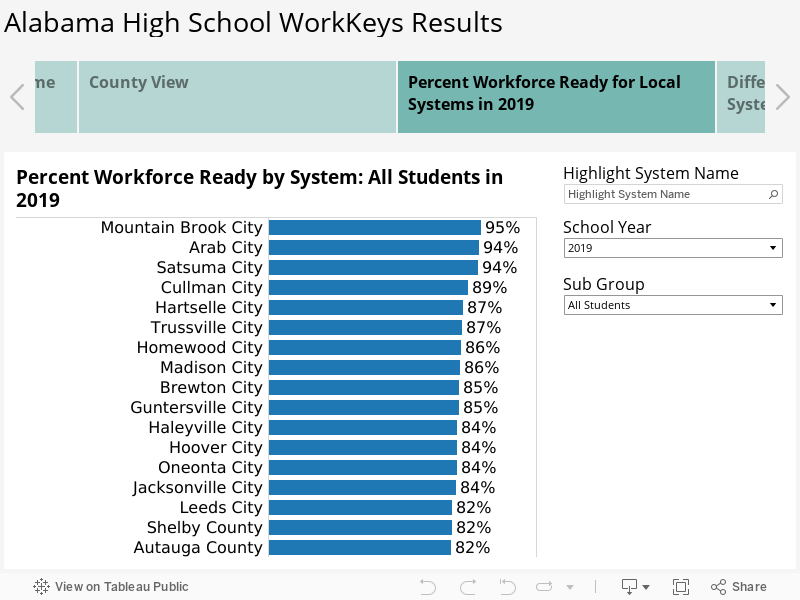
Listed below are the top ranked systems based on workforce readiness assessed through WorkKeys:

  • Mountain Brook City – 95%
  • Arab City – 94%
  • Satsuma City – 94%
  • Cullman City – 89%
  • Hartselle City – 87%
  • Trussville City – 87%
  • Homewood City – 86%
  • Madison City – 86%
  • Brewton City – 85%
  • Guntersville City – 85%

Mountain Brook has made positive gains over the past two years and appears to remain committed to WorkKeys as a valuable assessment.

With committed effort, WorkKeys is an assessment where systems can show growth, as demonstrated by a variety of systems and schools in Alabama.

A number of large and medium-sized systems made noteworthy gains over 2018. Auburn City topped all, showing remarkable gain (up by 24 percentage points).

Among the schools, Loveless Academy continued its top ranking with 100% of students deemed workforce ready. Top schools include:

  • Loveless Academic Magnet High School, Montgomery County – 100%
  • New Century Technology Magnet High School, Huntsville City – 95%
  • Mountain Brook High school – 95%
  • Brewbaker Technology Magnet High School, Montgomery County – 94%
  • Arab City High School – 94%
  • Ramsay High School, Birmingham City Schools – 94%
  • Satsuma High School, Satsuma City Schools – 94%

A number of large and moderate sized high schools experienced positive gain over 2018. This is an area of growth for a number of schools failing to show gains in more purely academic assessments.

Change in Certificate Levels

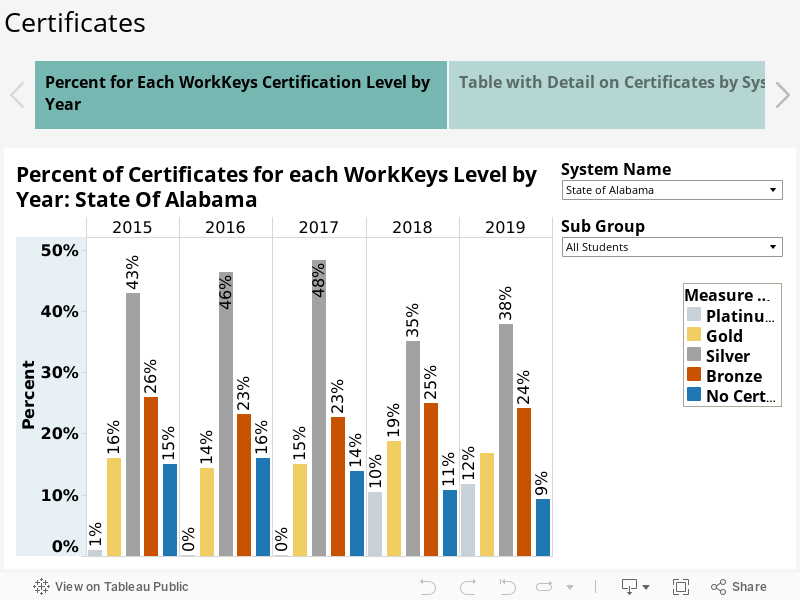
Students are deemed workforce ready if they achieve certification at the Platinum, Gold, or Silver levels. The charts show that the percentage of students at the Gold and Silver levels increased moderately from 2015 through 2017, with Platinum barely making a dent. After modifications to one of the tests in 2018, Gold and Platinum level certificates grew substantially, while Silver certificates dropped significantly. The percent at each level in 2019 is comparable to 2018, but with positive gains in Platinum and Silver. The percent of students at the lowest level, with no certificate, continues to drop.

Overall, this resulted in a higher percent workforce ready for the state, with a positive trend toward higher certification levels. 

Change in Certificate Levels at the System Level

Platinum: Mountain Brook and Homewood City finished in a tie with the highest percent of Platinums, followed by Madison City, Hoover, Hartselle and Arab City. Aburn City climbed up in 2019 to join these state leaders.

Gold: Oneonta, Arab, and Mountain Brook are the systems with the highest percentage Gold. Though the majority of systems decreased at the Gold level, a number of systems increased their percentage. Leading the way in percentage point gain was Chickasaw City and Jacksonville City, followed by Piedmont City and Talladega County. Arab City continues to show nice gains as well.

Silver: This is the minimum level to be counted as workready. A number of less affluent systems are among the leading systems for Silver certificates. Systems with the highest percentage at this level include Opp City, Satsuma City, Haleyville City, and Lamar County. The vast majority of systems increased in the percentage of students earning Silver certificates in 2019, led by Opp City.

Subgroup Analysis

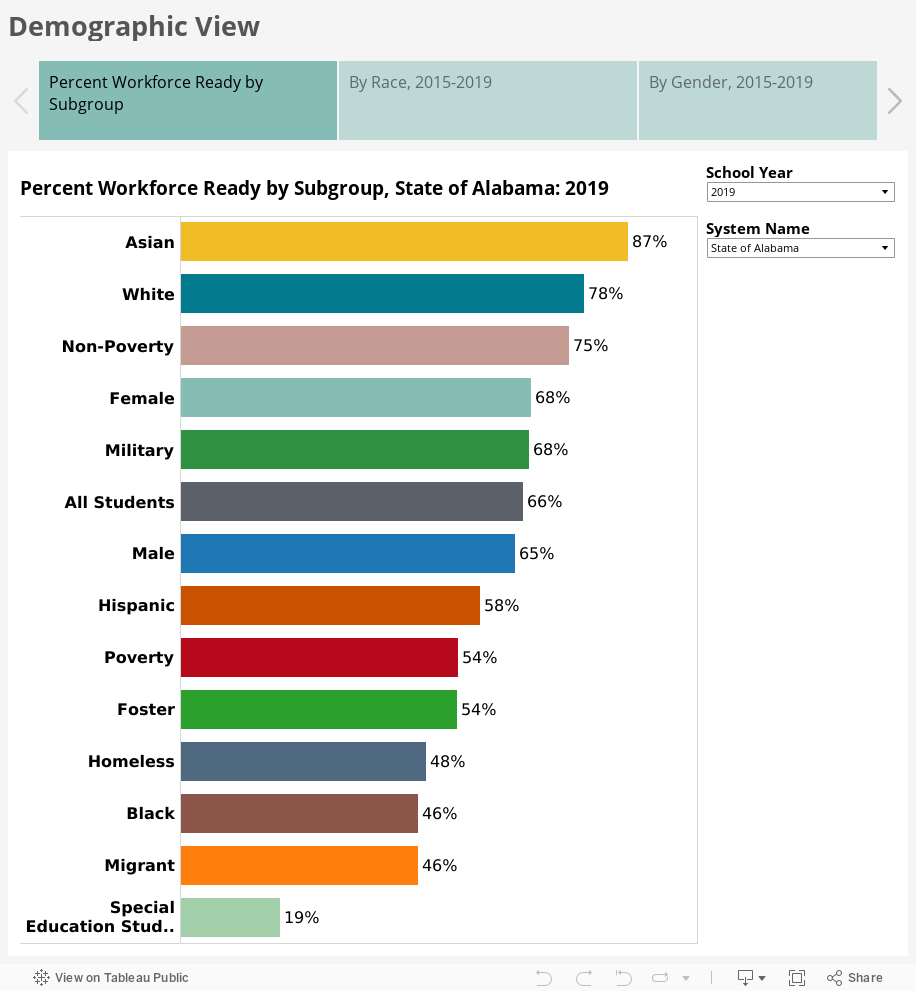
Analysis of subgroup results shows a continuing disparity between subgroups. Use the filters to see how systems differ in subgroup performance. Some schools may be better at assisting struggling groups than others.

The highest performing groups include students who are Asian, white, non-poverty, female, and military-affiliated. The lowest-performing groups are black, migrant, and special education. While all of the racial groups are increasing their percentage of workforce ready, black students have made the most gain since 2015.

Females continue to outperform male students, though both have shown comparable positive growth since 2015.

In looking at trends, all racial groups are showing progress from year to year, especially Asian and black students.

Finally, special populations are also showing positive growth in workforce readiness, especially students qualifying for free lunch (poverty) and students living in foster homes.

Discussion

The 2020 report, Education Matters, written by PARCA on behalf of the Business Education Alliance, recommends increasing the awareness of WorkKeys as a valuable tool for employers, communities, and schools.

In addition to the assessments, WorkKeys provides a full suite of resources that can help provide training for teachers, test preparation for students, and design career-related curricula to help students improve their “hard” and “soft” skill levels. ACT Career Ready 101 is designed to help teachers bring work readiness skills into the classroom. This raises questions about how students become workforce ready in school. Beyond special resources for preparation, is the curriculum and content delivered in schools changing to strengthen career readiness, even in traditional academic subjects?

The long-term future of WorkKeys will be determined by the continuing value educators give to these assessments and suite of resources, and the degree to which employers value WorkKeys. A growing number of communities and employers are aware of the utility of WorkKeys, but this still varies across the state. Currently, schools also vary in the degree to which they emphasize WorkKeys.


College Freshmen in Need of Remedial Education

The percentage of first-time college students from Alabama public high schools assigned to remedial courses in math and English has continued to drop overall and, in the most recent data available, dropped dramatically for those attending two-year colleges, according to data from the Alabama Commission on Higher Education (ACHE). Graduates studying in four-year colleges needing remediation increased for the first time in several years. 

The data follows Spring 2018 graduates of Alabama high schools who enrolled in Alabama public colleges in the fall after graduation. The data shows that 26% of those who enrolled in higher education were required to take a course in either remedial math or remedial English or both. That’s down from 32% five years ago.

Remedial courses are primarily offered in English and math. They are designed to bring students up to the educational level needed to succeed in a college course. Students assigned to remedial math and English cannot proceed on to college-level courses in those subjects until they have passed the remedial courses. Colleges vary in the degree to which they allow students to take courses in other subjects simultaneously with their remedial courses. Some students enter with a poor background in one of these subjects but not the other. Some may have a specific learning disability in math, for example, or just never gained the foundation needed for higher math, but excel in English and other courses.

Interactive charts are presented below. Each panel presents a different view with the capacity to drill down from the state level to the system and school level, and for schools within a system. Bear in mind that the ACHE report only captures high school graduates who enrolled in the fall after their graduation in Alabama public colleges. The remediation rates for schools that send significant numbers of students to private colleges or to out-of-state colleges will not necessarily reflect the outcomes for the entire graduating class.

A higher percentage of students take remedial math than remedial English. But the progress shown for math over the past year, down from 24% to 21% in remediation is significant, given that in the past English has shown more improvement. The percentage of students taking remedial English remained the same at 12%.

At this point, both subjects have made similar progress in reducing the percentage of students taking remedial courses. Math dropping from 26% in 2013 to 21% in 2018, and English dropping from 17% to 12%. Check it out in the charts. and use the filters to drill-down and make comparisons.

The next set of charts provide remediation rates for all systems and schools in math and English over time.

Finally, take a look at the numbers in two-year and four-year colleges.

Thirty-three percent of Alabama’s high school graduates enrolling in the state’s public two-year colleges were assigned to remediation in 2018, a significant decrease from 41% in 2017. Since 2013, that percentage has dropped from 46% to 33%.

At the same time, remediation among Alabama’s high school graduates attending four-year colleges increased to 18% in 2018, up from 14% in 2017, and 17% in 2017. This reverses a downward trend and becomes the highest percentage assigned to remediation in the state’s four-year colleges over the past six years.

Over time, approximately 75% of Alabama’s high school graduates assigned to remediation attend the state’s public two-year colleges, and 25% attend the state’s public four-year colleges. This ratio has remained steady for years, but these numbers began to shift in 2018. The ACHE data shows that for 2018, two-year colleges account for 65% of graduates taking remedial courses and four-year colleges up to 35%.

This may be an anomaly in which 2018 is a unique year for remediation patterns across these two sectors. In the future we can learn more about the degree to which this pattern holds up.

In the dashboard panels, you can explore these same data for local school systems and schools. For example, the second panel provides a comprehensive view of two and four-year college numbers for all local school systems in 2008.

This is followed by a chart showing results for individual systems over the longer period, 2013-2018. In the case below the filter is selected for Huntsville City Schools.

The fourth panel provides a view of these numbers for all schools in 2018.

The system name filter can be used to see all the schools in a single system. This is shown for the Birmingham City Schools.

Finally, you can drill down to data over time for an individual school. Use the filters to look up systems and schools of interest to you.

Explore on Your Own

The final set of charts shows the remediation rates in math and English for all systems and schools over time.

Turning the Corner: Is Remediation Good or Bad?

A downward trend in the percentage of graduates taking remedial courses is positive. This could mean Alabama is increasing college readiness among students in its public schools, and more of those students attending college are better prepared.

Still, the downward trend in remediation is happening across the nation, and in part, reflects a movement away from using remedial courses in colleges and universities.

College remediation has come under consistent attack from critics over the last couple of decades. Research findings on their effectiveness are mixed with negative and positive results for students.

Some research has found that students taking remedial courses earn more credits and are more likely to graduate than comparable students who did not address fundamental problems through remediation. More commonly, research has found the opposite. Students who could have made progress in their curriculum were held back, lose the will to continue, and their family bears the cost. Financial assistance programs rarely pay for remedial courses. The mixed findings of these studies have fueled ongoing debate, though more rigorous research is now providing a closer look at what might really be happening.

A well designed, highly rigorous study published in 2017 by researchers at Vanderbilt and Harvard found that students who are on the margin would more than likely be better off pursuing regular college courses. Those placed in remedial courses will likely earn fewer credits over time and are less likely to graduate from college. At the same time, students on the lower end of the spectrum who are taking remedial courses will likely fare better in college than comparable students who do not take remedial courses. This was especially true for students taking remedial English.1

These are students who genuinely need a basic foundation in order to make further academic progress. Past research has documented evidence of students enrolling in four-year universities who cannot compose a complete sentence. It does raise questions about the appropriate educational route for students who lack important basic skills, but who would like to attend college. Where would these students best be served?

In response to criticism of remedial education, colleges have moved toward a broader and more complex set of resources for helping students. In this environment, remedial courses are on the lower end of a continuum of resources and strategies designed to support students experiencing challenges. The downward trend in remediation is likely in part due to remediation increasingly not being seen as the preferred alternative for students on the margin of needing assistance. The wider support now found in colleges include:

  • Comprehensive learning centers, writing centers, and math centers with mentors and tutors
  • Student learning communities
  • Peer tutoring and mentoring
  • First-year freshman seminar
  • Summer bridge program before the fall college term
  • Paired courses where students apply basic skills in one course to the content learned in another
  • Support in time management, organizational skills, resilience, and self-regulation

Unfortunately, programs vary in their effectiveness. Fewer students in remedial courses do not necessarily mean colleges are achieving higher graduation rates. But some programs are proving effective. Learning communities where students share and learn together have experienced strong success in many cases.

Still, the best medicine is a strong foundation during the pre-school through high school years, combined with strong family support.


Billions Coming to Alabama through the CARES Act

Alabama is in line to receive more than $2.47 billion from the CARES (Coronavirus Aid, Relief and Economic Security) Act signed into law by President Trump on March 27. A supplemental act passed Congress on April 23.

Below, PARCA explores key provisions of the Act, with attention to funds allocated for state and local governments and schools.

These projections do not include funds for hospitals, medical providers, airports, the value of business tax credits, or funds for expanded unemployment benefits and the Paycheck Protection Program.

The CARES Act provides $2.3 trillion in funding for individuals, schools, state and local governments, and businesses. The Act, running more than 800 pages, is complex and expansive. Many organizations and law firms have provided detailed explanations of the CARES Act and general COVID-19 responses, including:

State and Local Governments

The Act allocates $150 billion to support state and local governments’ responses to the pandemic.

State Government

Of the $150 billion, $8 billion is allocated for tribal governments, $2.5 billion for territories, and $500 million for Washington, D.C. The balance is allocated to states on a per capita basis based on population figures in the U.S. Census Bureau’s 2019 Population Estimates. Regardless of population, every state will receive at least $1.250 billion.

Based on these numbers, Alabama can expect $1.9 billion in funding. The chart below displays the total funding each state can expect.1 Alabama’s share, like all states, is reduced by the amount of funding directed to local governments.

CARES Act COVID Response Funding to State Governments

StateDistribution (billions)
Alabama$1.901
Alaska$1.250
Arizona$2.822
Arkansas$1.250
California$15.321
Colorado$2.233
Connecticut$1.382
Delaware$1.250
Florida$8.328
Georgia$4.117
Hawaii$1.250
Idaho$1.250
Illinois$4.914
Indiana$2.610
Iowa$1.250
Kansas$1.250
Kentucky$1.732
Louisiana$1.803
Maine$1.250
Maryland$2.344
Massachusetts$2.673
Michigan$3.873
Minnesota$2.187
Mississippi$1.250
Missouri$2.380
Montana$1.250
Nebraska$1.250
Nevada$1.250
New Hampshire$1.250
New Jersey$3.444
New Mexico$1.250
New York$7.543
North Carolina$4.067
North Dakota$1.250
Ohio$4.533
Oklahoma$1.534
Oregon$1.635
Pennsylvania$4.964
Puerto Rico$2.241
Rhode Island$1.250
South Carolina$1.996
South Dakota$1.250
Tennessee$2.648
Texas$11.243
Utah$1.250
Vermont$1.250
Virginia$3.310
Washington$2.953
West Virginia$1.250
Wisconsin$2.258
Wyoming$1.250
Subtotal$141.239
Territories$263
Tribal governments$8
District of Columbia$495
U.S. TOTAL$150,000,000,000

Local Governments

Local governments with populations of at least 500,000 also receive funding through the CARES Act. Local funds are deducted from their states’ shares. In Alabama, only Jefferson County meets the population threshold. Jefferson County should receive approximately $114.9 million of Alabama’s allocation, reducing the state government’s share to $1.786 billion.

Allowed Expenses

These are not insignificant amounts—$144.9 million represents 20% of Jefferson County’s FY20 budget; $1.786 billion represents 10.7% of the budgeted General Fund expenditures.

However, leaders do not have full discretion over how funds may be spent. The CARES Act limits expenditures to those that “are necessary expenditures incurred due to the public health emergency,” 2 are not included in current budgets, and are expensed between March 1, 2020 and December 30, 2020.

“Due to” implies direct and indirect expenses arising from governments’ responses to COVID-19. These include direct medical and public health expenses and economic support for affected employees and businesses. Some states allow governments to make loans and grants to businesses. A recent opinion by Alabama Attorney General Steve Marshall states that transactions are prohibited under the Alabama Constitution.3

The Treasury Department provides examples of allowed and disallowed expenditures.4

Allowed ExpendituresDisallowed Expenditures
Direct medical expensesDamages covered by insurance
COVID-19 testingPayroll or benefits expenses for employees whose work duties are not substantially dedicated to mitigating or responding to the COVID-19 public health emergency.
Emergency medical responseExpenses that have been or will be reimbursed under any federal program.
Public telemedicineReimbursement to donors for donated items or services.
Public health communicationsWorkforce bonuses other than hazard pay or overtime.
Personal Protective EquipmentSeverance pay
Cleaning and disinfecting public areasLegal settlements
Quarantine expenses
Payroll for public safety, public health, health care, human services, and similar employees responding to COVID-19
Food delivery to vulnerable populations
Facilitating distance learning for schools
Costs of sanitation and social distancing in prisons and county jails
Care for homeless populations
Unreimbursed unemployment insurance costs related to COVID-19

CARES Act funds cannot be used to offset declines in revenue, which are expected to be substantial.

Education Funding

The CARES Act provides $30.75 billion to education: $14.25 billion for higher education and $13.2 billion for elementary and secondary education.

Higher Education

Of the higher education funding, 90% is allocated directly to institutions of higher education. Allocations are based on the percentages of students receiving Pell grants. At least 50% of these funds must be used to provide emergency financial aid to students. The balance of the funds can be used for other purposes, including recouping student refunds for tuition, fees, room, and board, technology purchases for students, and additional aid to students.

Fifty-four institutions in Alabama should expect approximately $193.5 million in total funding with $96.8 million allocated to student aid.5

Public institutions are eligible for $167 million–$56.3 for two-year schools and $110.7 million for four-year schools.

Private institutions are eligible for $26.5 million.

SchoolTotal AllocationMinimum Allocation to  be Awarded for  Emergency Financial Aid  Grants to Students
Alabama Agricultural & Mechanical University$9,121,201$4,560,601
Alabama College Of Osteopathic Medicine$186,805$93,403
Alabama State University$6,284,463$3,142,232
Athens State University$845,033$422,517
Auburn University$15,769,779$7,884,890
Auburn University Montgomery$5,075,473$2,537,737
Bevill State Community College$2,642,839$1,321,420
Birmingham-Southern College$1,069,855$534,928
Bishop State Community College$2,871,392$1,435,696
Calhoun Community College$4,392,248$2,196,124
Central Alabama Community College$1,222,052$611,026
Chattahoochee Valley Community College$1,645,716$822,858
Coastal Alabama Community College$4,437,762$2,218,881
Drake State Community And Technical College$761,763$380,882
Faulkner University$2,422,978$1,211,489
Enterprise State Community College$1,240,737$620,369
Gadsden State Community College$3,756,166$1,878,083
Wallace Community College$3,655,757$1,827,879
Wallace State Community College$4,064,802$2,032,401
Wallace State Community College - Selma$1,298,325$649,163
Heritage Christian University$25,804$12,902
Herzing University$4,328,833$2,164,417
Huntingdon College$1,225,333$612,667
Ingram State Technical College$448,264$224,132
Jefferson State Community College$3,729,878$1,864,939
Jacksonville State University$6,050,640$3,025,320
Lawson State Community College$3,522,022$1,761,011
Judson College$369,009$184,505
Lurleen B. Wallace Community College$1,546,138$773,069
Northeast Alabama Community College$1,901,781$950,891
Marion Military Institute$514,237$257,119
Miles College$3,257,934$1,628,967
Northwest - Shoals Community College$2,069,470$1,034,735
Reid State Technical College$435,328$217,664
Oakwood University$1,573,749$786,875
Shelton State Community College$2,965,439$1,482,720
Samford University$2,381,353$1,190,677
Snead State Community College$1,239,198$619,599
Southern Union State Community College$3,196,100$1,598,050
Trenholm State Community College$1,892,834$946,417
Spring Hill College$1,372,682$686,341
Stillman College$1,206,208$603,104
Talladega College$2,069,544$1,034,772
Troy University$8,544,084$4,272,042
Tuskegee University$3,756,522$1,878,261
University Of Alabama$20,722,538$10,361,269
University Of Alabama At Birmingham$12,131,256$6,065,628
University Of Alabama In Huntsville$5,679,758$2,839,879
University Of Mobile$1,257,422$628,711
University Of Montevallo$2,560,001$1,280,001
University Of North Alabama$5,002,648$2,501,324
University Of South Alabama$11,408,535$5,704,268
University Of West Alabama$2,384,585$1,192,293

Elementary and Secondary Education

The $13.2 billion for elementary and secondary education is divided among the states based on the same formulas that allocate Title I funds — federal dollars that support low-income students.

The Alabama State Department of Education (ALSDE) is set to receive $216.9 million, 10% of the 2020 ETF budget. At least 90% ($195.3) is restricted to local systems. ALSDE can reserve up to 10% ($21.7 million) for departmental costs, including $1.084 million for administrative expenses. 6

ALSDE will disperse the $195.3 million to local school systems based on the systems’ shares of Title I funding in fiscal year 2020.

PARCA’s analysis of these numbers suggests the median dollar figure for Alabama schools in $780,000. Half of the systems would get more than this amount and half would get less. On the extreme ends, systems would get considerably more or less. PARCA estimates the largest allocation at $23.3 million and the smallest allocation at $84,000.

Final allocation numbers are expected from ALSDE soon.

Allowed Expenses

School systems appear to have more discretion than state and local governments. Authorizing legislation says systems can essentially spend these funds to:  

  • coordinate COVID-19 preparedness and response efforts
  • address the needs of special populations such as low-income students, students with disabilities, English learners, racial and ethnic minorities, and students experiencing homelessness
  • train employees on sanitation and minimizing the spread of infectious diseases
  • purchase cleaning and sanitation supplies
  • plan and coordinate during long-term closures
  • provide meals
  • provide technology
  • provide mental health services  
  • sponsor summer learning, including classroom instruction or online learning
  • sponsor after-school programs
  • address the needs of the individual schools

Maintenance of Effort

States cannot use these funds to supplant traditional education funding. The Act requires that in both 2020 and 2021, states budget and fund education at amounts equal to or greater than the average spent between 2017 and 2019. However, the U.S. Secretary of Education can waive this requirement.

Childcare

The Act allocates $3.5 billion for childcare. The funds can be used to make payments to childcare providers dealing with declining enrollment or closure, provide childcare assistance to healthcare, emergency response, and sanitation workers, or for other needs.7

Exact allocations are not final, but based on guidance provided by the Department of Health and Human Services, Alabama could receive approximately $65.4 million. These funds are administered by the Child Care Services Division of the Alabama Department of Human Resources.

Public Transportation

The Act allocates $25 billion for transit agencies “to help to prevent, prepare for, and respond to the COVID-19 pandemic.”8

Alabama should expect to receive $59 million [efn_]https://cms7.fta.dot.gov/sites/fta.dot.gov/files/docs/funding/apportionments/148421/table-3-cares-act-apportionment-section-5311-appalachian-allocations.xlsx[/efn_note] to support COVID-19 responses in rural and inter-city transportation programs. This is approximately 300% of the total annual federal appropriation for rural and inter-city transportation in Alabama.

Additionally, local governments could receive almost $68.75 million to support COVID-19 responses in local mass transit programs.9

Anniston-Oxford$3,582,050
Auburn-Opelika$3,156,205
Birmingham-Hoover$21,450,875
Daphne-Fairhope$1,992,086
Decatur$2,678,574
Dothan$2,659,981
Florence$2,946,627
Gadsden$2,241,726
Huntsville$6,830,268
Mobile$8,833,150
Montgomery$7,610,574
Tuscaloosa$5,766,327

Community Development Block Grants

The Act allocates $5 billion for Community Development Block Grants (CDBG) and related programs managed by the U.S. Department of Housing and Urban Development. Jurisdictions have broad leeway in how to spend these funds, and the Act does not appear to specify that funds must be used in COVID-19 response. A HUD press release lists possible uses.

To date, the Department of Housing and Urban Development has announced $39.9 million in additional funds for Alabama through traditional Community Development Block Grants (CDBG) and programs for people who are homeless and for people with HIV/AIDS.[efn_fn]10

CityCDBGHome Investment PartnershipEmergency SolutionsHousing Opportunities for Persons With AIDSHousing Trust FundTotal
Anniston$554,171$404,132$0$0$0$958,303
Auburn$645,889$0$0$0$0$645,889
Bessemer$590,538$0$0$0$0$590,538
Birmingham$5,969,972$1,402,448$515,798$1,444,186$0$9,332,404
Decatur$483,015$0$0$0$0$483,015
Dothan$502,786$0$0$0$0$502,786
Florence$327,756$0$0$0$0$327,756
Gadsden$1,057,180$0$0$0$0$1,057,180
Huntsville$1,408,479$714,011$0$0$0$2,122,490
Mobile$2,415,548$833,588$208,702$0$0$3,457,838
Montgomery$1,690,472$912,271$146,352$0$0$2,749,095
Opelika$271,786$0$0$0$0$271,786
Tuscaloosa$823,209$456,439$0$0$0$1,279,648
Jefferson County$2,414,493$1,022,067$204,775$0$0$3,641,335
Mobile County$1,622,148$580,826$0$0$0$2,202,974
Non-metropolitan areas$23,848,737$11,381,870$2,719,098$2,514,357$3,123,706$43,587,768