The Alabama Legislature’s two-week recess is over, but the session will not resume on March 31. No date has been set to reconvene either house. The Legislature is constitutionally mandated to enact General Fund and Education Trust Fund budgets and end the session by May 18.
Enacted Legislation
Before the recess, the Legislature acted on one bill relating to COVID-19.
The Legislature approved, and Governor Ivey signed, HB 186
appropriating an additional $5 million from the General Fund to the Alabama Department
of Public Health (ADPH) for COVID-19 preparation and response.
For perspective, ADPH’s fiscal year 2020 budget is $861,467,948, but only $52 million are state appropriations. This additional $5 million represents a 9.6% increase in the state appropriation. In its 2018 Annual Report, ADPH reported spending approximately 22.7% of state appropriations on infectious diseases.
Proposed Legislation
HB 448 proposes to expand Medicaid coverage for new
mothers for 60 days after the birth of a baby to one year.
HB 447 proposes to expand Medicaid, as described in the Affordable Care Act.
Resolutions
SR 49 urges Congress
to provide additional rental assistance to eligible families in USDA rural
housing units. According to the resolution, there are approximately 13,000
Alabama families living in such units.
HR 107 urges the promotion, sharing and posting of practices to reduce the spread of infectious diseases.
SJR 40 asks Alabamians
to fist bump rather than shake hands.
HJR 121 is a joint
resolution from Democrats in both houses asking the Governor to expand Medicaid
under the Affordable Care Act.
Other Actions
Senator Arthur Orr (R-Decatur) plans to file a bill providing businesses civil immunity from lawsuits that allege contraction of COVID-19 on those business’ premises.
2019 Alabama County and MSA Population Trends
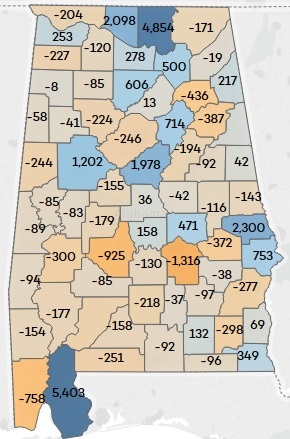
The latest estimates from the U.S. Census Bureau show a more broadly distributed pattern of population growth in 2019 with continued and accelerating strength in north Alabama counties and a surge across south and Southeast Alabama. Published last week, the figures estimate the populations of counties and metropolitan statistical areas (MSAs) on July 1, 2019. Next year’s figures will be based on the actual census count now underway.
Between July 1, 2018, and July 1, 2019, population growth was more widespread in Alabama than it had been the year before: 29 counties saw growth compared to 22 in 2018.
That more dispersed growth included more positive growth in some rural counties, particularly in North Alabama and Southeast Alabama.
To be sure, the hottest spots for growth remain Madison and Baldwin counties’ populations. The Huntsville metropolitan statistical area (MSA), which includes Madison and Limestone, posted the strongest gain among MSAs, with an estimated 8,643 new residents. Nearby counties like Morgan, Marshall, Cullman, Colbert, and Lauderdale also gained.
Houston County, home to Dothan, had been growing steadily over the course of the decade, but in 2019 saw a jump of over 1,000 new residents according to the estimates. The growth in Houston and smaller gains in other counties bordering the Florida panhandle were likely sparked, in part, by businesses and individuals relocating in the wake of Hurricane Michael’s strike in October of 2018.
The tabs at the top of the maps allow you to select between views of numeric, percentage, or rates of change. State and national maps are available. The menus to the right of the maps allow you to toggle through options for the timeframe and select components of change. Maps include county-by-county birth, death, and migration rates.
Metro Areas
The Birmingham metro area continued with slightly positive growth, though the estimates show its central county, Jefferson, losing residents in 2019. Shelby saw a higher gain in 2019 than in 2018, as did St. Clair. Blount, Chilton, and Bibb counties posted gains. Walker County’s population declined.
Montgomery’s MSA saw slightly positive growth thanks to an uptick in growth in Elmore and Autauga counties and far less outmigration from Montgomery County. Nearby, Lee County saw something of a pause to what has been blistering growth in the Auburn-Opelka area. Lee County added 886 new residents, according to the estimates. Lee had been adding more than 2,000 residents a year throughout the decade.
Mobile’s MSA, which consists of Mobile County, lost almost 700 residents according to the estimates. Despite their proximity and interrelation, Mobile and Baldwin County are considered separate MSAs. If the two counties were considered together, Baldwin’s growth would much more than offset Mobile’s losses and the area would be the second-fastest growing MSA in the state in numeric terms. MSAs for Dothan, Tuscaloosa, the Shoals and Decatur showed growth in 2019. The Anniston MSA, consisting of Calhoun County and Gadsden MSA consisting of Etowah County, both lost population.
Non-Metro
Among non-metro counties, the trend of population loss continued. Rural counties in Alabama’s Black Belt, those along the border with Mississipi, those across south-central Alabama and in east Alabama, with the exception of the I-85 corridor saw population declines in 2019. Losses were particularly steep in Dallas County, which lost over 1,000 residents in 2019, according to the estimates. That was close to 3% of the county’s population. Since 2010, Dallas County is estimated to have seen a 15% decline in its population.
Wider Context
For 2019, the Baldwin County MSA’s annual growth rate of 2.5% ranked 13th out of the nation’s 383 metro areas. Huntsville’s growth rate of 1.9% ranked No. 23. Birmingham ranked No. 229 out of 383, Montgomery, 261, and Mobile, 299.
Looking back to 2010, both Madison and Baldwin counties have added around 40,000 people since the beginning of the decade, according to the estimates.
Alabama’s other big gainers were the major college towns, which also happened to be on automotive assembly corridors. Lee County, home to Auburn, gained almost 25,000 residents since 2010 and Tuscaloosa added almost 15,000. Suburban Shelby County added over 22,000.
Over the same period, Mobile and Jefferson counties were flat in terms of population totals for the decade. Montgomery lost almost 3,000 residents.
Those changes seem modest, but below the surface, major shifts occurred. Each of those counties saw large gains through natural increase (births outnumbering deaths by 10,000 to 15,000). At the same time, though, they exported more residents than they gained through natural increase (15,000 to 20,000 net outbound movers).
However, bringing the large central counties back to even was international migration, with each of the central counties attracting around 4,000 to 6,000 net new arrivals from abroad over the decade.
Adjacent to Jefferson, Shelby and St. Clair Counties continued to grow. Madison’s neighbor, Limestone actually outgrew Madison County in percentage terms. Montgomery’s neighbors Autauga and Elmore gained.
Rural Alabama counties, including both the Black Belt and south-central Alabama, along with the heavily forested counties along the Mississippi border have lost population. In numerical terms, Dallas County has lost the most of any county, with an estimated 6,617 fewer residents in 2019 than in 2010. More urbanized Calhoun County has lost almost 5,000 residents according to the estimates with Walker and Macon counties both losing well over 3,000, as well.
PARCA has updated its interactive maps and charts that allow users to explore local population changes and trends. PARCA tools for state-level population estimates were updated earlier this year. Estimates for cities will be released this summer. The next release of information for county and MSA population totals should come next year from the actual Census count. The Census is currently underway; however, considering the challenges created by the Coronavirus outbreak, it would be impossible to predict when the count will be completed.
The 2020 Census: Alabamians Are Responding
While the COVID-19 pandemic rightly consumes so much of our attention, it is important—and perhaps comforting—to remember that other important aspects of public life continue. One of these is the 2020 Census.
Census information began to arrive in the mail last week, and already, people are participating. An accurate Census count is now more important than ever as state and local governments will be coping with a very different post-pandemic reality.
The map below, provided by the Census Bureau, reports self-response rates by state, congressional district, county, city, and census tract. The self-response rate, sometimes called the initial response rate, is the percentage of households that respond to the initial request to participate. Households that do not respond to this initial request receive additional requests and, ultimately, a visit from a Census worker.
Tracking the self-participation rate is a good measure of the effectiveness of Census promotion efforts and helps the Census Bureau adjust strategies. The self-response rate does NOT indicate the total percentage of households counted.
As of March 25, Alabama’s self-participation rate is slightly ahead of the nation at 27.7% compared to 26.2%. For comparison, the state’s final self-response rate in 2010 was 62.5%. Within Alabama, Autauga County leads all counties at 33.4%.
The order, part of a State of Emergency declared by Alabama Governor Kay Ivey, states that, prior to April 6th, a decision will be made on whether to extend the order.
These and other measures included in the order are aimed at limiting the spread of the novel Coronavirus, COVID-19. The order’s protective measures mirror steps already taken in Jefferson and its surrounding counties and in Mobile county.
But the true extent of the virus is unknown. The number of confirmed cases does not equate to the prevalence of the virus in a county. Testing has been slow to deploy. Results are not delivered for 24 to 72 hours. In some cases, long lines form at announced test sites, overwhelming their ability to take samples, and perhaps indicating high demand.
PARCA is updating a Coronavirus Resources page, which can be accessed to the right of the main menu on the homepage.
Alabama State and Local Resources for following Coronavirus COVID-19
Responding to the spread of Cornavirus, Alabama’s State Health Officer ordered Tuesday that in Jefferson and surrounding counties, public gatherings of 25 people or more are prohibited until further notice, and restaurants have been ordered to cease on-site dining operations.
According to the Alabama Department of Public Health (ADPH), the state had 39 confirmed cases of the novel Coronavirus, COVID-19, as of Tuesday, March 17, at 3:30 p.m. Jefferson County had the highest number of cases with 21. (For updates, PARCA has established a PARCA’s Coronavirus Resource page, updated tallies are available directly from ADPH here. And AL.com has established a Coronavirus update page for breaking news).
Wilson on Monday said evidence indicates the virus is now spreading in the Jefferson County community. Wilson ordered that bars and restaurants cease offering on-premise dining, that daycares and private schools close, and that senior residential facilities take additional steps to restrict visitation and mingling within the facility. Gatherings of more than 25 people are prohibited. State officials said Tuesday that those same orders are being extended to Tuscaloosa, Blount, Walker, Shelby, and St. Clair Counties. Text of the state order is here.
In support of the work of the government and health care professionals involved in the Coronavirus containment effort, PARCA plans to gather and share information and resources on a daily basis as the situation unfolds. Check back on our PARCA’s Coronavirus Resource page for updates.
The Alabama Department of Public Health (as of March 17) has not yet ordered restrictions in the rest of the state. However, they strongly recommend that people statewide take steps to limit the spread. Those include:
No mass gatherings of 50 persons or more, or gatherings of any size that cannot maintain a consistent six-foot distance between participants. This may include festivals, parades, assemblies, or sporting events.
Senior adults or those with chronic health problems should avoid gatherings (outside of close family) of 10 or more persons, and should avoid travel by air, train or bus.
For retail businesses, including restaurants, limit patronage at any one time to 50% of the normally allowable capacity. Restaurants should maintain a six-foot distance between tables.
Public buildings should consider whether visitation may be limited. Hospitals, nursing homes and assisted living facilities are encouraged to implement visitation policies that protect vulnerable persons.
All persons should consider whether out-of-state travel plans may be delayed or canceled.
Participants in religious services or events, weddings, funerals, and family events should exercise prudence and maintain consistent six-foot distance between participants if possible.
For individuals and families, wash your hands, avoid crowds, and in public maintain a six-foot distance from others. Work from home if possible, and, if sick, stay home.
If You Feel You Need Testing for the Virus
If you suspect you have contracted COVID-19 and are experiencing symptoms, the Alabama Department of Health asks that you contact your health care provider to arrange for testing.
For those without a regular provider, call 1-888-264-2256 to find out about testing in your area.
For Travelers Returning from Affected Geographic Areas
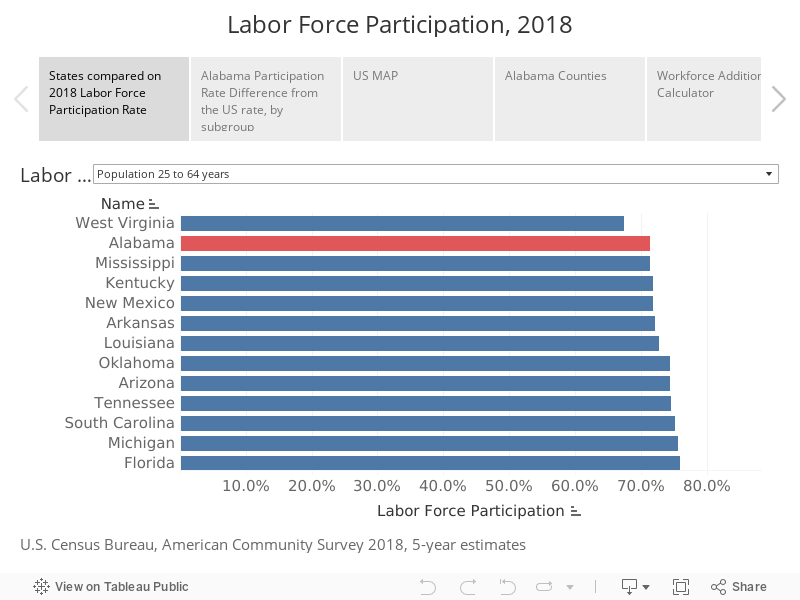
Help Wanted: Alabama’s Labor Force Participation Problem
Alabama has record low unemployment, one of the lowest unemployment rates in the country.
And yet, the percentage of Alabamians actually
working is lower than almost any other state.
This seeming paradox explains, in part, why Alabama has lower per capita income than most other states and higher rates of poverty, despite those historically low unemployment numbers. To be counted as unemployed, you have to be looking for work, or in other words, participating in the labor force.
In 2018, Alabama’s labor force participation rate was lower than all other states, except West Virginia (we’re tied with Mississippi). As measured by the American Community Survey, 71% of Alabamians, ages 25-64, were working or looking for work. That compares to the U.S. labor force participation rate of 78% for that age group.
If Alabama’s labor force participation rate equaled that national average, Alabama would have almost 160,000 additional workers in the workforce in that age range.
Low labor force participation is a significant problem for Alabama, one that has been recognized by Gov. Kay Ivey’s Administration and the Alabama Workforce Council in its Success Plus Initiative (for more information on this initiative see Education Matters, a report from the Business Education Alliance authored by PARCA. You can also read the Alabama Workforce Council’s latest update on the effort).
Increasing the state’s labor force participation rate is one of the key objectives identified by Success Plus for helping Alabama meet its goal of adding 500,000 highly skilled workers to its workforce by 2025. The state will not reach that goal without bringing significant numbers of those who have dropped out of the workforce back in, which in most cases means equipping them with supplemental education and skills needed to thrive in today’s work environment.
Who is missing?
Before we can bring people back into the workforce, we have to understand who’s missing in the first place, and which groups of Alabamians have dropped out at a higher rate than residents of other states.
Using data from the U.S. Census Bureau’s American Community Survey (ACS) for 2018, PARCA examined the labor force participation in Alabama in comparison to other states and to the nation as a whole. We used five-year estimates because that survey provides estimates for smaller counties not present in the one-year estimates.
A comparison of one-year estimates yields similar results. However, it should be noted that in the 2018 one-year estimates, labor force participation in Alabama did show an increase over 2017, from 70.5% to 71.4%, after a multi-year downward drift. Whether that is a result or the economy or policy focus, it would be hard to determine, but, hopefully, it is part of a trend. For comparison, before the Great Recession, Alabama’s labor force participation rate was 75% for that age group and the national rate was 80%.
Sharpest differences with the rest of the U.S.: Age, Income, and Disability
Alabama trails the rest of the U.S. labor force participation rate across the board. When you break the population down into subgroups by age, sex, race, economic condition, or educational attainment, in almost every subgroup, Alabama’s rate trails the U.S. rate. However, in some subgroups, the divergence from the national rate is particularly sharp.
In comparison to the same population groups in other states, older Alabamians and Alabamians with lower levels of education are less likely to participate in the labor force, according to Census figures. Alabamians with a disability are also less likely to participate in the workforce than their counterparts in other states. The labor force participation rate for those groups is roughly 10% lower in Alabama than it is for similar individuals across the U.S.
The gap with the U.S is most extreme when it comes to individuals with less than a high school education. In Alabama, only 49% of individuals who lack a high school diploma are working or looking for work. That compares to a labor force participation rate of 61% nationally for those with less than a high school education.
Older workers in Alabama are also disproportionately out of the workforce. The labor force participation rate of those 60 to 64 is 10 percentage points lower in Alabama than it is in the rest of the country: 46% of Alabamians ages 60-64 participate in the labor force compared to 56% nationally. For those between 55-59, Alabama’s labor force participation rate is 63% compared to 72% nationally.
Age remains a factor in those between the ages of 45 and 54; Alabama’s rate is almost 7 percentage points lower than the U.S. average. For those 44 and younger, the gap between the Alabama workforce participation rate is narrower, though Alabama’s rate is still 3 to 4 percentage points lower than the U.S. rate.
You find a similar pattern with educational credentials: the more education an Alabamian has, the more likely he or she is to participate in the workforce. As the education level rises, the gap with the U.S. rate closes: 84% of Alabamians with a bachelor’s degree or higher participate in the workforce compared to 86% nationally.
When it comes to individuals who report having a disability, Alabama also has lower rates of labor force participation than other states, with the labor force participation rate among disabled individuals in Alabama trailing the national average by 9%.
You can explore state and national rates of workforce participation in the map below. Use the selector at the top to choose the population group to measure.
The impact of Alabama’s labor force participation deficit in these subgroups is amplified because Alabama’s population is older, less educated, and more disabled than the country as a whole. Alabama’s median age is 38.7 compared to 37.8 in the US; 25% of Alabamians have a 4-year degree compared to 32% across the country; 11.6% of Alabama’s population reported a disability compared to 8.6% nationwide.
What does not impact our labor force participation rate
Alabama’s racial diversity does not affect the state’s labor force participation rate, though if Alabama was more diverse, our labor force participation rate might be higher.
Non-Hispanic whites (ages 16 and up) have the lowest labor force participation rate of the major racial and ethnic groups, just under 57%, lagging non-Hispanic whites nationally by 5.4 percentage points. Blacks in Alabama have a labor force participation rate of just over 57%, lagging the U.S. rate by 5.2 percentage points. Alabama Hispanics have a labor force participation rate of 67%, which is less than a percentage point difference from the U.S. labor force participation rate for Hispanics.
It is sometimes assumed that Alabama’s supposed preference for traditional gender roles might depress the labor force participation rate for females in Alabama compared to the rest of the U.S. However, if those attitudes produce any effect, it is slight. The female labor participation rate in Alabama is 66.4%, trailing the national average by 6.2 percentage points. That’s only slightly higher than the gap for males. The male labor force participation rate in Alabama, 76.6%, trails the U.S. rate by 5.6 percentage points. In fact, one subset of the female population in Alabama participates in the workforce at a higher rate than the U.S. rate. Alabama females with children under 6 are more likely to be in the workforce than similarly situated women nationwide. According to the Census figures, 71.4% of those mothers participate in the labor force.
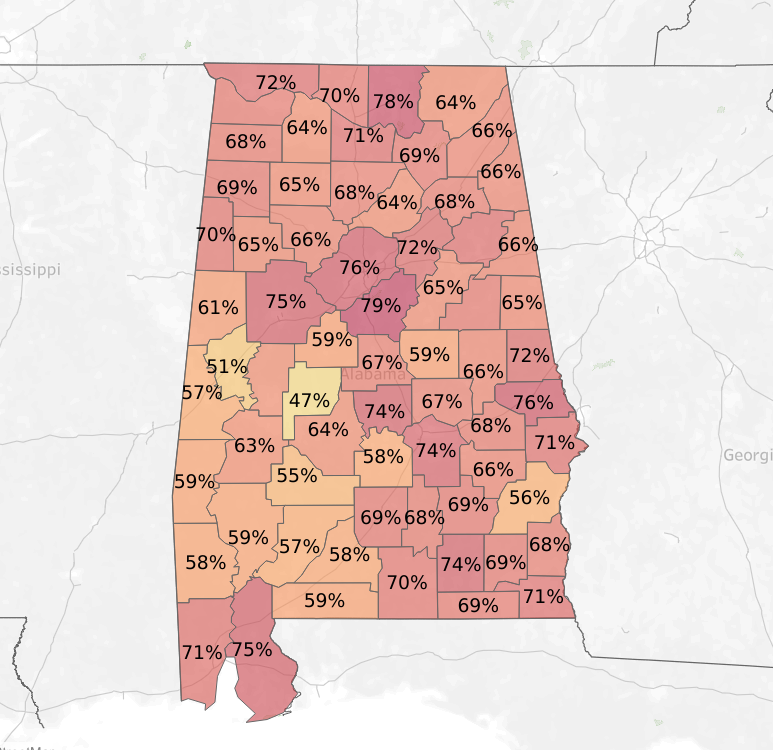
Geography matters
Alabama’s rural counties have the lowest labor force participation rates. Meanwhile, the most urbanized and affluent of Alabama counties have the highest rates of labor force participation.
One might conclude that it would be best to recruit workers back into the workforce by targeting rural counties where labor force participation is lowest. However, this neglects the fact that the largest population of workers who aren’t participating in the workforce are in metropolitan counties. That’s also where unemployment is lowest and jobs are clustered. Both rural and metropolitan counties need strategies for increasing labor force participation.
The visualization below allows you to calculate how many additional workers could be added to the workforce in the selected geography if that geography matched the U.S. labor force participation rate for the selected subgroup. The two subgroups selectors on the dashboard, one for the subgroup population and one for the subgroup labor force participation rate must be set to the same subgroup to produce accurate calculations.
2019 Test Results for State Schools Show Little Change in Student Proficiency Levels
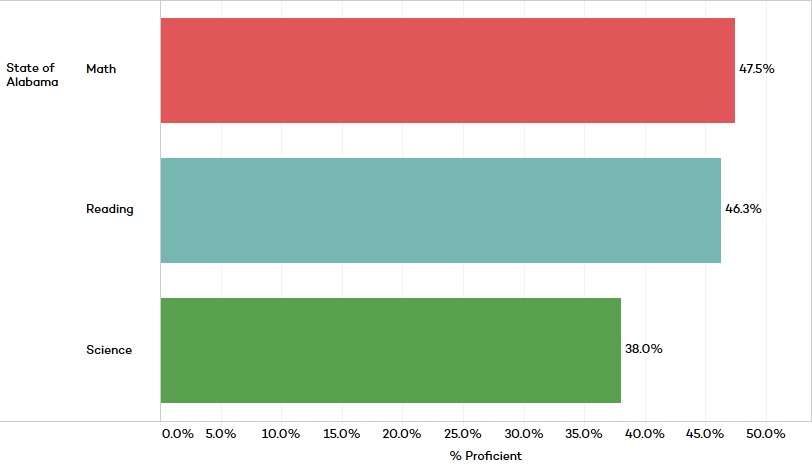
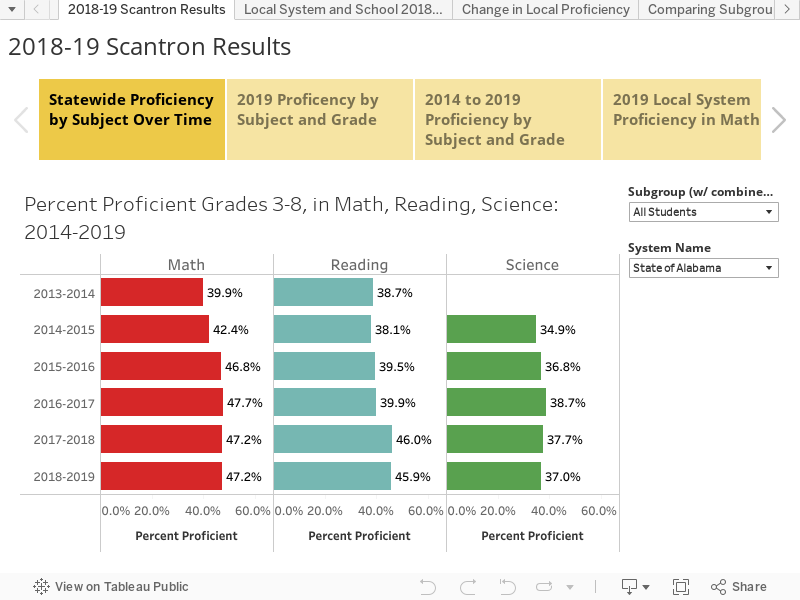
Alabama is scheduled to implement its new state education tests this spring. In the meantime, statewide results from the Scantron assessment in 2019 have been released by the Alabama State Department of Education. They show little change from 2018. In both years, less than half of Alabama public school students in grades three through eight scored proficient in reading and math.
For the state as a whole, 47% of students were proficient in math in 2019 and 2018, and 46% were proficient both years in reading.
The overall proficiency rate for science in 2019 was 37%, a very slight decrease from 38% in 2018.
This comes at a time when Alabama’s performance on the National Assessment of Educational Progress (NAEP) has dropped.
New State Assessments
2019 is the second year of data from Scantron, which in 2018 replaced ACT Aspire as the primary state assessment used for measuring academic progress in Alabama public schools since 2013-2014. In June 2017, the State Board of Education voted to cancel Alabama’s contract with ACT and move toward developing another set of tests, which are scheduled to be launched in the spring of this school year, 2019-20. In the meantime, the state continued to assess performance in grades three through eight using tests provided by the Scantron testing company.
Scantron Statewide Results for 2019
Comparing Subjects. Selecting the first tab above shows that among the three subjects assessed with Scantron, once again in 2019, math generated the highest percentage of students scoring at or above proficiency (47%) across grades 3-8 combined. Reading was not far behind at 46% proficient. Similarly, from 2014 through 2017 math generated the highest percent proficient among students taking ACT Aspire, though the gap between math and reading was larger.
Under Aspire, math made ongoing progress each year climbing from 40% proficient in 2014 to 48% in 2017. The increase from 40% with Aspire to 47% with Scantron seems about normal.
In contrast, reading proficiency under Aspire showed little change each year rising from 39% in 2014 and to 40% in 2017. The jump for reading from 40% with Aspire to 46% with Scantron was more significant than the change between tests in math.
In 2019, the Scantron science assessment continued to generate the lowest proficiency rate among the three subjects tested, at 37% proficient, as it did in 2018 with 38% proficient.
Comparing Grade Levels. The second and third panels above provide grade level comparisons. Differences in math proficiency by grade for 2019 and 2018 are minimal. Across all grades under Scantron and Aspire, math proficiency levels are at their highest in the third grade, following the trend in which reported proficiency levels drop in the higher grades. This pattern is less substantial when looking at a particular cohort of students moving from grade-to-gradebut still applies.With both Scantron and Aspire, math proficiency drops sharply in the seventh grade, though less dramatically under Scantron in both 2019 and 2018.
Third-grade math is the one grade and subject each year in which the majority of students meet or exceed the benchmark for proficiency. In 2019, 58% were proficient in third-grade math, up slightly over 57% in 2018. This level of proficiency is very similar to Aspire’s third-grade math results, which grew from 52% in 2014 to 59% in 2017. After third grade, though, math proficiency drops, winding up at 45 percent of students demonstrating proficiency by 8th grade.
Reading proficiency in 2019, using Scantron, shows a steady drop from 48% proficient in the third grade to 43% in the 8th grade. This reflects very little change from 2018, in which proficiency ranged from 48% in the third grade to 44% in the 8th grade. Though proficiency levels get lower in the higher grades, they are not dramatically lower as found in math. The more dramatic grade-by-grade drop-in math proficiency was evident in Aspire as well, though even more pronounced.
Why are proficiency levels dropping from grade to grade? First, a decrease at the higher grade levels is normal. During the early grades, math and reading are focused on helping young students learn basic skills, but in the higher grades, math becomes more complex and introduces algebra. Reading instruction also becomes more demanding as students move from learning to read to reading for understanding. Attitudes about external state assessments among younger students in the earlier grades could also be different from students in the higher grades.
But why the difference between reading and math? The less dramatic reduction in proficiency levels in reading from grade to grade might suggest that either students are more effective in learning the basics in reading as a foundation for later grades or that the material in math becomes harder to master and teach. Like many places, the demand for math teachers in Alabama far exceeds the supply of available, qualified math teachers. Proficiency scores on the state Aspire math test for tenth graders significantly dropped from earlier grades to as low as 18% proficient in 2016-17, compared to 33% in reading. Tenth-grade proficiency is not assessed under Scantron. Furthermore, high school ACT scores in Alabama for college admission are higher in reading than in math.
Science is a little different. The drop in proficiency among students in the higher grades takes on a different pattern in science. In 2015, Alabama only tested science in the tenth grade, and 21% tested as proficient or above. In 2015 and 2016, grades three through eight and grade ten were tested. Proficiency levels actually increased from grade-to-grade in grades three through six, with the peak level of proficiency in the 6th grade, then began dropping in the 7th grade, reaching the lowest level in the tenth grade. In Aspire’s last year (2016-17), science was tested in grades 5, 7 and 10. Proficiency levels dropped in each higher grade, as would be expected from past performance in these grades. Finally, under Scantron science was tested in grades 5 and 7, dropping from 40% (grade 5) to 35% (grade 7) in 2018, and from 39% to 35% in 2019.
The low scores in science are worthy of concern, for Alabama and the nation. Though reading and math are more fundamentally essential, science relates to problem-solving skills, reasoning, curiosity, critical thinking, good measurement skills, and applied learning. Through science, a student can learn more about the world around them and better prepare for careers in technology, engineering, agriculture, advanced manufacturing, and health services. These are important skills for the workforce of tomorrow in Alabama.
Focus on Third Grade Reading and the Alabama Literacy Act
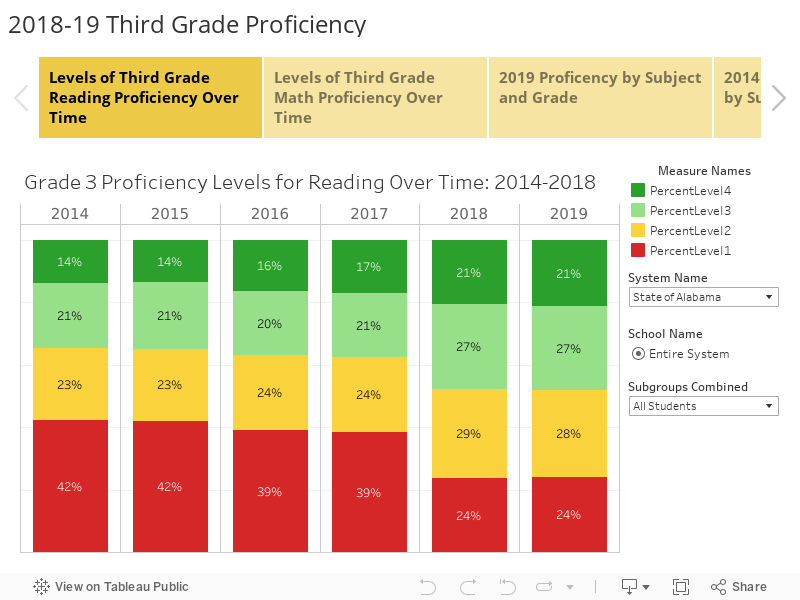
Early reading is a pivotal predictor of academic success. Children who learn to read in the early years have a foundation that will help them in other subjects. Early brain development and schooling through grade three are extremely important in shaping a person’s education and life chances. The figure above shows the percentage of students in each of the four proficiency categories for third grade reading from 2014 through 2019. Scantron labels used in 2018 and 2019 for the different levels of proficiency are listed below:
Level 1 (Red—Emerging Learner)
Level 2 (Yellow—Developing Learner)
Level 3 (Light Green—Proficient Learner)
Level 4 (Dark Green—Distinguished Learner)
Students who achieve proficiency or above are in Levels 4 and 3 (dark green and light green). Similar to a traffic light, these colors signal “go.” This is followed by yellow (“use caution”) and red (“stop”).
The Figure above shows that21%of third-graders read at the lowest level in 2019. Under Aspire, in 2017 that percentage was 39%. It will be interesting to see how this comes out in the new assessment.
To address the high percentage of students not reading with proficiency, in 2019 the Alabama Legislature adopted the Alabama Literacy Act.
The Literacy Act refocuses attention on early reading in kindergarten through third grade, with the expectation that all students should be able to read by the end of the third grade. Beginning in the 2021–22 school year, students falling into the lowest group in reading may be at risk of being retained. Though minority students will be disproportionately affected, research shows that students who are held back and learn to read with intensive reading intervention do better in school than comparable students who are not held back.[1] A key issue relates to the capacity of the state and local systems to provide the intensive assistance as students are held back.
The
State Superintendent of Education is convening a standing task force to provide
recommendations for comprehensive core reading and reading intervention
programs, teacher professional development in the “Science of Reading,” and
valid and reliable assessments that can be used for screening, diagnostic, and
instructional purposes. Research has identified how skilled reading works, and
helping teachers learn the science behind reading can make a difference, as
demonstrated in Mississippi.
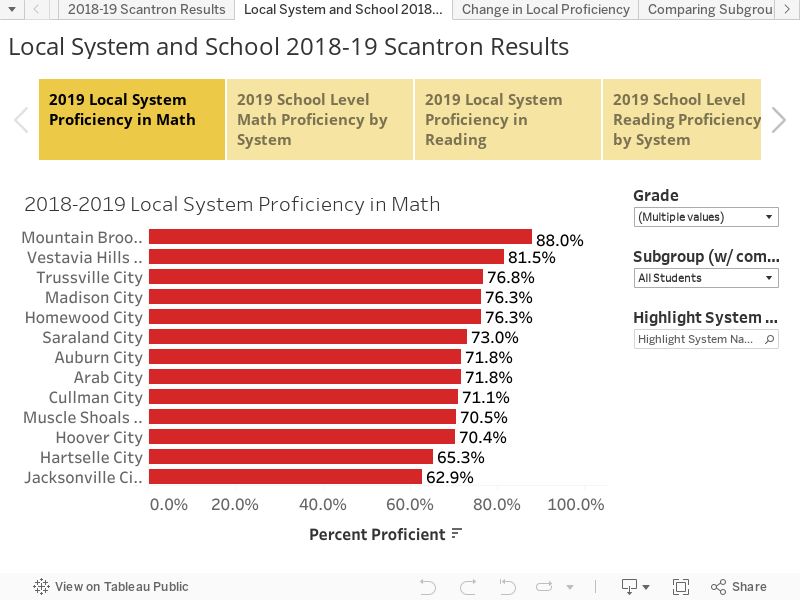
Comparing Systems and Schools – How Did YourSchool Do?
The tabs above list the percent proficient in each subject for all local systems and schools. Click on any one of those tabs and look up schools or local systems most important to you and see how they compare to other systems.
Across the state, in both math and reading, 42% of school systems met or exceeded the state average for percent proficient in math and in reading. Fifty-two percent achieved this in science. Clustering occurs where systems and schools perform similarly in all three subjects, especially among the wealthiest and poorest systems. Performance among the top ten and lowest ten in all three subjects is consistent. Still, throughout the state, you can also find variation that shows different local strengths. For example, though Haleyville is ranked 109 in Science (28% proficient), and 103 in reading (36%), it is 53 in math (49% proficient).
It would be useful to learn what is causing differences of this nature and why some systems and schools are stronger in particular subjects than others.
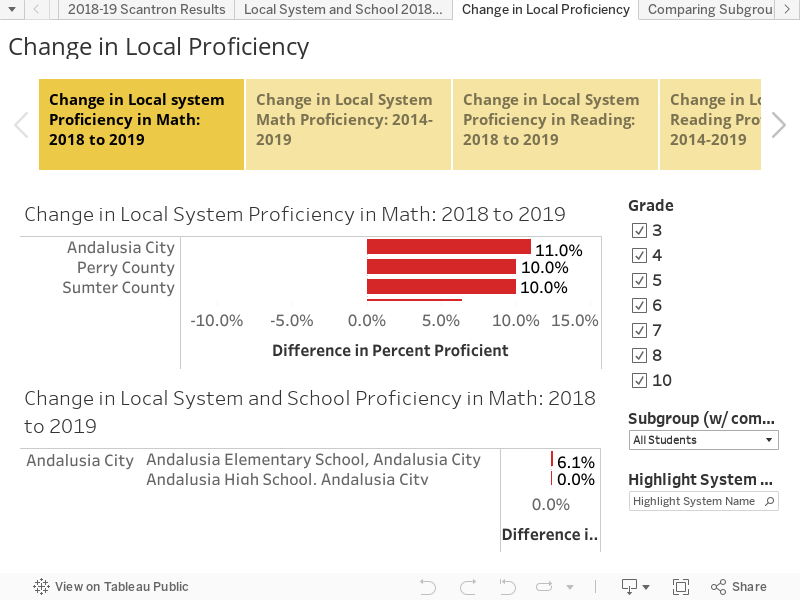
Local Change in Proficiency Over Time
In addition to absolute levels of proficiency in a school system or school, the change occurring over time is another important indicator of performance. This can be an indicator of value added by the school. In schools where students come from family backgrounds in which parents have high income and educational attainment, proficiency levels may already be high, with more limited prospects for change in the school’s proficiency level. In schools where a high percentage come from a background of poverty and low parental educational attainment, students are more likely to enter school less prepared and fall short of their actual potential on assessments. Schools and systems making an effective, concerted effort to improve performance can make a difference. Though absolute scores may still be low, positive growth reflects deliberate improvement, sometimes under very challenging conditions.
The dashboards above list and rank the school systems in the state related to percentage point change in the proficiency rate from 2017-18 to 2018-19 in each subject. The bottom section of each dashboard shows the change in individual schools within each system. PARCA’s analysis below highlights the systems with the highest change in each subject over this period.
Table 1: Percentage Point Change in Proficiency, 2018 to 2019
Math
Reading
Science
Andalusia City: 11%
Andalusia City: 9%
Piedmont City: 17%
Perry County: 10%
Perry County: 8%
Coosa County: 11%
Sumter County: 10%
Phenix City: 4%
Marengo County: 10%
Leeds City: 6%
Lanett City: 3%
Tallassee City: 9%
Tallapoosa County: 6%
Sumter County: 3%
Perry County: 8%
Daleville City: 6%
Scottsboro City: 3%*
Andalusia City: 7% Elba City: 7%
*Note that the Macon, Piedmont, Dallas, Butler, Walker, Brewton and Elba also improved reading proficiency by 3 percentage points.
Andalusia City and Perry County were among the most improving systems in all three subjects, and Piemont’s 17 percentage point increase in science is outstanding. Across the state, proficiency levels range in math from +11 to -8%, in reading from +10 to -7%, and in science from +17 to -13%.
Table 2 shows the change in proficiency over 2014-2019, which is complicated by comparing Aspire and Scantron results.
Table 2: Percentage Point Change in Proficiency, 2014 to 2019
Change in Math Proficiency
Change in Reading Proficiency
Change in Science Proficiency
Geneva County 26%
Jacksonville City 22%
Piedmont City 36%
Saraland City 22%
Scottsboro City 21%
Saraland City 35%
Dale County 22%
Trussville City 21%
Etowah City 32%
Marengo County 22%
Geneva County 18%
Satsuma City 30%
Trussville City 21%
Saraland City17%
Leeds City 29%
Russell County 20%
Dale County 15%
Geneva County 28%
Lamar County 20%
Brewton City 14%
Russell County 27%
Houston County 19%
Piedmont City 13%
Dale County 26%
Troy City 19%
Talladega County 13%
Opp City 26%
Clarke County: 19%
Perry County 13%
Geneva City 26%
Haleyville City: 19%
Tuscumbia City 13%
Cleburne County 26% Henry County 26%
Over this longer period, a different set of systems are shown. Perry, Leeds, and Marengo systems again are listed, and Piedmont continues to come out on top with improved science proficiency. Systems with significant improvement in two or more of the subjects include Geneva County, Saraland City, Perry County, Dale County, and Russell County. Across the state, change ranged from +26 to -8% in math, +22 to -5% in reading, and +36 to -5% in science.
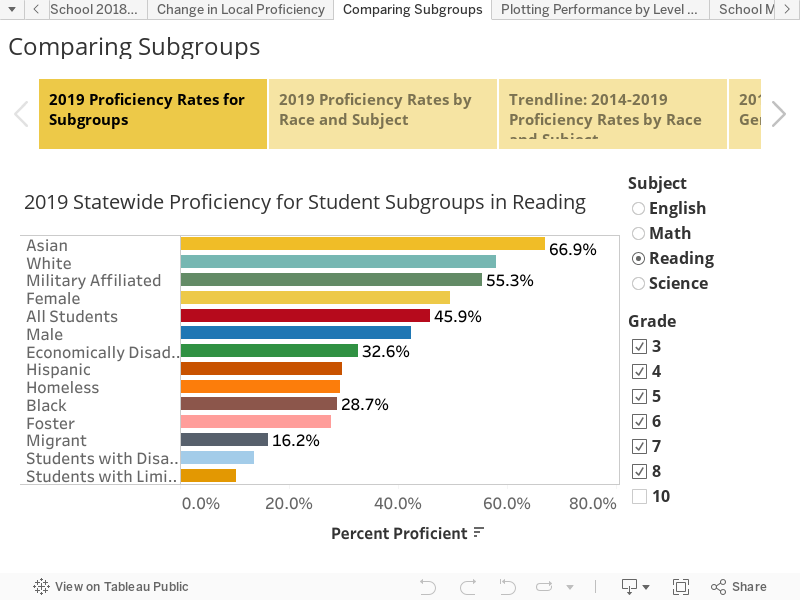
Performance of Subgroups in Alabama
In Alabama and across the country, differences in proficiency rates among various subgroups of students continue to be a concern, and the gap between students who are white and students of color is increasing. Proficiency rates for all subgroups changed very little from 2018 to 2019. More positive growth occurred between 2014 to 2019, though comparisons are between Scantron and Aspire assessments.
Students who are African-American, English Learners, and those in special education all perform at a lower level than do economically disadvantaged students as a group.
A higher percentage of Hispanic students, except those who are English Learners, attain proficiency in math and science than do students who are Black. Those two groups have the same percent proficient in reading. Among all the sub-groups, English Learners appear to struggle the most. They are ranked low in all subjects, especially science and reading, where they fall below all racial groups, economically disadvantaged students, and students in special education.
Asian students are the highest performing in all three subjects. Wide gaps continue to exist between African-American students and both Asian and White students, and between Hispanic students and both Asian and White students. Comparing proficiency results in 2014 and 2019, the gap between students who are White and those who are Hispanic or Black is increasing. At the same time, Black students have made significant progress. Math has been a stronger subject for Hispanic students than Black students, though in reading the initial gap between these two groups has been closed.
Same as last year, female students in the state performed higher than males in math and significantly higher in reading, while male students scored slightly higher in science.
Impact of Poverty
Students growing up economically disadvantaged are less likely to be read to in the early years, are exposed to fewer words, and are more likely to be exposed to health problems that can affect their capacity to learn in school and perform on tests. The education level and income of a student’s parents becomes a significant predictor of performance on standardized tests such as Scantron.
But some schools are better equipped to help all students learn and exceed expectations.
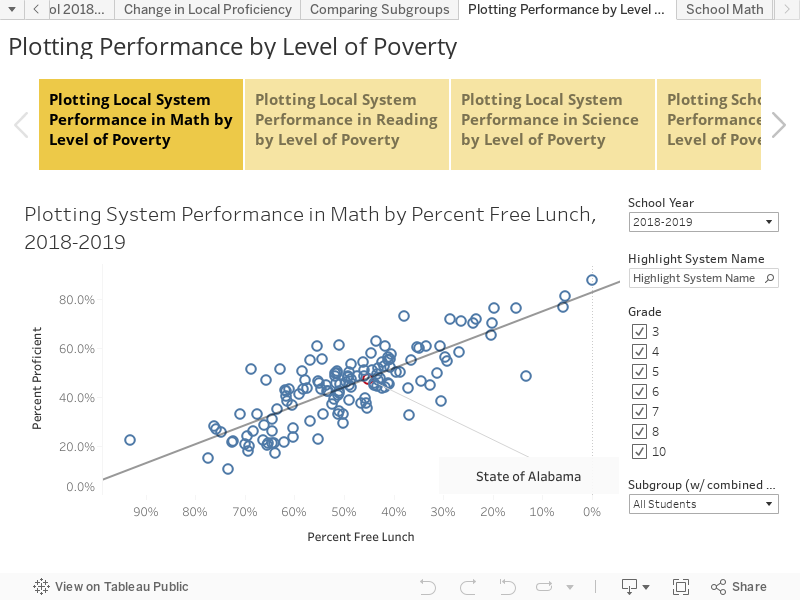
The scatterplot charts found in this section show the general correlation between proficiency levels and poverty levels. A school system’s proficiency rate determines its vertical position on the chart: the higher on the chart, the higher the proficiency rate. A system’s percent of economically disadvantaged students, measured by the percentage of students qualifying for free meals under the National School Lunch Program, determines the system’s position on the horizontal axis. Systems with a higher percentage of economically disadvantaged students will appear to the left of the chart and those with a lower percentage will be to the right of the chart.
Exceeding Expectations or Falling Short. The line displayed in the scatterplot is the average proficiency level for a given level of poverty. Those systems and schools above the line are exceeding expectations given their percent of economically disadvantaged students, and those below the line are falling short of expectations. These charts show that systems with similar poverty levels often show very different proficiency levels. In other words, school systems can and do exceed expectations through effective teaching, student support, and school organization and culture.
As an example, consider the chart on Scantron math performance and percent poverty. Saraland is exceeding expectations with 75% of their students scoring math proficient while 37% are economically disadvantaged. In contrast, in Pike Road only 16% of students are economically disadvantagedbut only 47% are considered proficient in math. You can learn about the scores of each of these systems by clicking on the circles in the chart.
Conclusion
The Scantron results from 2019 showed very little change from 2018. The gaps that exist between school systems and among student subgroups continue to be an area where more work is needed, especially if Alabama is to fulfill its vision as a state characterized by a vibrant, innovative and relevant workforce.
This is an exciting year in Alabama as the state rolls out its next suite of assessments at the same time that new math standards have been established. Because of the Literacy Act, the state is refocusing attention on early reading. It will be important to establish a baseline and provide feedback on the validity, reliability, and usefulness of the new assessments. Providing accurate, timely, and accessible data can give the state and its schools clarity on progress being made and a strategic sense of how target resources that can make a difference.
This comes at a critical time when NAEP scores in the state have dropped, when the state’s NAEP proficiency rates continue to be very low, and when the state’s ranking in the nation on math and reading has dropped to the bottom of the barrel.
Alabama’s 2019 proficiency level in fourth and eighth-grade math was dead last, 52 out of 52 (the 50 states plus the District of Columbia and the Department of Defense schools). In 2017, the state ranked No. 48 in fourth-grade math and 46 in eighth-grade math.
In fourth grade reading the state’s proficiency level was ranked 49 out of 52, dropping from 37 in 2017. In eighth grade reading the state’s ranking dropped from 43 to 49.
These national comparisons provide perspective. Alabama’s schools and teachers in high poverty communities face serious challenges, but hope can be found in the progress made by neighboring states and the steps being taken in Alabama to improve literacy and mathematics instruction.
Reference
[1] West, M (2012). Is Retaining Students in the Early Grades Self-Defeating? See https://www.brookings.edu/research/is-retaining-students-in-the-early-grades-self-defeating/