The 2020 Census: What’s at Stake for the State of Alabama
Alabama is at risk of
losing federal funding, a congressional seat, and an Electoral College vote.
These outcomes are based on projected results of the 2020 Census.
The 22nd decennial
census, mandated by the U.S. Constitution, begins on April 1, 2020. The census
counts every person living in the United States. Business, industry, nonprofits,
researchers, and governments use this information to understand and serve the
public. The Constitution requires the census. Federal law requires all people living
in the U.S. to respond.
The census is always a challenging project, but there are additional complications in 2020.
• The 2020 Census will
be the first census administered primarily online.
• Proposals to add a citizenship question have created confusion in many communities.
• Trust of government is at near historic lows.
• The Census Bureau
has reported to be behind in hiring field staff.
Regardless, the census
results will have a profound impact on every community in America. While
ultimately the responsibility of the federal government, the census is important
to the states, and most invest substantial resources to promote the census.
As of this writing,
Alabama has created the Alabama Counts! taskforce to promote the census and has
committed $1.24 million, or $0.25 per capita, to the effort, compared to an
average of $1.37 across the country, based on data reported by the National
Council of State Legislators.
The stated goal of
Alabama Counts! is to increase Alabama’s initial participation rate beyond the
72 percent reported in 2010. This figure represents the number of households
that returned a census form by mail. Those who did return a form by mail received
a visit from a census worker.
While increasing
Alabama’s initial participation rate is a worthy goal, it is worth remembering
that the national initial participation rate in 2010 was only 74 percent. A
significant increase in the initial participation rate will be difficult and
will require concerted effort from local officials in Alabama’s 67 counties and
the 460 towns and cities recognized by the Census Bureau.
Even if the efforts of Alabama Counts! are exceedingly successful, Alabama may well lose a congressional seat. Census workers simply cannot count people who are not here. And Alabama is simply not growing as fast as other states.
But how does Alabama compare? What options do we have? Find out the answers to these questions and more in the full report.
Mississippi’s Progress Not a Surprise; It was Part of a Plan
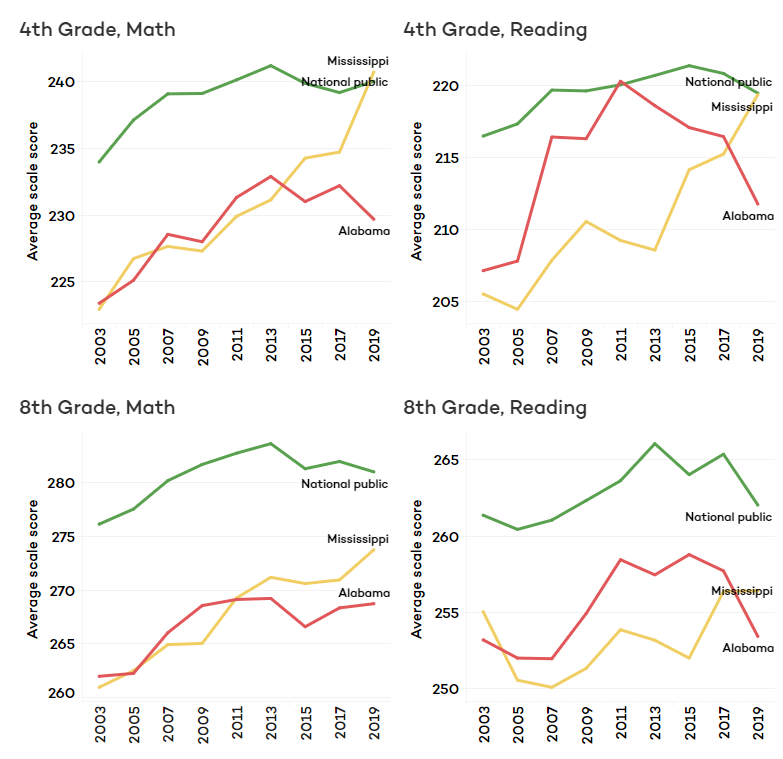
When the 2019 results of the National Assessment of Educational Progress (NAEP) were released last week, the good news was that fourth-grade students in our neighbor state, Mississippi, scored at the national average in both reading and math and that eighth graders there made significant gains in reading and math as well.
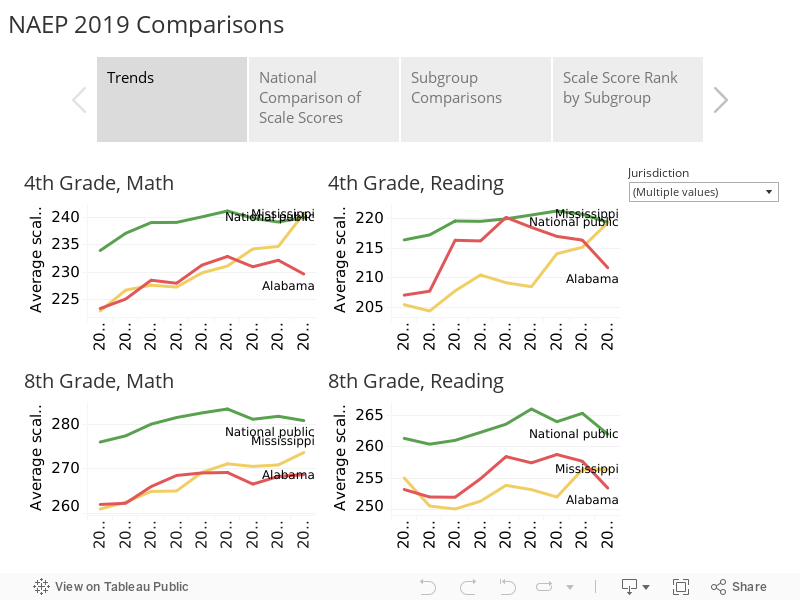
On all four measures, the average score for Mississippi students exceeds those of Alabama students, despite Mississippi’s higher level of poverty and higher percentage of students of color. The interactive chart below traces the average scale scores for Alabama and Mississippi students on the NAEP since 2003 on each of the four measures. The green line represents the average of public school students nationally. Other tabs in the chart allow you to explore other ways of looking at the data, including comparing demographically similar groups of students across states. In each of the main demographic and economic categories, Mississippi students are outperforming Alabama’s. The NAEP reading and math assessments are given every two years to a sample of students in each state, the sample representing the demographics of the state. It is the same assessment from year to year, and it is administered nationally. Known as the Nation’s Report Card, NAEP serves as the principal national measure of academic proficiency for U.S. education.
Mississippi has had a consistent and cohesive educationally-focused leadership in the Governor’s office, the State Legislature, and at the Mississippi Department of Education. Current superintendent Carrie Wright was recruited in 2013 from a leadership position in the District of Columbia’s rapidly improving public schools. Under Wright, and with the backing of an appointed state school board, Mississippi has operated under a plan that includes goals, objectives, and clearly articulated strategies aimed at meeting those goals. To track progress on the implementation of strategies and progress toward goals, the superintendent delivers an annual update that details actions taken to advance toward those goals.
Mississippi borrowed some aspects of its approach to improving reading from Alabama’s Reading Initiative. And more recently, Alabama borrowed from the Mississippi model. Earlier this year, the Alabama Legislature adopted a Literacy Act, similar to a Literacy-Based Promotion Act Mississippi adopted in 2013. Mississippi developed its own student assessment test for grades 3-8, MAAP, which was first deployed in the 2015-2016 school year. Alabama hopes to deploy its own state-developed assessment in the spring of 2020.
Over the long term, both Alabama and Mississippi have made progress in both reading and math. However, during Superintendent Wright’s tenure in Mississippi, Alabama has had five different superintendents. The State Department of Education did develop a state plan for education, Plan 2020, in 2012, but it was never fully developed and implemented and was shelved as subsequent superintendents came and went.
Reading
In 2011, just eight years ago, Alabama enjoyed the national spotlight when NAEP was released. Alabama fourth graders scored at the national average, having made the largest improvements in the U.S. That growth coincided with and has been generally attributed to the Alabama Reading Initiative (ARI). ARI emphasized a schoolwide commitment to getting all students reading at grade level, with an emphasis on Kindergarten through third grade. ARI placed a reading coach in every Alabama elementary school and required intensive professional development to teachers on research-based approaches to teaching reading.
However, after that achievement, and in the face of a constrained budget, funding for ARI was reduced, and schools were allowed to repurpose the state-funded reading coaches for other purposes. Reading scores on NAEP began drifting and in 2019 dropped sharply in both fourth and eighth grades.
Earlier this year, the Legislature adopted the Literacy Act, which will require that third graders be able to read, or they will be held back to repeat third grade. The Literacy Act, modeled after similar legislation in Mississippi and other Southeastern states, is expected to add urgency to reading instruction and to addressing reading challenges like dyslexia. ARI’s funding was also increased by $6.5 million, though at $51 million per year, that’s still far from the $64 million it received at its peak in 2008. Education leaders say the program will be restored to fidelity.
Math
While the 2019 reading results on NAEP were distressing for the severity of the drop, the math results for Alabama students were equally disturbing. Alabama school children in both the fourth and eighth grade had the lowest average test scores in the United States. It’s a familiar position for Alabama. Alabama ranked behind all other states in 2015. In 2017, Alabama students climbed a couple of notches in the rankings, but slipped back into last this year.
The state’s strategy for addressing math is less clear. In March of 2019, Gov. Kay Ivey put on hold new math standards, which had been developed by a statewide panel of educators. Ivey postponed adopting the changes to the math course of study after some conservative groups, who are opponents of the Common Core state standards, voiced their objections. In a letter to State Superintendent Eric Mackey, Ivy asked that Alabama’s new proposed math curriculum be compared to the math course of study for the top six performing states on the NAEP: Massachusetts, Minnesota, the Department of Defense’s educational system, Virginia, New Jersey, and Wyoming.
Considering Mississippi’s results, its approach to math should be examined as well. Mississippi did adopt the Common Core standards. Judging by national results, it safe to say that Common Core did not cause NAEP scores to leap. But it’s also true that states that did not adopt the Common Core have seen declines on the NAEP as well. Other factors may be contributing to an overall stagnation in educational progress. However, with Mississippi bucking the trend, Alabama would be well served to take note and inspiration from our neighbor’s progress.
Another Year of Strong Growth in Alabama Tax Collections
The thriving economy produced another year of surging tax collections for Alabama’s General Fund and Education Trust Fund (ETF), the two primary accounts that provide state funding for government operations. The better-than-projected results put the state in a good position to meet current obligations and weather a downturn should it arise.
It also appears that budgeting changes made by the Legislature in recent years have created more balance in revenue growth between the two funds.
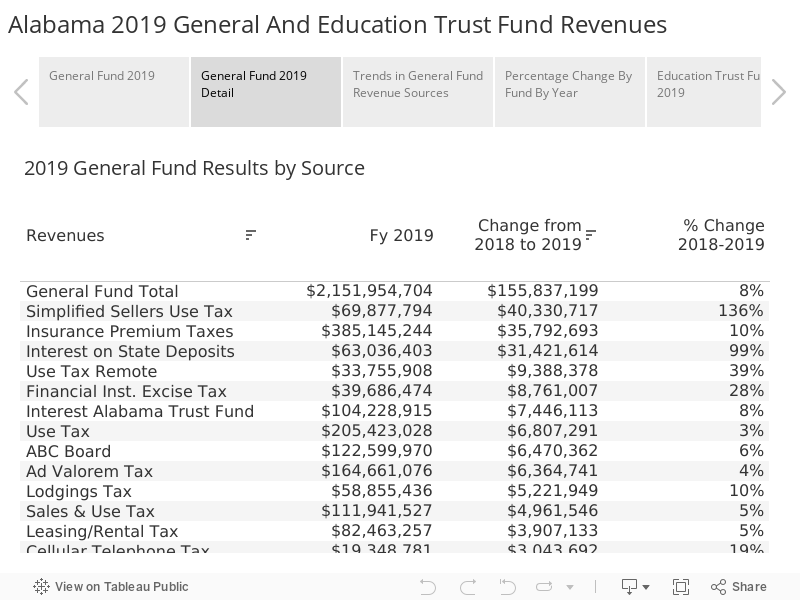
According to the state’s financial reports for the fiscal year that ended on Sept. 30, the taxes and revenues that feed the General Fund were up 8% over 2018. Revenue to the ETF increased by 7% over the previous year. It is unusual that the General Fund’s rate of growth exceeded the ETF’s. Historically, the ETF, which contains major growth taxes like the income and sales taxes, grows faster than the General Fund.
In dollar terms, General Fund revenue increased by $155,837,199.45
to a total of $2,151,954,704, while ETF collections rose by $461,710,824 to $7,215,276,202.89.
Collections in both funds exceeded projections.
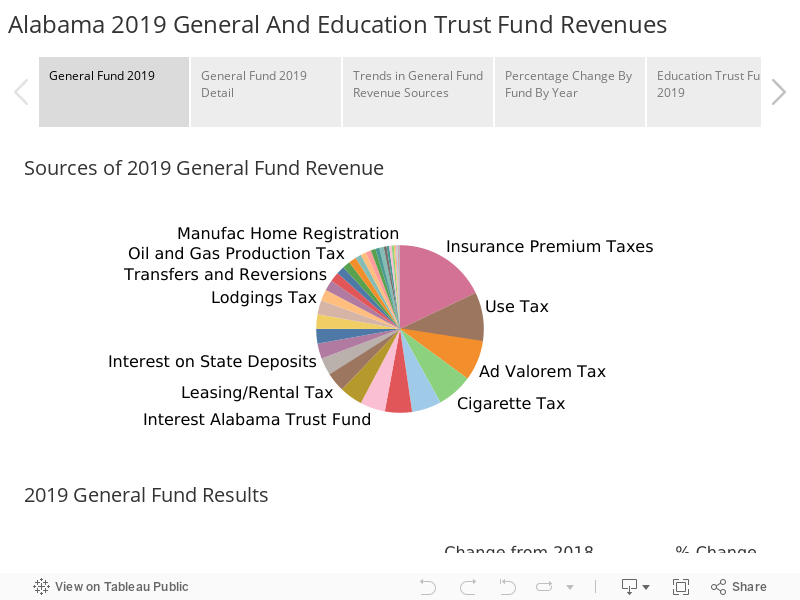
General Fund
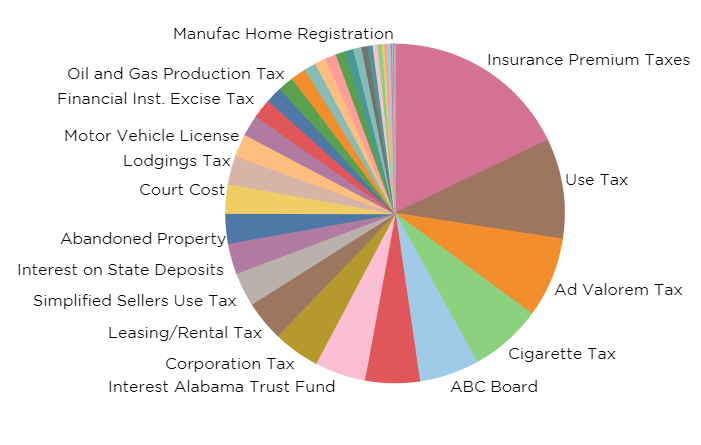
Alabama’s General Fund revenues are derived from a hodgepodge of taxes, most of which moved in a positive direction. General Fund spending supports health programs, like Medicaid and the Departments of Health and Mental Health, as well as law enforcement, the judicial and corrections system and other public safety agencies, plus a variety of other non-education programs.
In dollar terms, revenues from insurance premium taxes are the biggest contributor to the General Fund, providing $385 million or 18% of total collections. Those taxes, which are applied to the premiums paid by insurance policyholders, grew 10 percent over 2018, putting an additional $35 million into the General Fund.
There may be several reasons why this tax is growing at a faster rate than the overall economy. Since more people are employed and have more stable resources, more of them might be buying insurance in contrast to tougher economic times. At the same time, insurance companies may be charging more in premiums as they rebuild reserves needed to cover storm events and rising costs.
The Insurance Premium Tax is set to become an even bigger contributor to the General Fund in future years. A fixed amount of the tax, $31 million, had flowed into the Education Trust Fund. That division of the tax will end, and the total tax will flow into the General Fund. However, the transfer of this revenue comes with the understanding that the General Fund will have to cover the cost of the ALL Kids Children’s Health Insurance Program in future years, an expense that will rise over time.
In percentage terms, the tax that experienced the biggest jump in both its contribution to the General Fund and its rate of increase was the Simplified Sellers Use Tax. This is a tax paid on purchases made over the Internet and delivered to Alabama. Originally established in 2015 as a voluntary method for out-of-state sellers to remit sales tax to the state, the law has been increasingly tightened to require businesses that have significant online sales to participate. A 2018 decision by the U.S. Supreme Court, known as the Wayfair decision, gave further authority to collect taxes on online sales.
As more online retailers came aboard in 2019, General Fund revenue from the source jumped by 136% or $40 million to a total of $70 million for 2019. The General Fund gets 75% of the Simplified Sellers Use Tax. The remaining 25%, amounting to $23 million in 2019, went to the Education Trust Fund. So, the total revenue from the Simplified Sellers Use tax in 2019 rose to $93 million compared to $40 million the year before.
Growth in this tax will likely continue as online sales continue to rise, but the rate of increase should not be nearly as high in the future.
Also helping boost the General Fund were higher interest rates. The interest paid to the state on its cash deposits jumped by $31 million in 2019 to a total of $63 million. Interest rates have subsequently fallen so this revenue source may not be as robust in 2020.
The Use Tax, the General Fund’s second-largest source of revenue, saw a respectable 3% growth, bringing in an additional $6.8 million for a total of $205 million. The Use Tax is collected on out-of-state purchases or leasing of equipment or machinery.
Revenues contributed by the state-regulated alcohol sales were up by 6.5% to $123 million. Property taxes were up 4% to $165 million. The lodging tax jumped 10% to $59 million. Analysts believe a strong year at Baldwin Counties beaches provided a boost, assisted by increased tourism to Montgomery with the opening of the National Peace and Justice Memorial.
Some tax sources declined. Cigarette taxes continued their long slow decline, down 4 percent or $5.6 million. Still, cigarette taxes, which contributed $149 million in 2019, are the 4th largest tax source in the General Fund. Tax collections on vaping products increased 62% but are a very small source of revenue at $2.3 million for the General Fund in 2019.
While the $19 million contributed by the Cellular Phone tax appears to be an increase, base collections actually declined in 2019. The total collections for 2018 were depressed by a refund of the tax paid out as a result of a lawsuit. For the most part, mobile telephone companies no longer charge customers for calls but instead charge for data. Calling plans are taxed; data plans are not subject to tax.
Taxes on automobile titles dropped 6% after several years of gains. The decline could indicate a slowdown in auto sales, a development that would introduce a dark cloud to Alabama’s otherwise sunny economic horizon.
In the interactive chart below, you can compare trends in taxes since 2015. The menu on the right of the chart allows you to decide which taxes appear in the view.
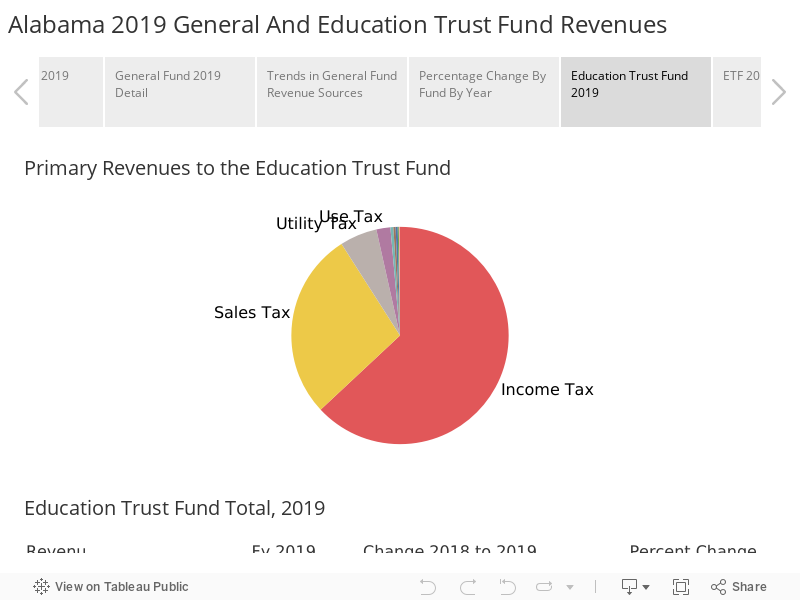
Education Trust Fund
Strong growth in income and solid sales tax growth powered another year of growth in the Education Trust Fund. Those two taxes, both of which are earmarked for education, supply over 90 percent of the education budget. In 2019, income tax collections made up 63% of ETF deposits, while sales taxes contributed 28%.
Income taxes were up $340 million, or 8%, for a total of $4.5 billion. According to financial reports, individual income tax receipts were up 6%, while corporate income taxes increased 15% over 2018. When refunds are taken into account, individuals paid $4.2 billion and corporations $455 million in income taxes.
Along with the general economic growth, the sharper rise in corporate tax collections was likely spurred by the cut in federal corporate income taxes, enacted in December of 2017. Federal income taxes are deductible from Alabama income taxes. With corporations paying less in Federal income taxes, that meant corporations kept a greater share of profits, leaving more corporate income for Alabama to tax.
Sales tax collections rose 6%, to $2 billion, contributing an additional $105 million to the ETF. Total sales tax receipts increased 4%, while the amount held back to pay state agencies decreased. The Department of Human Resources received a smaller sales tax refund because DHR is paying out less in SNAP benefits. The Alabama Department of Revenue also decreased the amount it assessed the state for sales tax collection.
Beyond the income and sales taxes, as noted above, the ETF portion of the Simplified Seller’s Use Tax grew by 136%. In the case of the ETF, that provided an additional $13 million for a total contribution of $23 million. The third-largest contributor to the Education Trust Fund is the utility tax, which brought in $401 million, which was a $5 million or 1% increase over 2018.
Implications of Better-than-Expected Growth
According to Finance Director Kelly Butler, the General Fund ended with a $275 million balance that will be available to appropriate in future budgets.
For the ETF, it’s a little more complicated, due to rules set up under the Rolling Reserve Act, a budgetary control measure designed to curb unsustainable spending and to generate a cushion for use during economic downturns.
According to Butler, the ETF generated an “overage” of $579 million in 2019. Of that, $66.5 million, or 1% of direct budgeted spending in the ETF, will be shifted to the ETF’s Budget Stabilization Fund.
The remaining $512 million will be shifted into the Advancement and Technology Fund. That money will be available for appropriation during the next legislative session to K-12 schools and colleges and universities for spending on non-recurring expenses such as deferred maintenance, school security measures, and educational technology or equipment.
The 7% growth rate for the 2019 ETF will be added to the calculation of the Rolling Reserve’s built-in cap on the growth of education spending. That budget cap is calculated by taking the ETF’s growth rate in each year of the past 15 years, dropping the year with the lowest growth rate, and then finding the average rate of growth for the remaining 14 years.
Despite the good results this year, that overall average will be down slightly. Thus, the allowed rate of growth in spending will be slightly lower in the 2021 budget than it was in the 2020 budget.
That’s because the year dropped from the 15-year window, 2004, was one of the extremely high growth years that preceded the Great Recession. In those years, recurring revenues to the ETF were increasing around 10 percent per year.
The average growth rate will be declining for the next couple of years as those high-growth years drop out of the calculations.
While a final calculation hasn’t been made, it is expected that the spending cap on the 2021 Education Trust Fund Budget will be somewhere between $300 and $400 million over the 2020 Education budget, which totaled $7.1 billion.
It’s important to remember that the Rolling Reserve Act creates a cap on increased spending. The Legislature is in no way obligated to spend up to the cap.
The Bigger Picture
Both the $2 billion General Fund and $7 billion Education Trust Fund are only part of the picture when it comes to paying for the operation of state government agencies. Beyond the tax sources detailed above, other state taxes are earmarked for certain purposes and sent directly to a designated agency.
There are also huge inflows from the federal government, particularly supporting Medicaid and other health programs, road construction and maintenance, and education. The federal contribution is a similar amount to what is generated by state taxes.
Other state agencies generate revenue. Colleges and universities charge tuition. Hunters and fishermen buy licenses that help fund the Department of Conservation and Natural Resources. Companies buy permits that help pay for inspections by the Alabama Department of Environmental Management. Those federal and state revenues are then spent supporting the agencies.
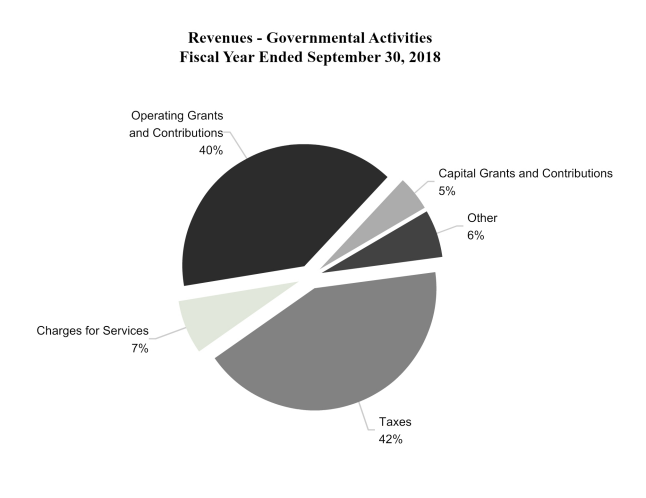
Alabama’s most recent Comprehensive Annual Financial Report (CAFR) details revenues and expenditures for Fiscal Year 2018. In terms of revenue, the CAFR indicates that total revenue was a little over $22 billion, more than double the tax collections deposited into the ETF and General Fund. The CAFR provides the chart below to illustrate the sources and proportion of all the revenues supporting the state governmental activities.
Source: Alabama 2018 Comprehensive Annual Financial Report, State Comptroller’s Office
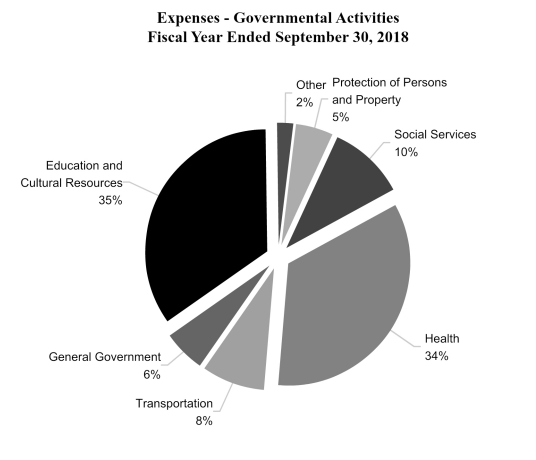
The CAFR also presents the government’s expenses for 2018, broken down by category of spending. On the surface, comparing the sizes of the General Fund and the ETF, it appears that we spend significantly more on education than we do on other functions of government. However, when federal funds and other earmarked taxes and revenues are taken into account, there is a more equal distribution of spending, with about one third spent on education and culture, about one-third spent on health, and one third spent on other functions: roads, law enforcement, the courts, prison, general government.
Source: Alabama 2018 Comprehensive Annual Financial Report, State Comptroller’s Office.